| Param | Original file | Final file |
|---|---|---|
| Filename | modeM0/AS1A11_060T01_9000004804_33508cztM0_level2.evt | modeM0/AS1A11_060T01_9000004804_33508cztM0_level2_quad_clean.evt |
| Size (bytes) | 434,652,480 | 65,831,040 |
| Size | 414.5 MB | 62.8 MB |
| Events in quadrant A | 2,440,971 | 420,750 |
| Events in quadrant B | 3,395,978 | 422,148 |
| Events in quadrant C | 3,364,378 | 405,605 |
| Events in quadrant D | 3,612,567 | 383,770 |
| Mode M9 | |||
|---|---|---|---|
| Quadrant | BADHDUFLAG | Total packets | Discarded packets |
| A | 0 | 26 | 0 |
| B | 0 | 26 | 0 |
| C | 0 | 26 | 0 |
| D | 0 | 27 | 0 |
| Mode M0 | |||
|---|---|---|---|
| Quadrant | BADHDUFLAG | Total packets | Discarded packets |
| A | 0 | 10429 | 3 |
| B | 0 | 13301 | 2 |
| C | 0 | 13498 | 2 |
| D | 0 | 14308 | 2 |
| Mode SS | |||
|---|---|---|---|
| Quadrant | BADHDUFLAG | Total packets | Discarded packets |
| A | 0 | 104 | 0 |
| B | 0 | 104 | 0 |
| C | 0 | 104 | 0 |
| D | 0 | 104 | 0 |
| Quadrant | Total seconds | Saturated seconds | Saturation percentage |
|---|---|---|---|
| A | 5154 | 6 | 0.116414% |
| B | 5154 | 170 | 3.298409% |
| C | 5154 | 89 | 1.726814% |
| D | 5154 | 108 | 2.095460% |
Noise dominated data is calculated using 1-second bins in cleaned event files. If a bin has >2000 counts, and if more than 50% of those come from <1% of pixels, then it is considered to be noise-dominated and hence unusable.
| Quadrant | # 1 sec bins | Bins with >0 counts | Bins with >2000 counts | High rate bins dominated by noise | Noise dominated (total time) | Noise dominated (detector-on time) | Marked lightcurve |
|---|---|---|---|---|---|---|---|
| A | 7037 | 5155 | 0 | 0 | 0.00% | 0.00% |  |
| B | 7037 | 5155 | 126 | 126 | 1.79% | 2.44% | 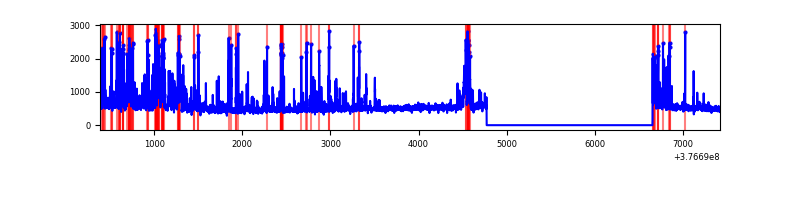 |
| C | 7037 | 5155 | 78 | 78 | 1.11% | 1.51% | 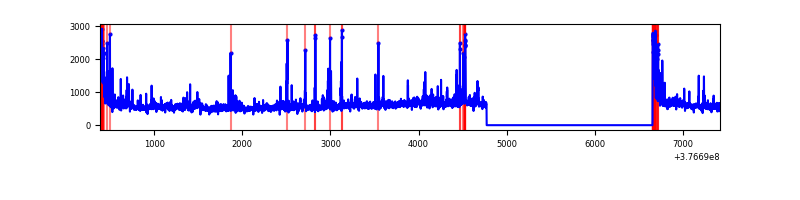 |
| D | 7037 | 5155 | 106 | 106 | 1.51% | 2.06% | 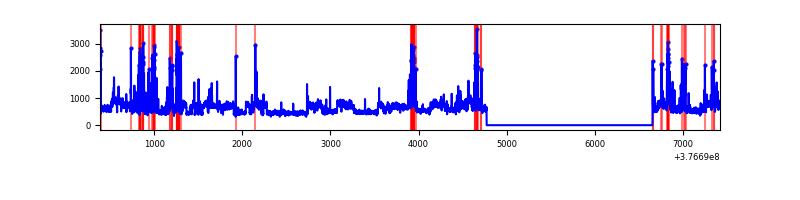 |
Top three noisy pixels from each quadrant. If the there are fewer than three noisy pixels in the level2.evt file, extra rows are filled as -1
| Pixel properties | Quadrant properties | ||||||
|---|---|---|---|---|---|---|---|
| Quadrant | DetID | PixID | Counts | Sigma | Mean | Median | Sigma |
| A | 13 | 6 | 8110 | 59.43 | 629 | 620 | 126.0 |
| A | 13 | 254 | 7949 | 58.15 | 629 | 620 | 126.0 |
| A | 3 | 137 | 6136 | 43.77 | 629 | 620 | 126.0 |
| B | 5 | 255 | 537693 | 4421.43 | 628 | 612 | 121.5 |
| B | 5 | 172 | 388421 | 3192.57 | 628 | 612 | 121.5 |
| B | 12 | 111 | 14180 | 111.7 | 628 | 612 | 121.5 |
| C | 15 | 214 | 224296 | 1581.38 | 613 | 619 | 141.4 |
| C | 0 | 10 | 208209 | 1467.65 | 613 | 619 | 141.4 |
| C | 3 | 233 | 201101 | 1417.4 | 613 | 619 | 141.4 |
| D | 8 | 195 | 739010 | 5013.35 | 605 | 590 | 147.3 |
| D | 2 | 250 | 196695 | 1331.41 | 605 | 590 | 147.3 |
| D | 12 | 6 | 102123 | 689.34 | 605 | 590 | 147.3 |
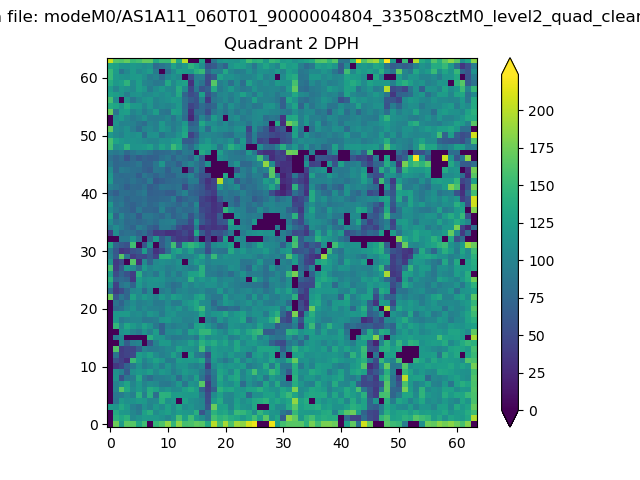
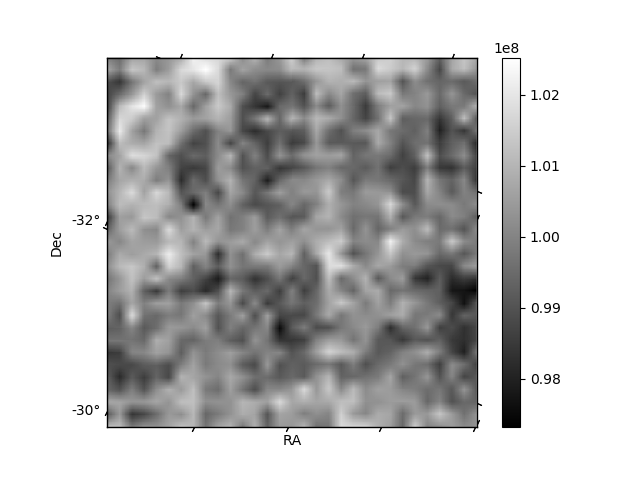
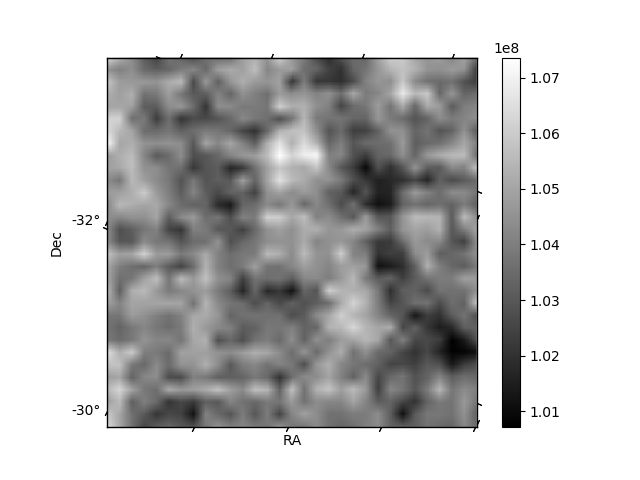
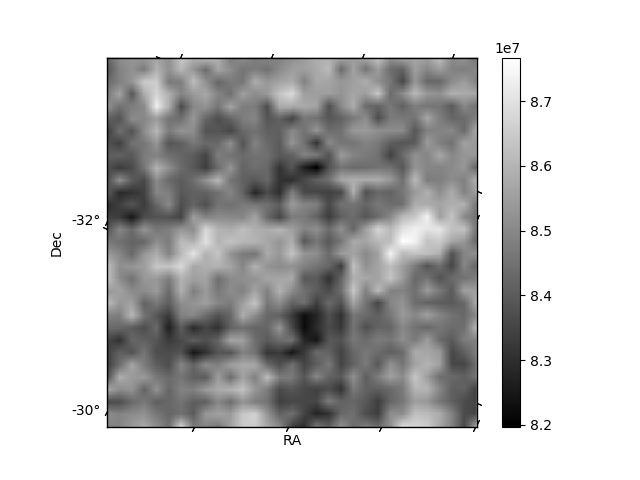
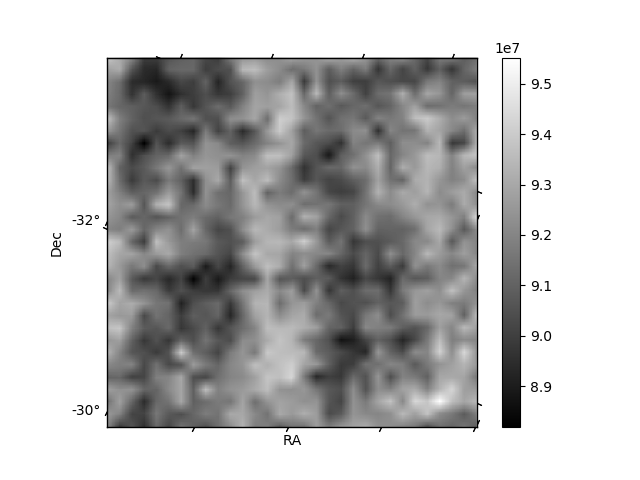
Histogram calculated using DETX and DETY for each event in the final _common_clean file
| Quadrant A | 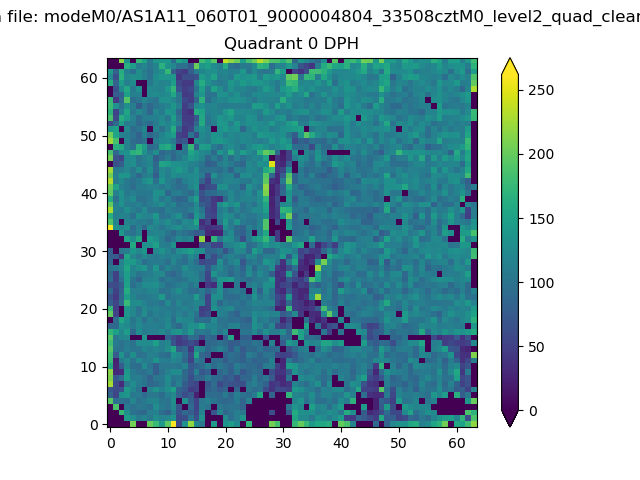 |
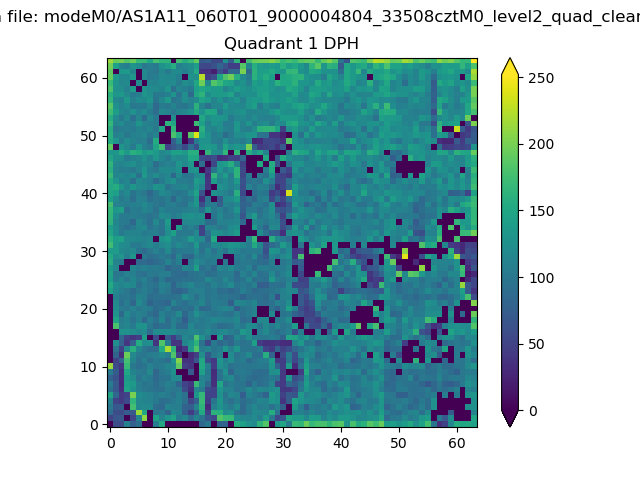 |
Quadrant B |
|---|---|---|---|
| Quadrant D | 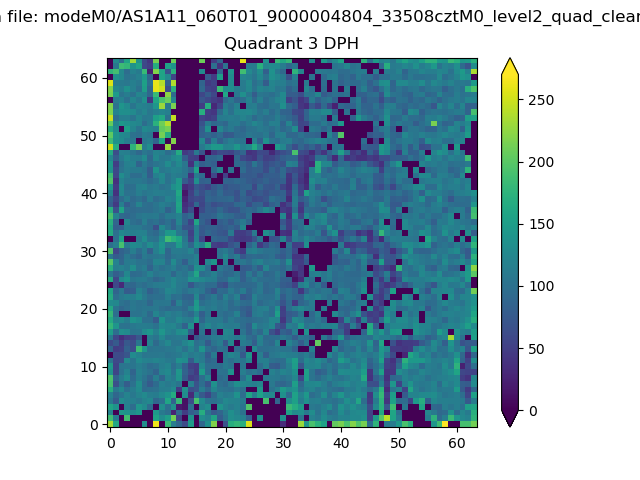 |
 |
Quadrant C |
| Plot type | Count rate plots | Images |
|---|---|---|
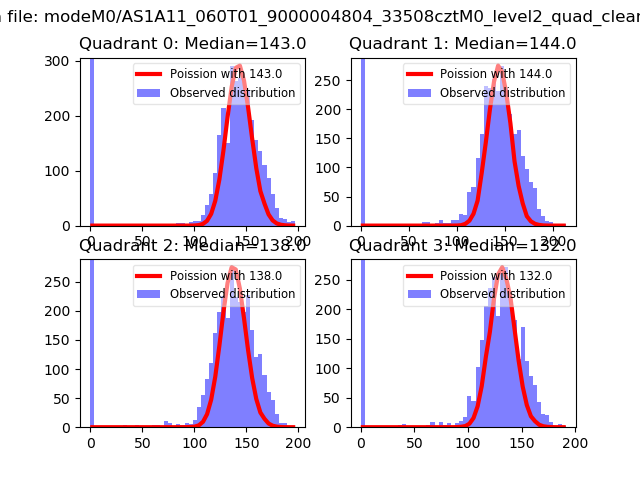
| Comparison with Poisson distribution Blue bars denote a histogram of data divided into 1 sec bins. Red curve is a Poisson curve with rate = median count rate of data. |
 |
 |
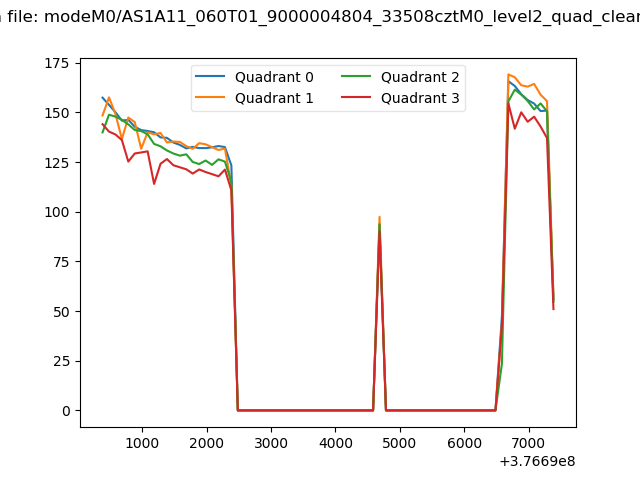
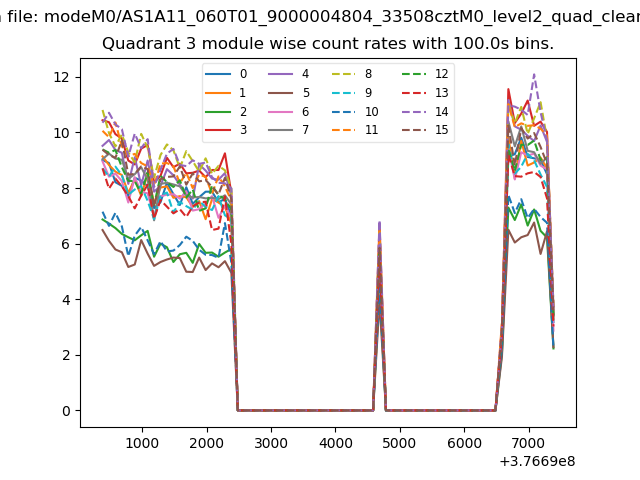
| Quadrant-wise count rates Data is divided into 100 sec bins |
 |
|
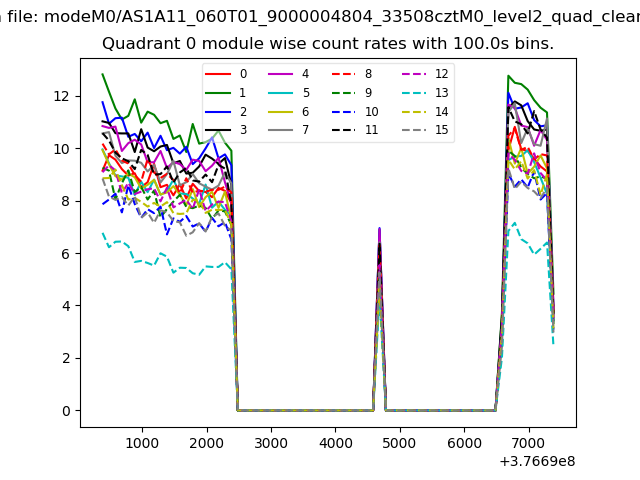
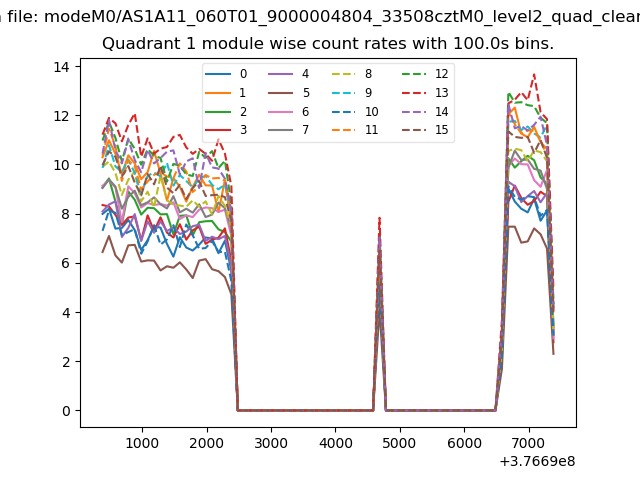
| Module-wise count rates for Quadrant A Data is divided into 100 sec bins |
 |
 |
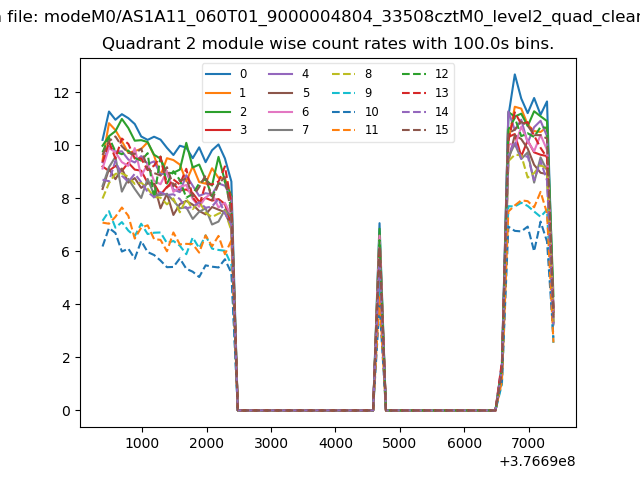
| Module-wise count rates for Quadrant B Data is divided into 100 sec bins |
 |
 |
| Module-wise count rates for Quadrant C Data is divided into 100 sec bins |
 |
 |
| Module-wise count rates for Quadrant D Data is divided into 100 sec bins |
 |
 |
| Parameter | Plot |
|---|---|
| CZT HV Monitor | 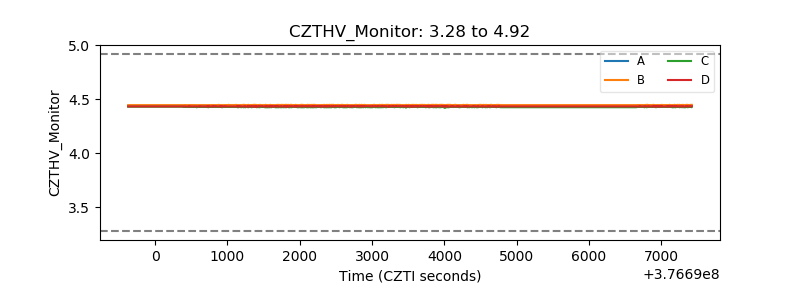 |
| D_VDD | 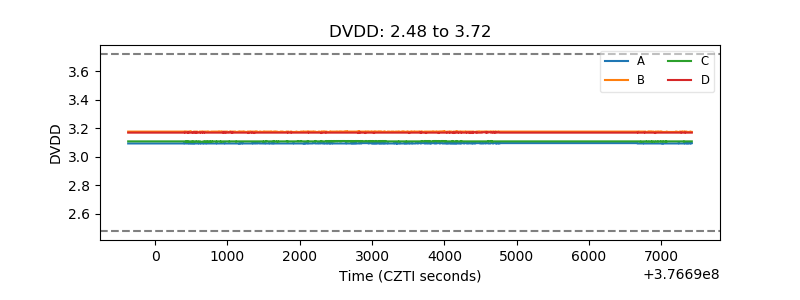 |
| Temperature 1 | 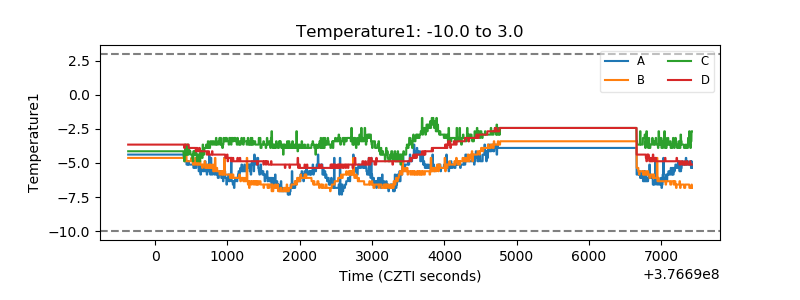 |
| Veto HV Monitor | 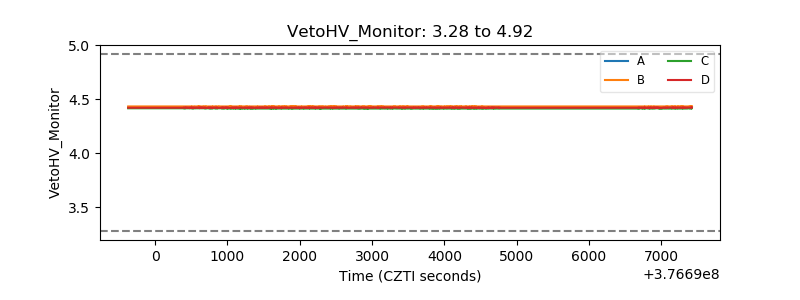 |
| Veto LLD | 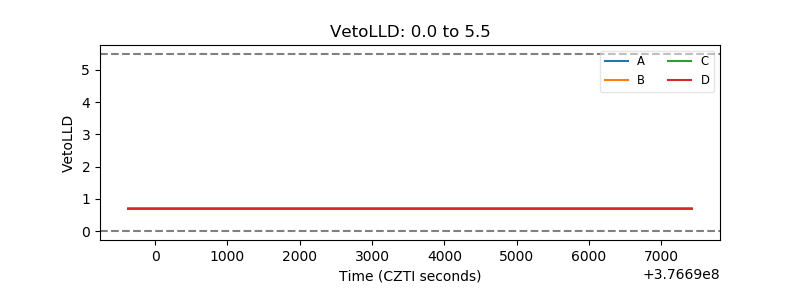 |
| Alpha Counter | 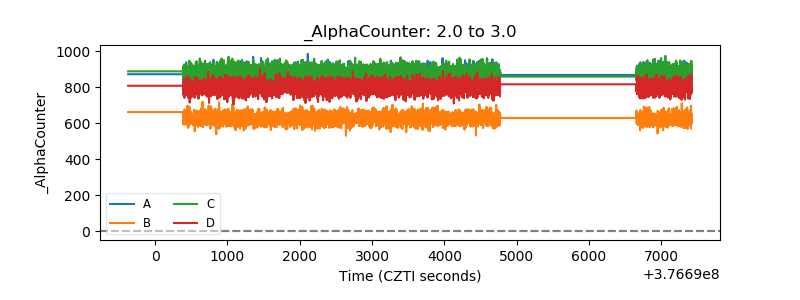 |
| _CPM_Rate | 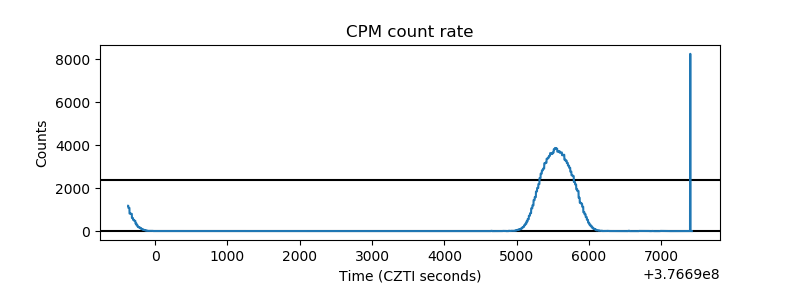 |
| CZT Counter | 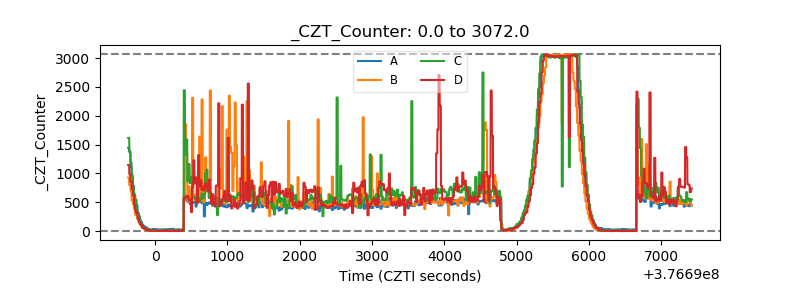 |
| +2.5 Volts monitor |  |
| +5 Volts monitor | 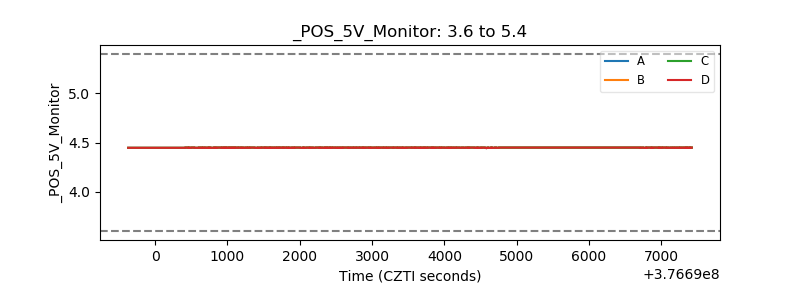 |
| _ROLL_ROT | 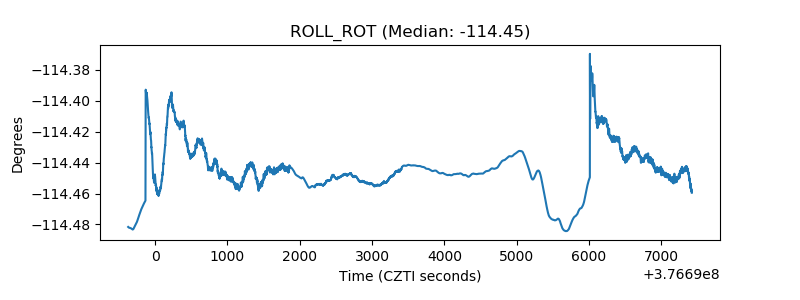 |
| _Roll_DEC | 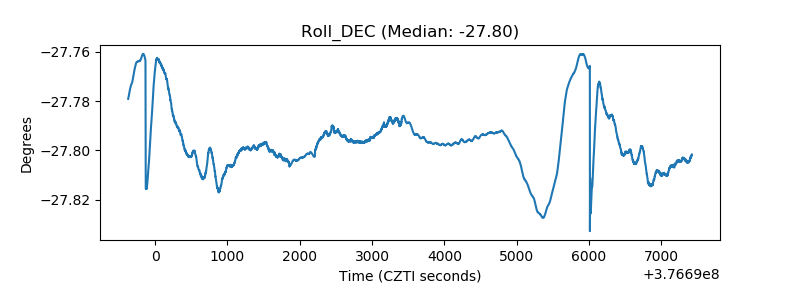 |
| _Roll_RA | 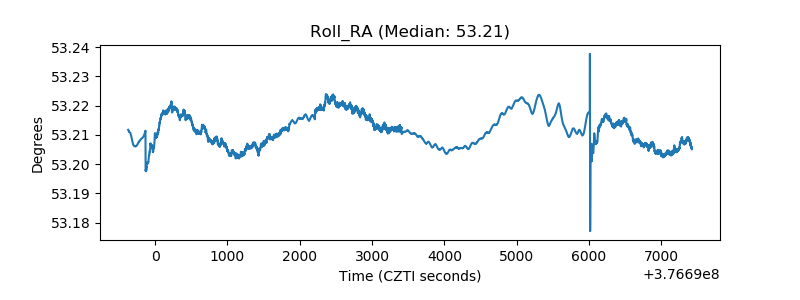 |
| Veto Counter | 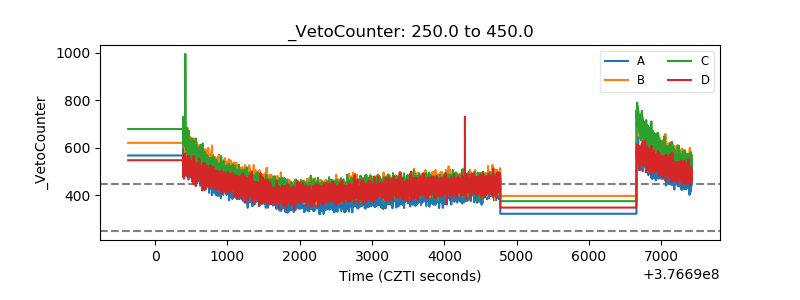 |