| Param | Original file | Final file |
|---|---|---|
| Filename | modeM0/AS1A11_060T01_9000004804_33510cztM0_level2.evt | modeM0/AS1A11_060T01_9000004804_33510cztM0_level2_quad_clean.evt |
| Size (bytes) | 534,945,600 | 65,350,080 |
| Size | 510.2 MB | 62.3 MB |
| Events in quadrant A | 2,545,905 | 425,298 |
| Events in quadrant B | 5,313,399 | 389,787 |
| Events in quadrant C | 3,354,948 | 419,370 |
| Events in quadrant D | 4,638,776 | 383,743 |
| Mode M9 | |||
|---|---|---|---|
| Quadrant | BADHDUFLAG | Total packets | Discarded packets |
| A | 0 | 31 | 0 |
| B | 0 | 31 | 0 |
| C | 0 | 31 | 0 |
| D | 0 | 32 | 0 |
| Mode M0 | |||
|---|---|---|---|
| Quadrant | BADHDUFLAG | Total packets | Discarded packets |
| A | 0 | 10443 | 3 |
| B | 0 | 19119 | 2 |
| C | 0 | 13162 | 2 |
| D | 0 | 17328 | 2 |
| Mode SS | |||
|---|---|---|---|
| Quadrant | BADHDUFLAG | Total packets | Discarded packets |
| A | 0 | 106 | 0 |
| B | 0 | 106 | 0 |
| C | 0 | 106 | 0 |
| D | 0 | 106 | 0 |
| Quadrant | Total seconds | Saturated seconds | Saturation percentage |
|---|---|---|---|
| A | 5133 | 9 | 0.175336% |
| B | 5133 | 978 | 19.053185% |
| C | 5133 | 119 | 2.318332% |
| D | 5133 | 317 | 6.175726% |
Noise dominated data is calculated using 1-second bins in cleaned event files. If a bin has >2000 counts, and if more than 50% of those come from <1% of pixels, then it is considered to be noise-dominated and hence unusable.
| Quadrant | # 1 sec bins | Bins with >0 counts | Bins with >2000 counts | High rate bins dominated by noise | Noise dominated (total time) | Noise dominated (detector-on time) | Marked lightcurve |
|---|---|---|---|---|---|---|---|
| A | 7227 | 5134 | 0 | 0 | 0.00% | 0.00% | 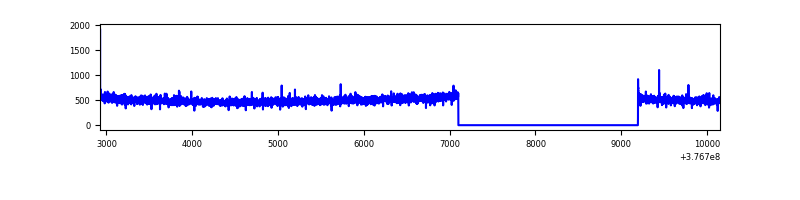 |
| B | 7227 | 5134 | 772 | 772 | 10.68% | 15.04% | 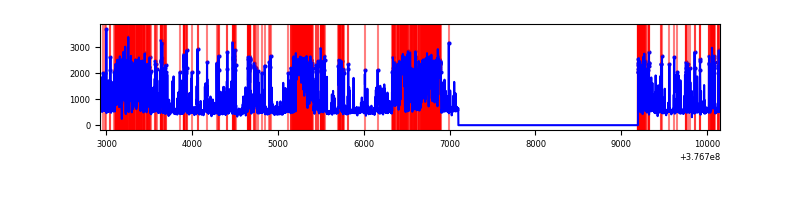 |
| C | 7227 | 5134 | 117 | 117 | 1.62% | 2.28% | 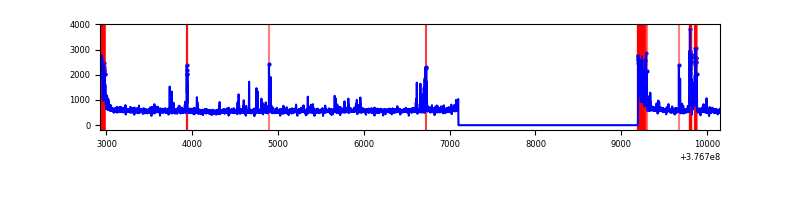 |
| D | 7226 | 5133 | 301 | 301 | 4.17% | 5.86% | 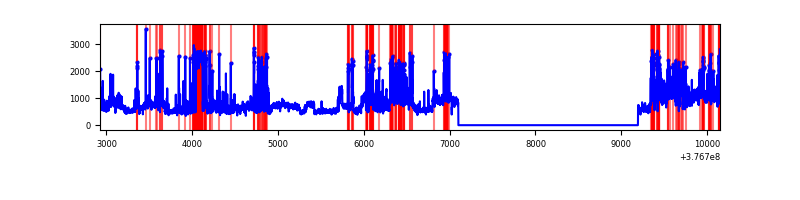 |
Top three noisy pixels from each quadrant. If the there are fewer than three noisy pixels in the level2.evt file, extra rows are filled as -1
| Pixel properties | Quadrant properties | ||||||
|---|---|---|---|---|---|---|---|
| Quadrant | DetID | PixID | Counts | Sigma | Mean | Median | Sigma |
| A | 13 | 254 | 8950 | 63.44 | 657 | 644 | 130.9 |
| A | 3 | 137 | 5896 | 40.11 | 657 | 644 | 130.9 |
| A | 10 | 83 | 5754 | 39.03 | 657 | 644 | 130.9 |
| B | 5 | 172 | 1645941 | 14225.48 | 610 | 595 | 115.7 |
| B | 5 | 255 | 1228014 | 10612.13 | 610 | 595 | 115.7 |
| B | 4 | 171 | 25504 | 215.36 | 610 | 595 | 115.7 |
| C | 0 | 10 | 246279 | 1641.79 | 652 | 660 | 149.6 |
| C | 15 | 214 | 227176 | 1514.1 | 652 | 660 | 149.6 |
| C | 9 | 236 | 127337 | 846.75 | 652 | 660 | 149.6 |
| D | 8 | 195 | 672892 | 4404.37 | 630 | 615 | 152.6 |
| D | 2 | 250 | 498796 | 3263.79 | 630 | 615 | 152.6 |
| D | 14 | 52 | 399878 | 2615.74 | 630 | 615 | 152.6 |
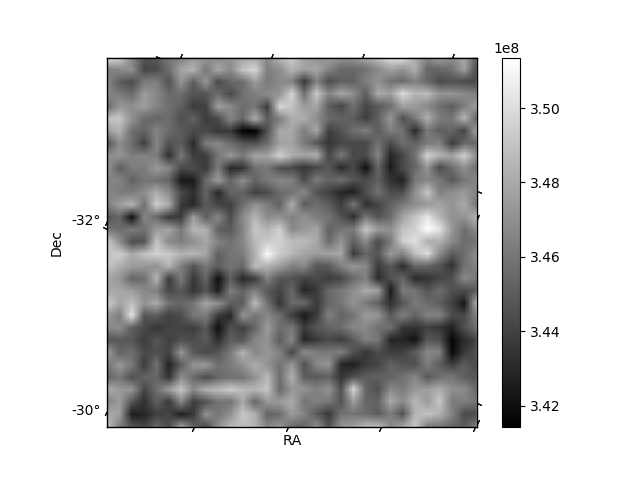
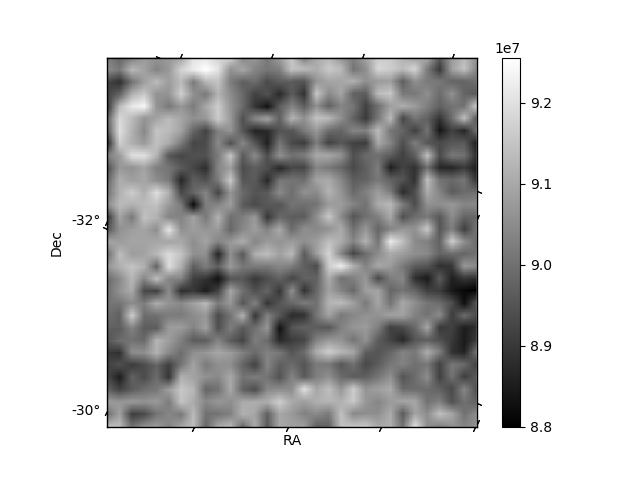
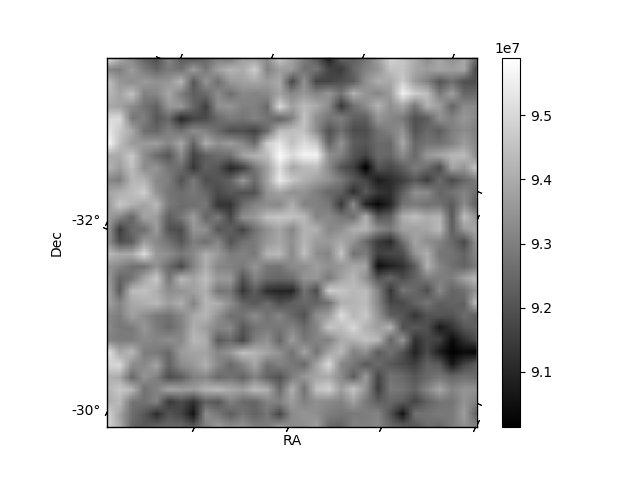
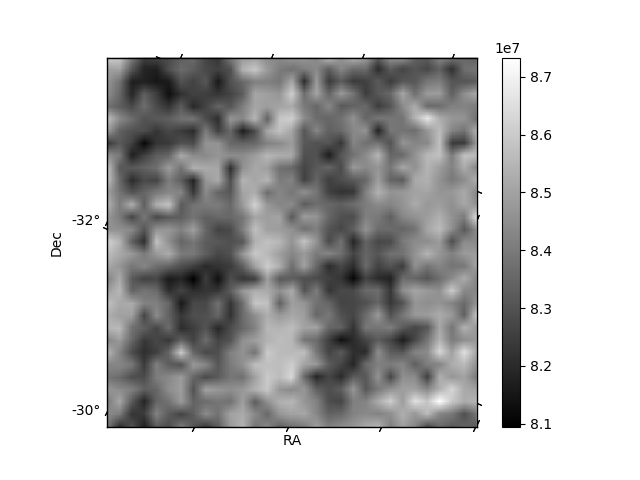
Histogram calculated using DETX and DETY for each event in the final _common_clean file
| Quadrant A | 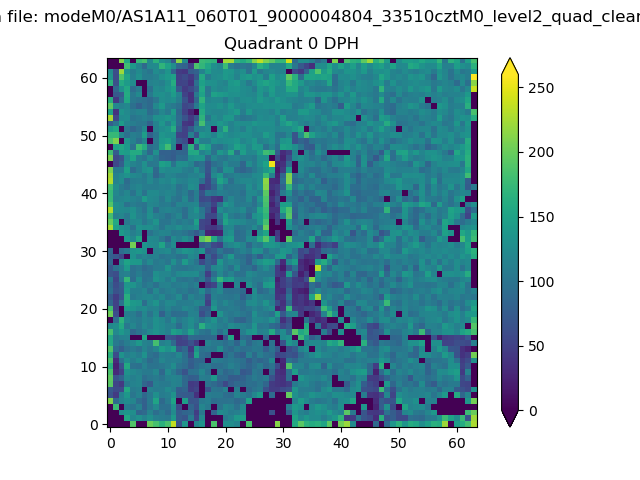 |
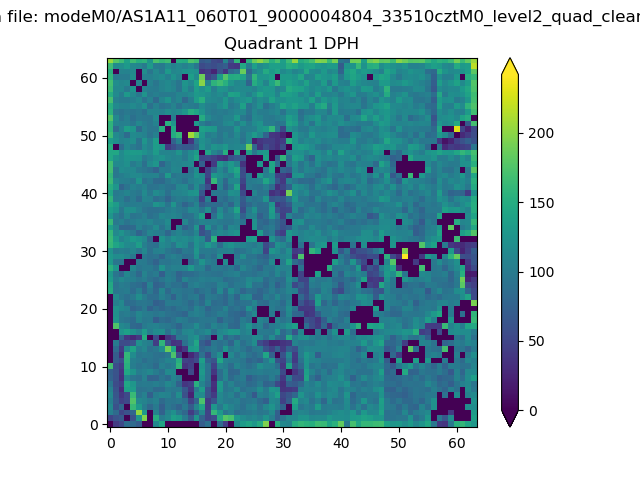 |
Quadrant B |
|---|---|---|---|
| Quadrant D | 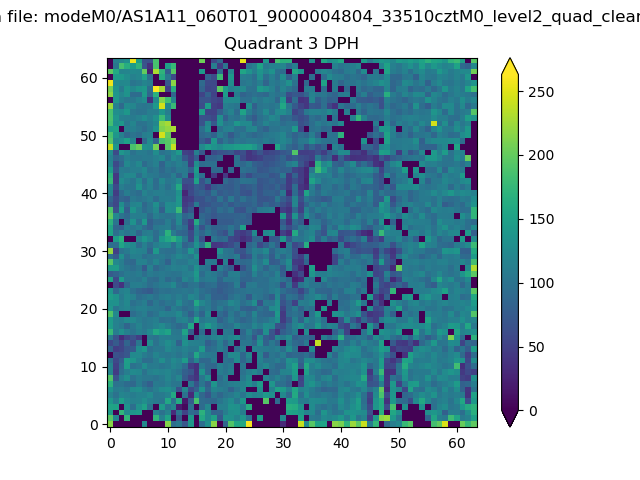 |
 |
Quadrant C |
| Plot type | Count rate plots | Images |
|---|---|---|
| Comparison with Poisson distribution Blue bars denote a histogram of data divided into 1 sec bins. Red curve is a Poisson curve with rate = median count rate of data. |
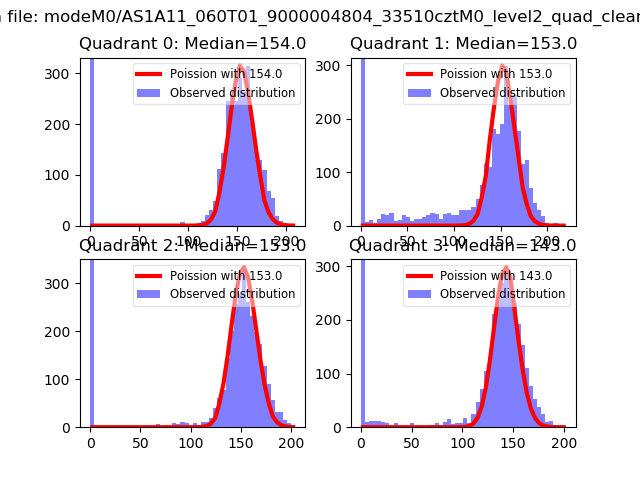 |
 |
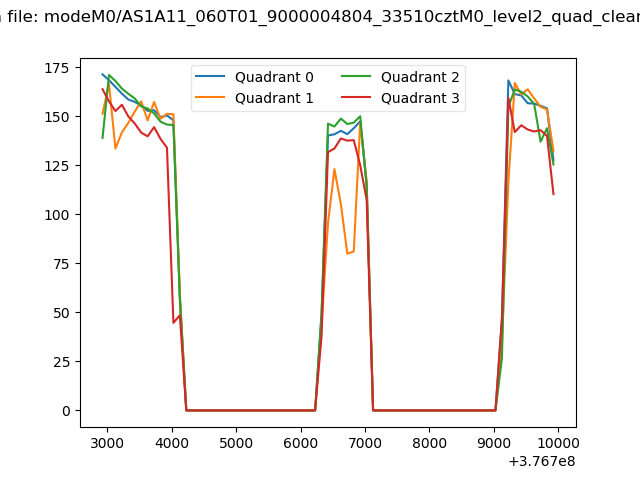
| Quadrant-wise count rates Data is divided into 100 sec bins |
 |
|
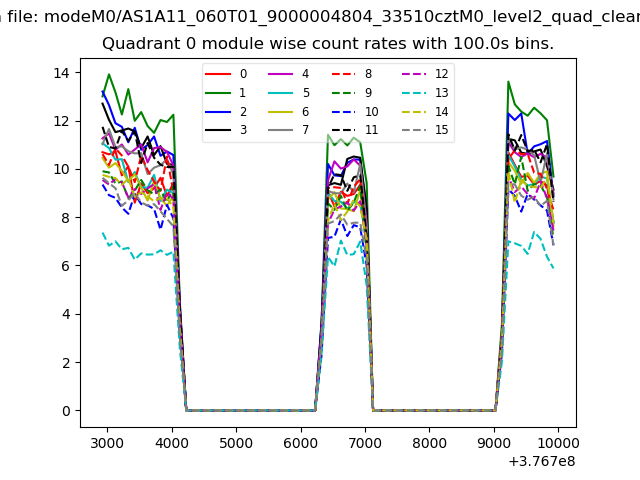
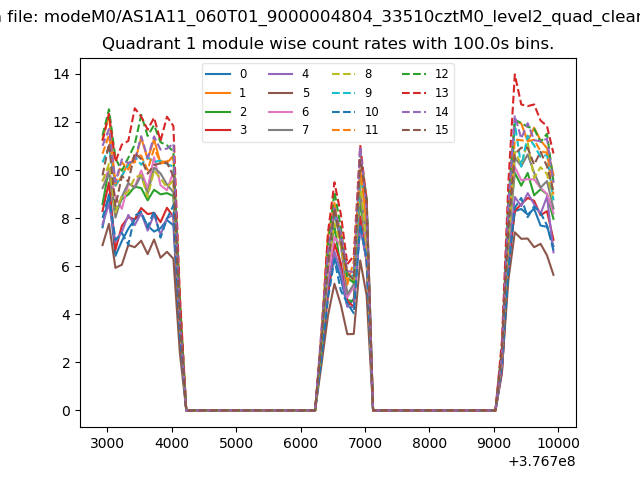
| Module-wise count rates for Quadrant A Data is divided into 100 sec bins |
 |
 |
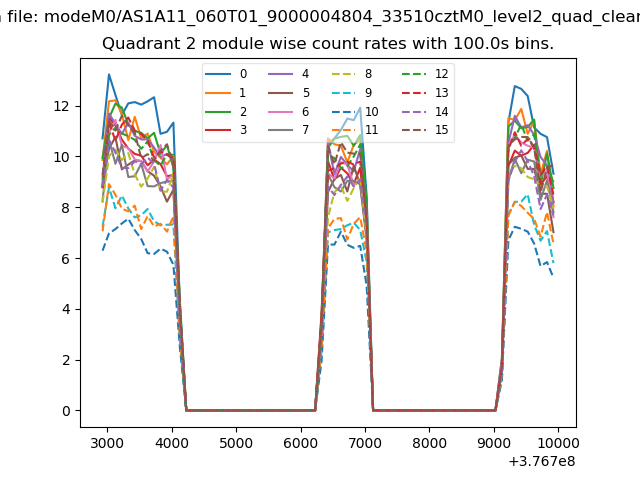
| Module-wise count rates for Quadrant B Data is divided into 100 sec bins |
 |
 |
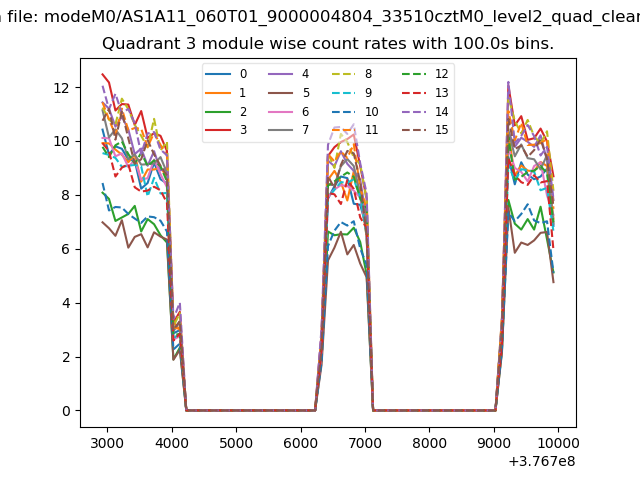
| Module-wise count rates for Quadrant C Data is divided into 100 sec bins |
 |
 |
| Module-wise count rates for Quadrant D Data is divided into 100 sec bins |
 |
 |
| Parameter | Plot |
|---|---|
| CZT HV Monitor | 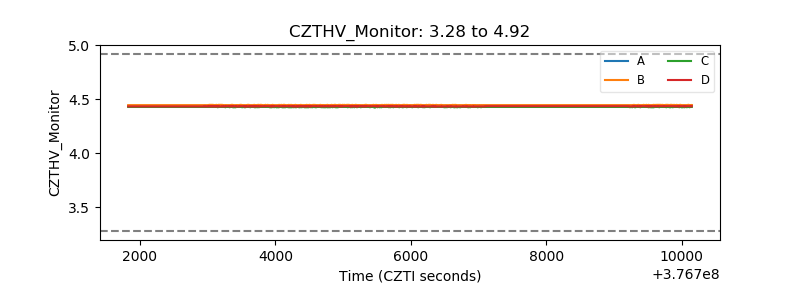 |
| D_VDD | 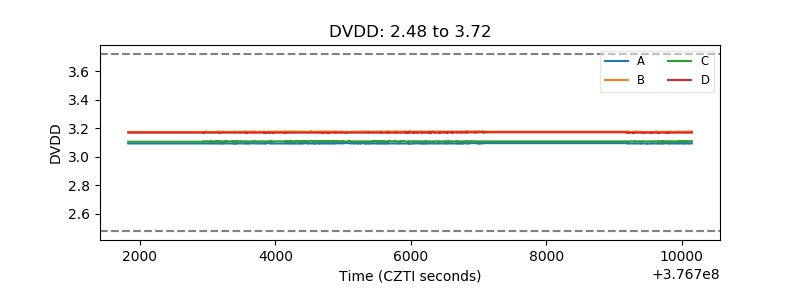 |
| Temperature 1 | 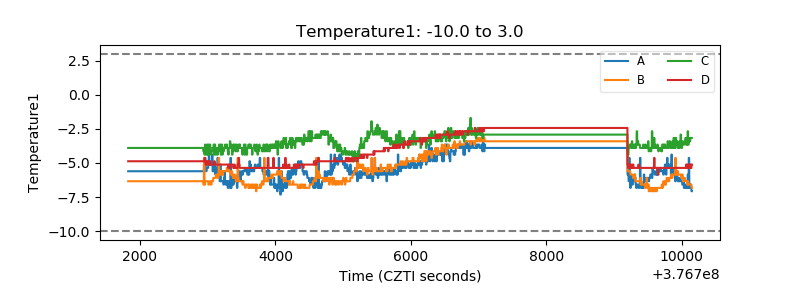 |
| Veto HV Monitor | 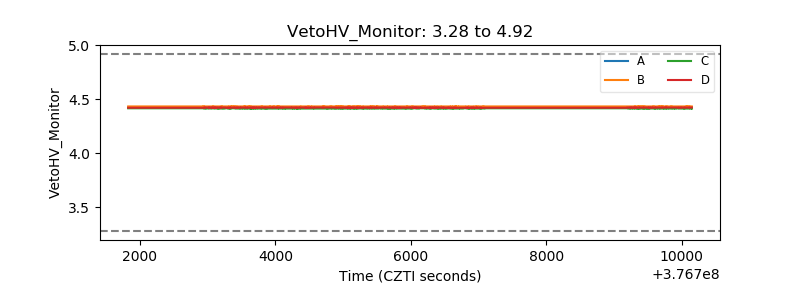 |
| Veto LLD | 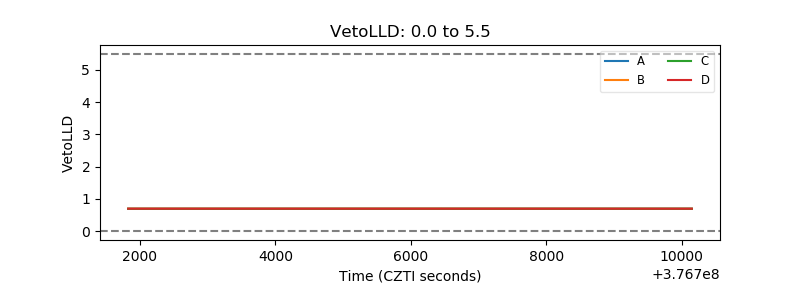 |
| Alpha Counter | 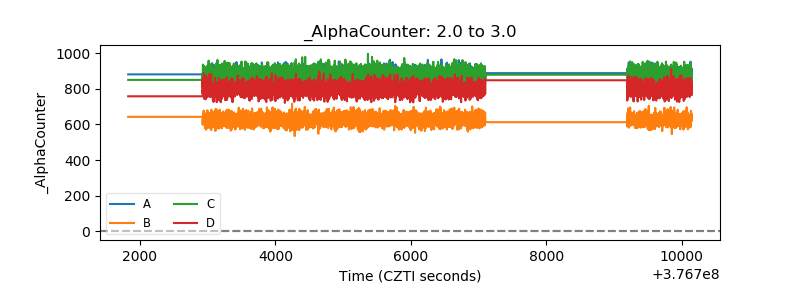 |
| _CPM_Rate | 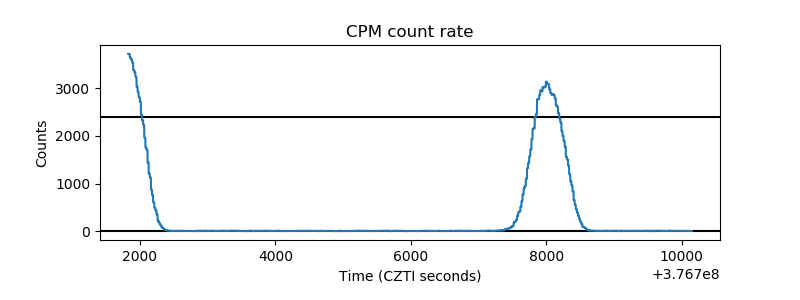 |
| CZT Counter | 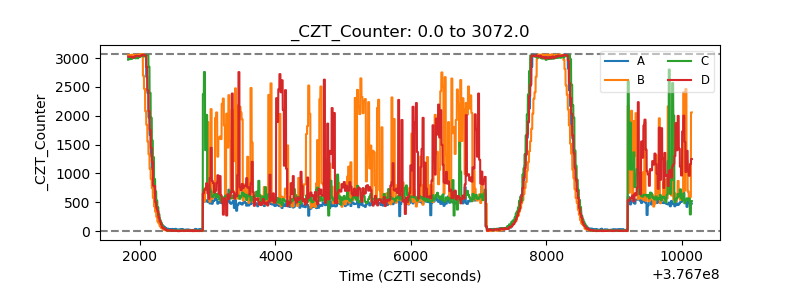 |
| +2.5 Volts monitor |  |
| +5 Volts monitor |  |
| _ROLL_ROT | 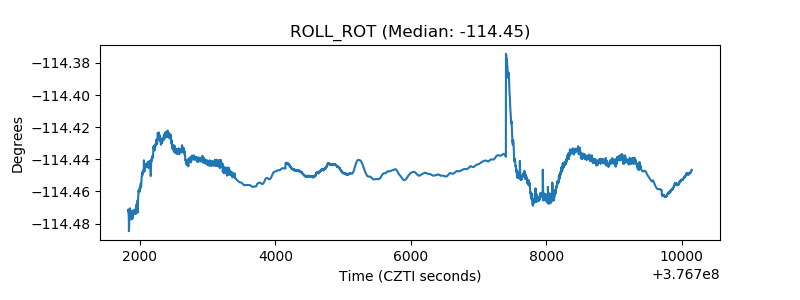 |
| _Roll_DEC | 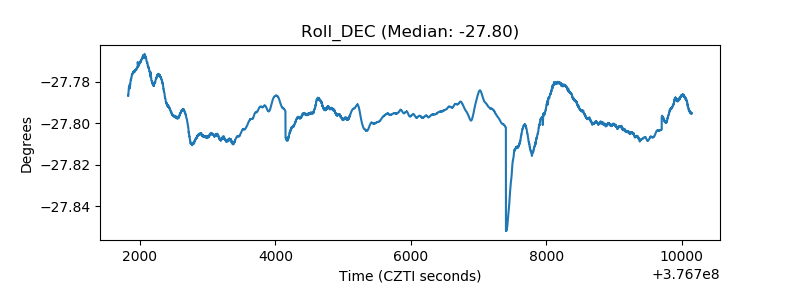 |
| _Roll_RA | 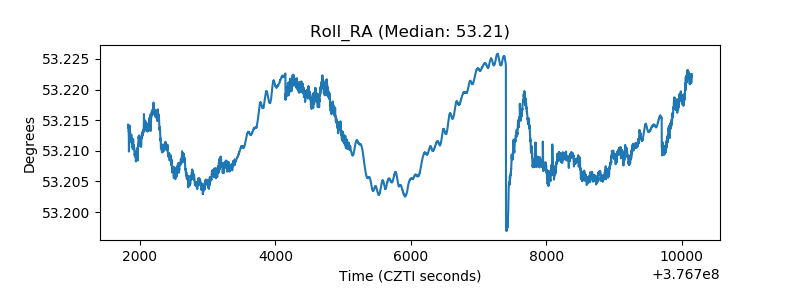 |
| Veto Counter | 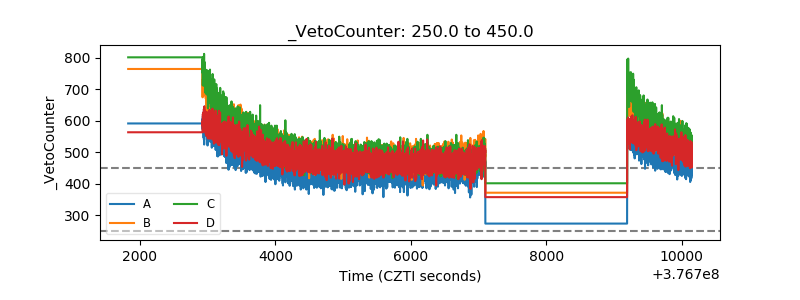 |