| Param | Original file | Final file |
|---|---|---|
| Filename | modeM0/AS1A11_060T01_9000004804_33511cztM0_level2.evt | modeM0/AS1A11_060T01_9000004804_33511cztM0_level2_quad_clean.evt |
| Size (bytes) | 469,344,960 | 55,641,600 |
| Size | 447.6 MB | 53.1 MB |
| Events in quadrant A | 2,435,397 | 344,332 |
| Events in quadrant B | 3,406,841 | 342,258 |
| Events in quadrant C | 3,215,156 | 340,066 |
| Events in quadrant D | 4,821,173 | 310,469 |
| Mode M9 | |||
|---|---|---|---|
| Quadrant | BADHDUFLAG | Total packets | Discarded packets |
| A | 0 | 30 | 0 |
| B | 0 | 30 | 0 |
| C | 0 | 30 | 0 |
| D | 0 | 31 | 0 |
| Mode M0 | |||
|---|---|---|---|
| Quadrant | BADHDUFLAG | Total packets | Discarded packets |
| A | 0 | 10004 | 3 |
| B | 0 | 13153 | 2 |
| C | 0 | 12619 | 2 |
| D | 0 | 17666 | 2 |
| Mode SS | |||
|---|---|---|---|
| Quadrant | BADHDUFLAG | Total packets | Discarded packets |
| A | 0 | 102 | 0 |
| B | 0 | 102 | 0 |
| C | 0 | 102 | 0 |
| D | 0 | 102 | 0 |
| Quadrant | Total seconds | Saturated seconds | Saturation percentage |
|---|---|---|---|
| A | 4948 | 9 | 0.181892% |
| B | 4948 | 252 | 5.092967% |
| C | 4948 | 106 | 2.142280% |
| D | 4948 | 343 | 6.932094% |
Noise dominated data is calculated using 1-second bins in cleaned event files. If a bin has >2000 counts, and if more than 50% of those come from <1% of pixels, then it is considered to be noise-dominated and hence unusable.
| Quadrant | # 1 sec bins | Bins with >0 counts | Bins with >2000 counts | High rate bins dominated by noise | Noise dominated (total time) | Noise dominated (detector-on time) | Marked lightcurve |
|---|---|---|---|---|---|---|---|
| A | 7071 | 4949 | 0 | 0 | 0.00% | 0.00% | 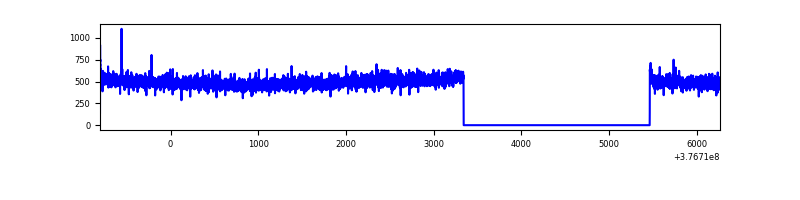 |
| B | 7071 | 4949 | 193 | 193 | 2.73% | 3.90% |  |
| C | 7071 | 4949 | 99 | 99 | 1.40% | 2.00% | 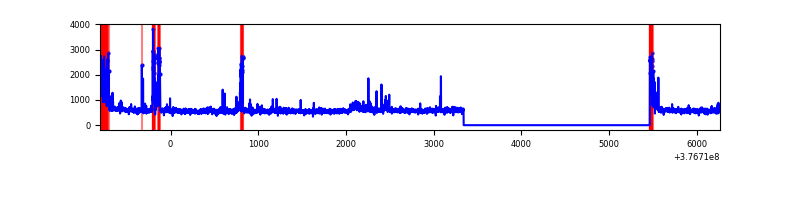 |
| D | 7071 | 4948 | 351 | 351 | 4.96% | 7.09% | 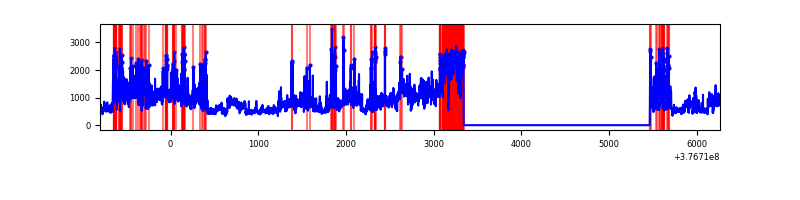 |
Top three noisy pixels from each quadrant. If the there are fewer than three noisy pixels in the level2.evt file, extra rows are filled as -1
| Pixel properties | Quadrant properties | ||||||
|---|---|---|---|---|---|---|---|
| Quadrant | DetID | PixID | Counts | Sigma | Mean | Median | Sigma |
| A | 13 | 254 | 8708 | 64.6 | 628 | 616 | 125.3 |
| A | 3 | 137 | 5899 | 42.18 | 628 | 616 | 125.3 |
| A | 13 | 6 | 5737 | 40.88 | 628 | 616 | 125.3 |
| B | 5 | 172 | 503605 | 4259.87 | 622 | 607 | 118.1 |
| B | 5 | 255 | 422805 | 3575.58 | 622 | 607 | 118.1 |
| B | 15 | 222 | 15171 | 123.34 | 622 | 607 | 118.1 |
| C | 15 | 214 | 229688 | 1610.94 | 621 | 629 | 142.2 |
| C | 0 | 10 | 216305 | 1516.82 | 621 | 629 | 142.2 |
| C | 3 | 233 | 169674 | 1188.87 | 621 | 629 | 142.2 |
| D | 2 | 120 | 775003 | 5296.18 | 606 | 591 | 146.2 |
| D | 8 | 195 | 721608 | 4931.01 | 606 | 591 | 146.2 |
| D | 14 | 52 | 502266 | 3430.94 | 606 | 591 | 146.2 |
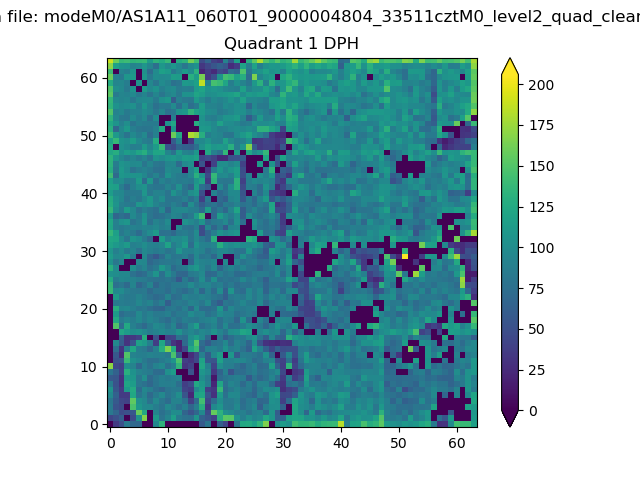
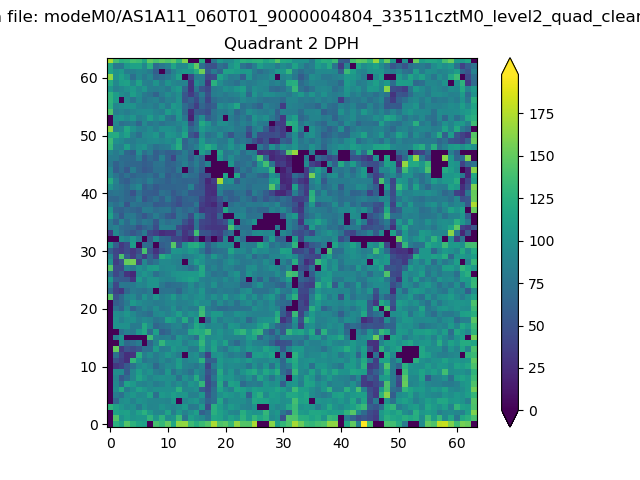
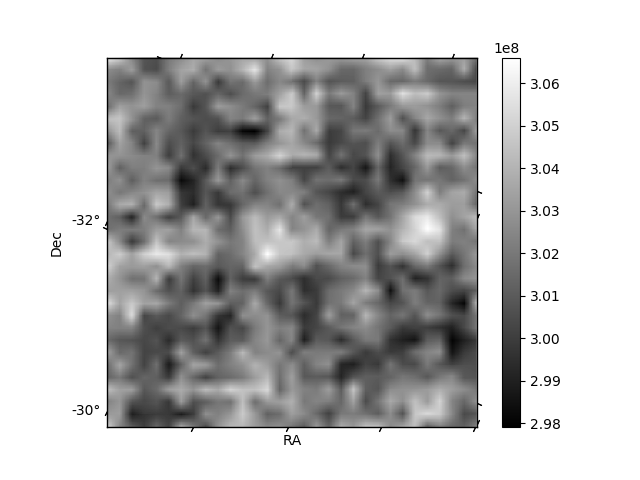
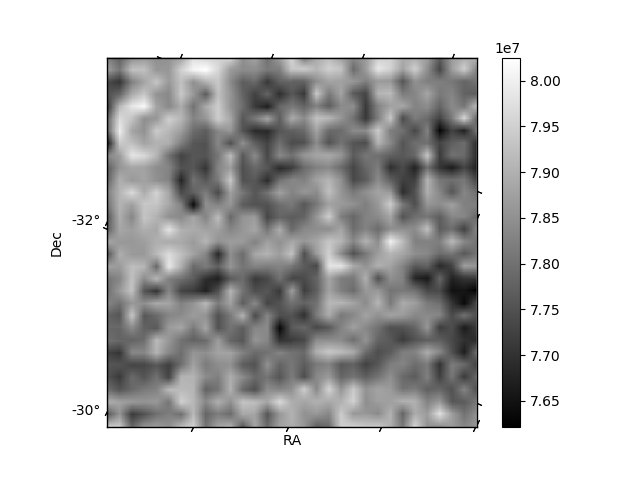
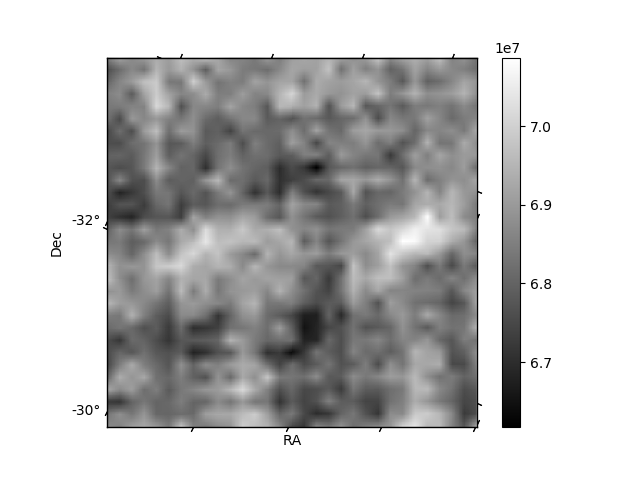
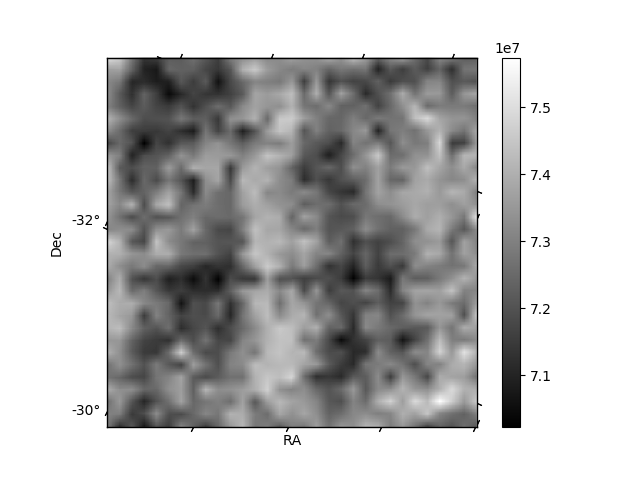
Histogram calculated using DETX and DETY for each event in the final _common_clean file
| Quadrant A | 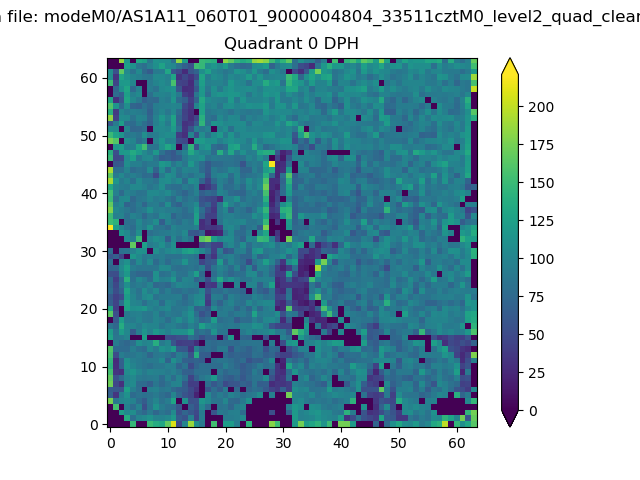 |
 |
Quadrant B |
|---|---|---|---|
| Quadrant D | 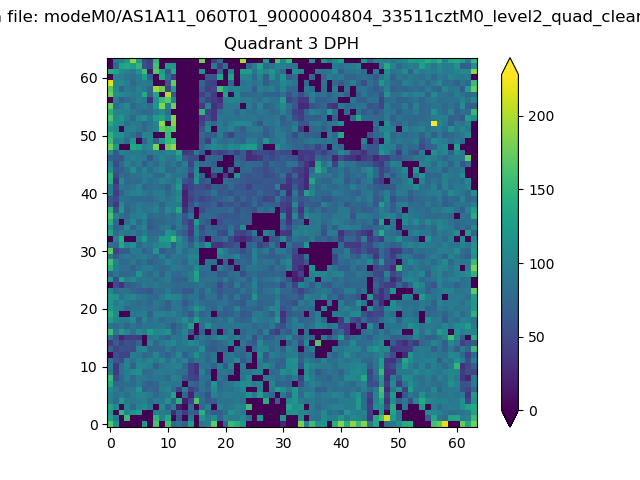 |
 |
Quadrant C |
| Plot type | Count rate plots | Images |
|---|---|---|
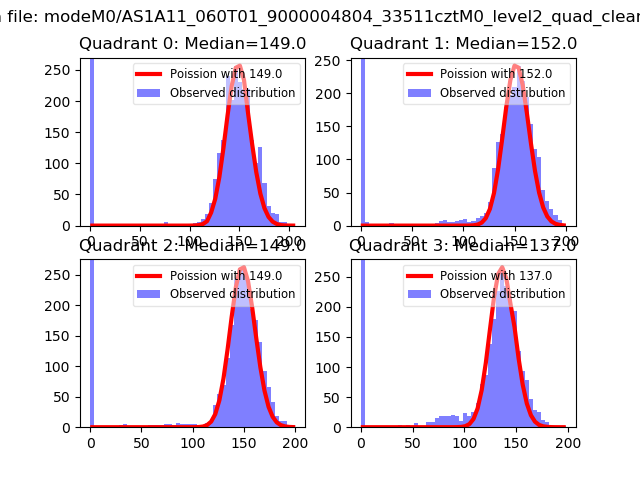
| Comparison with Poisson distribution Blue bars denote a histogram of data divided into 1 sec bins. Red curve is a Poisson curve with rate = median count rate of data. |
 |
 |
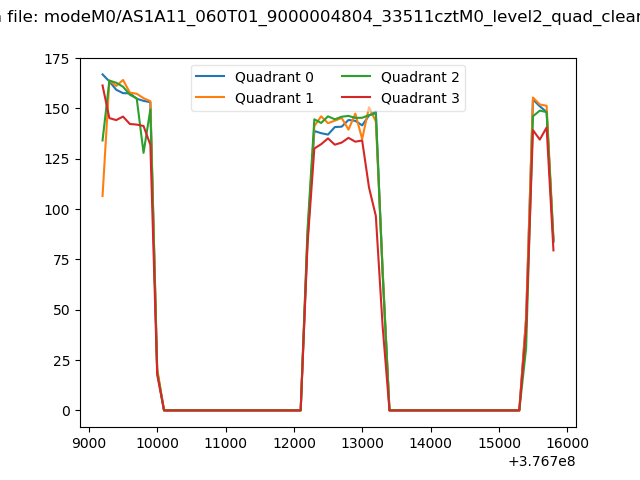
| Quadrant-wise count rates Data is divided into 100 sec bins |
 |
|
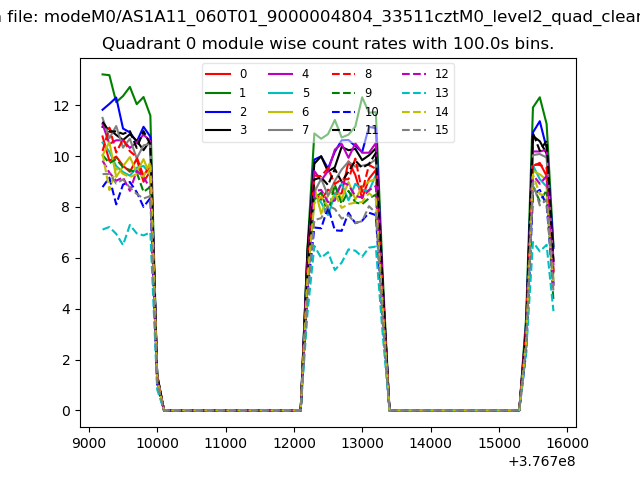
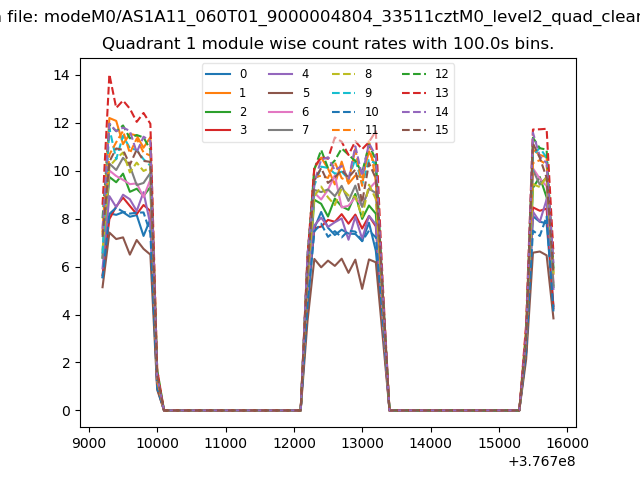
| Module-wise count rates for Quadrant A Data is divided into 100 sec bins |
 |
 |
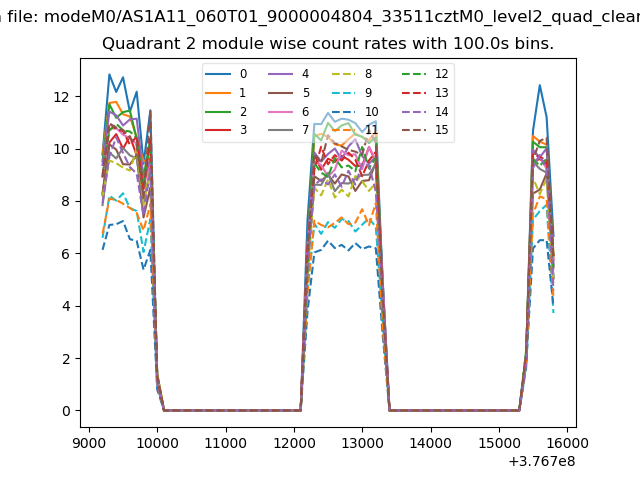
| Module-wise count rates for Quadrant B Data is divided into 100 sec bins |
 |
 |
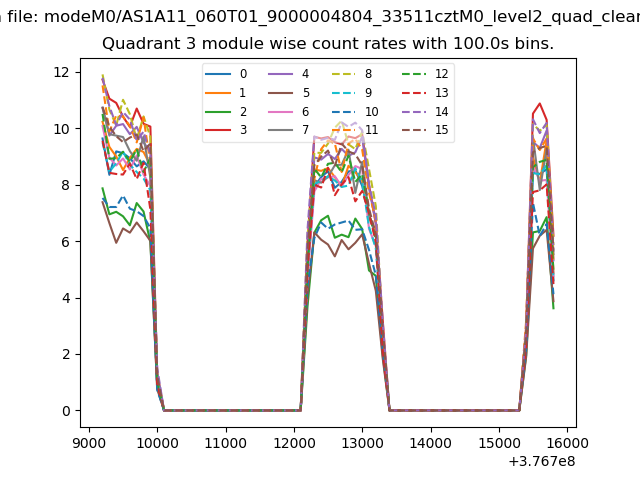
| Module-wise count rates for Quadrant C Data is divided into 100 sec bins |
 |
 |
| Module-wise count rates for Quadrant D Data is divided into 100 sec bins |
 |
 |
| Parameter | Plot |
|---|---|
| CZT HV Monitor | 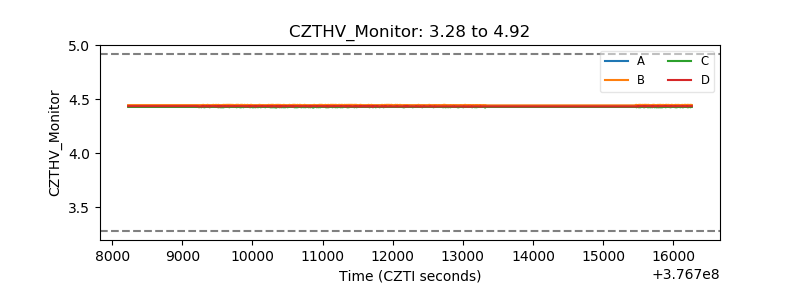 |
| D_VDD | 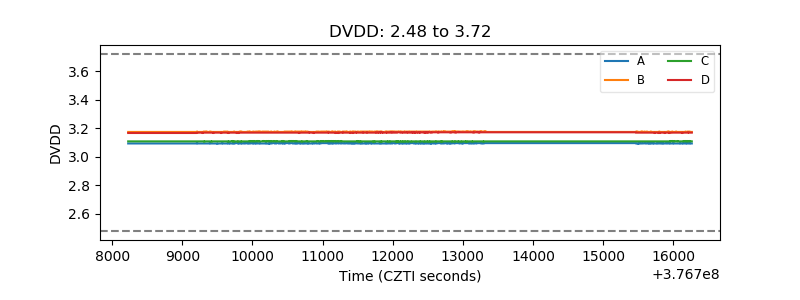 |
| Temperature 1 | 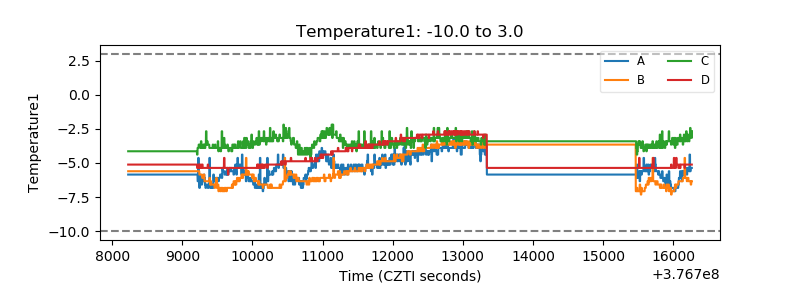 |
| Veto HV Monitor |  |
| Veto LLD | 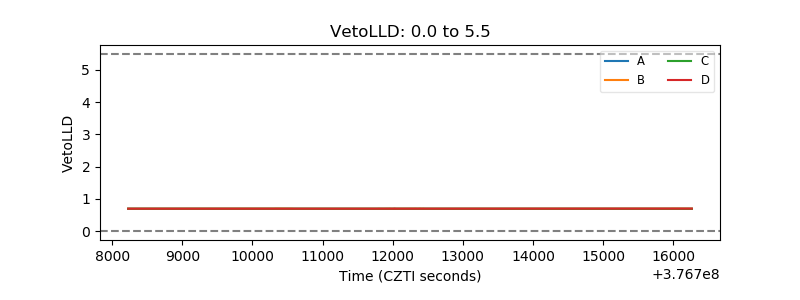 |
| Alpha Counter | 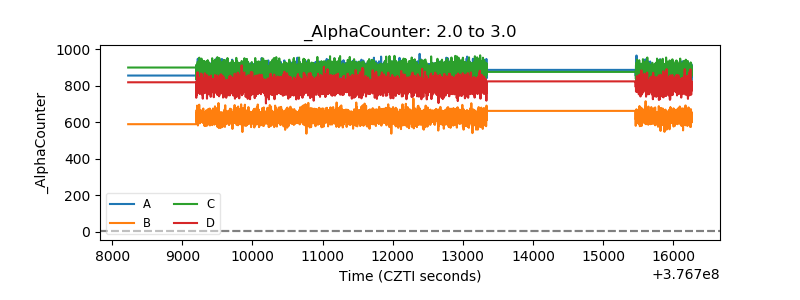 |
| _CPM_Rate | 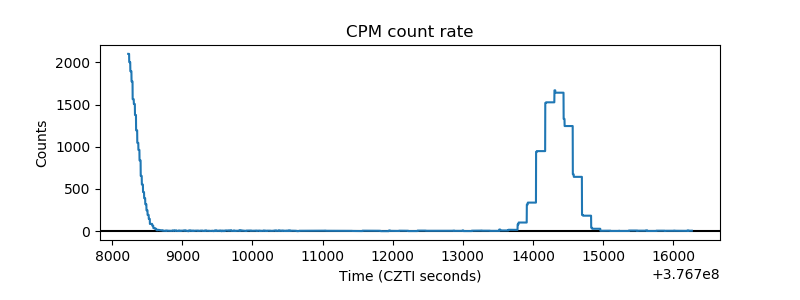 |
| CZT Counter | 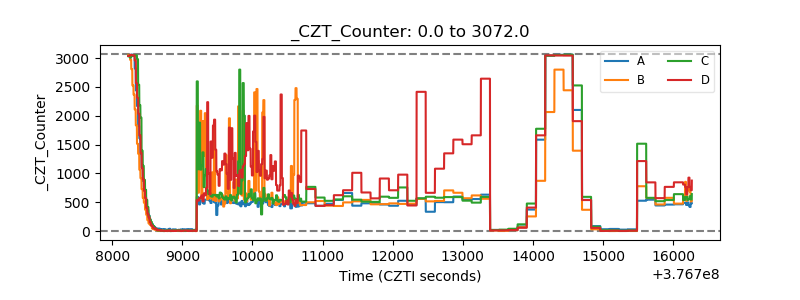 |
| +2.5 Volts monitor |  |
| +5 Volts monitor |  |
| _ROLL_ROT | 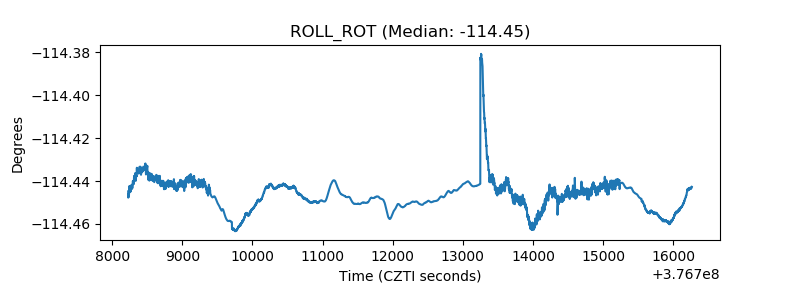 |
| _Roll_DEC | 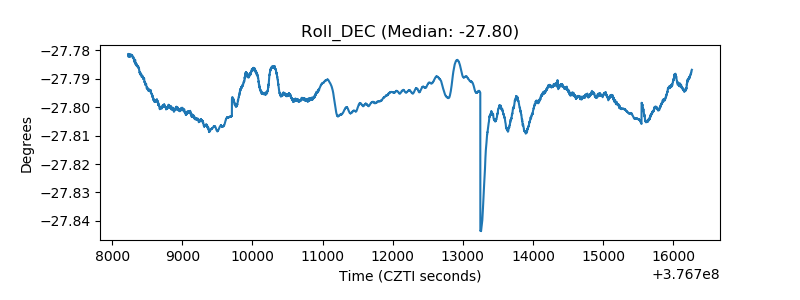 |
| _Roll_RA | 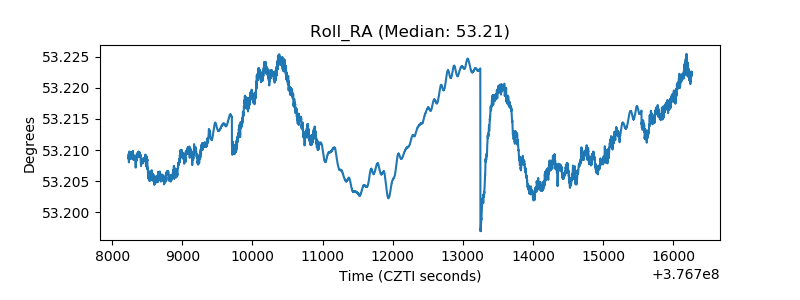 |
| Veto Counter | 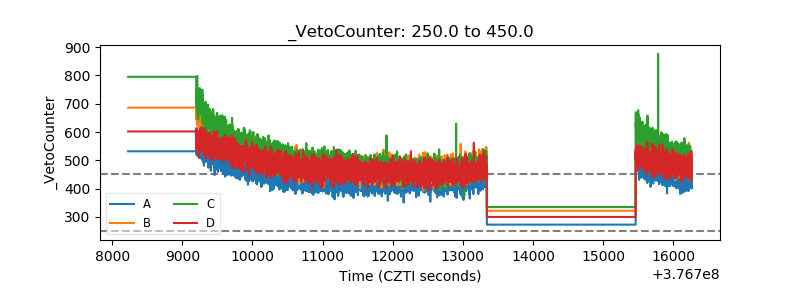 |