| Param | Original file | Final file |
|---|---|---|
| Filename | modeM0/AS1A11_060T01_9000004804_33512cztM0_level2.evt | modeM0/AS1A11_060T01_9000004804_33512cztM0_level2_quad_clean.evt |
| Size (bytes) | 454,841,280 | 49,504,320 |
| Size | 433.8 MB | 47.2 MB |
| Events in quadrant A | 2,402,476 | 294,493 |
| Events in quadrant B | 3,623,059 | 294,823 |
| Events in quadrant C | 3,590,636 | 287,992 |
| Events in quadrant D | 3,819,832 | 270,786 |
| Mode M9 | |||
|---|---|---|---|
| Quadrant | BADHDUFLAG | Total packets | Discarded packets |
| A | 0 | 42 | 0 |
| B | 0 | 42 | 0 |
| C | 0 | 42 | 0 |
| D | 0 | 42 | 0 |
| Mode M0 | |||
|---|---|---|---|
| Quadrant | BADHDUFLAG | Total packets | Discarded packets |
| A | 0 | 10066 | 3 |
| B | 0 | 13934 | 2 |
| C | 0 | 13718 | 2 |
| D | 0 | 14566 | 2 |
| Mode SS | |||
|---|---|---|---|
| Quadrant | BADHDUFLAG | Total packets | Discarded packets |
| A | 0 | 104 | 0 |
| B | 0 | 104 | 0 |
| C | 0 | 104 | 0 |
| D | 0 | 104 | 0 |
| Quadrant | Total seconds | Saturated seconds | Saturation percentage |
|---|---|---|---|
| A | 4996 | 10 | 0.200160% |
| B | 4996 | 268 | 5.364291% |
| C | 4996 | 180 | 3.602882% |
| D | 4996 | 235 | 4.703763% |
Noise dominated data is calculated using 1-second bins in cleaned event files. If a bin has >2000 counts, and if more than 50% of those come from <1% of pixels, then it is considered to be noise-dominated and hence unusable.
| Quadrant | # 1 sec bins | Bins with >0 counts | Bins with >2000 counts | High rate bins dominated by noise | Noise dominated (total time) | Noise dominated (detector-on time) | Marked lightcurve |
|---|---|---|---|---|---|---|---|
| A | 9213 | 4998 | 0 | 0 | 0.00% | 0.00% | 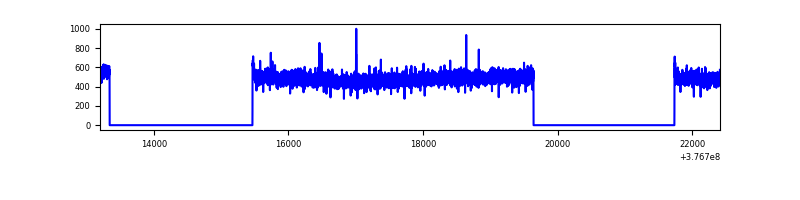 |
| B | 9213 | 4998 | 181 | 181 | 1.96% | 3.62% | 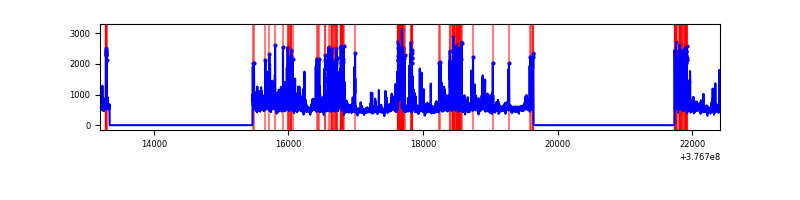 |
| C | 9213 | 4998 | 166 | 166 | 1.80% | 3.32% | 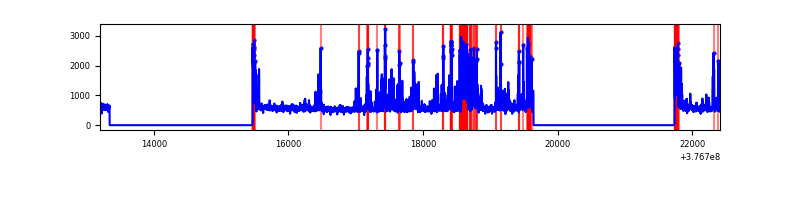 |
| D | 9213 | 4997 | 214 | 214 | 2.32% | 4.28% | 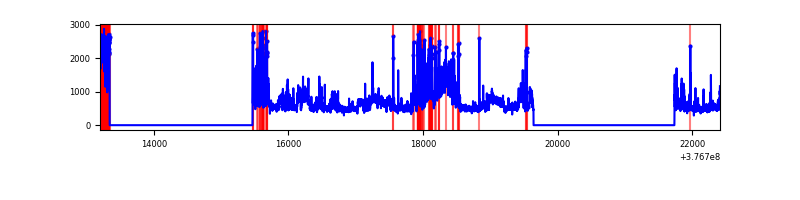 |
Top three noisy pixels from each quadrant. If the there are fewer than three noisy pixels in the level2.evt file, extra rows are filled as -1
| Pixel properties | Quadrant properties | ||||||
|---|---|---|---|---|---|---|---|
| Quadrant | DetID | PixID | Counts | Sigma | Mean | Median | Sigma |
| A | 13 | 254 | 7905 | 58.58 | 619 | 607 | 124.6 |
| A | 13 | 6 | 7359 | 54.2 | 619 | 607 | 124.6 |
| A | 3 | 137 | 6165 | 44.61 | 619 | 607 | 124.6 |
| B | 5 | 255 | 966207 | 8308.64 | 611 | 595 | 116.2 |
| B | 5 | 172 | 226643 | 1945.04 | 611 | 595 | 116.2 |
| B | 15 | 222 | 22582 | 189.19 | 611 | 595 | 116.2 |
| C | 9 | 236 | 661343 | 4742.3 | 604 | 612 | 139.3 |
| C | 15 | 214 | 230177 | 1647.67 | 604 | 612 | 139.3 |
| C | 0 | 10 | 192276 | 1375.64 | 604 | 612 | 139.3 |
| D | 2 | 120 | 590832 | 4039.75 | 599 | 583 | 146.1 |
| D | 8 | 195 | 510197 | 3487.87 | 599 | 583 | 146.1 |
| D | 12 | 6 | 155915 | 1063.12 | 599 | 583 | 146.1 |
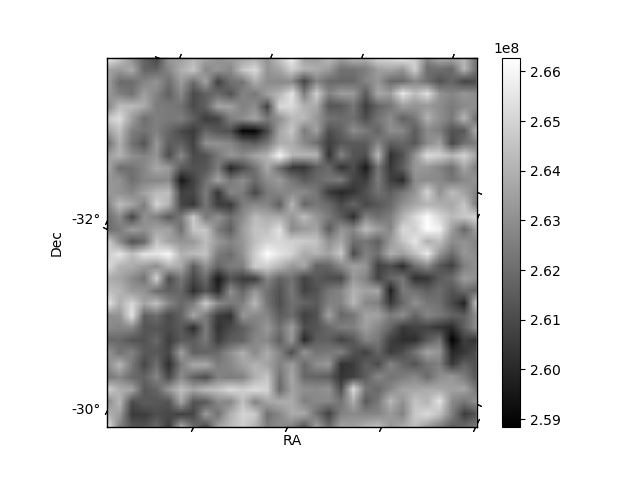
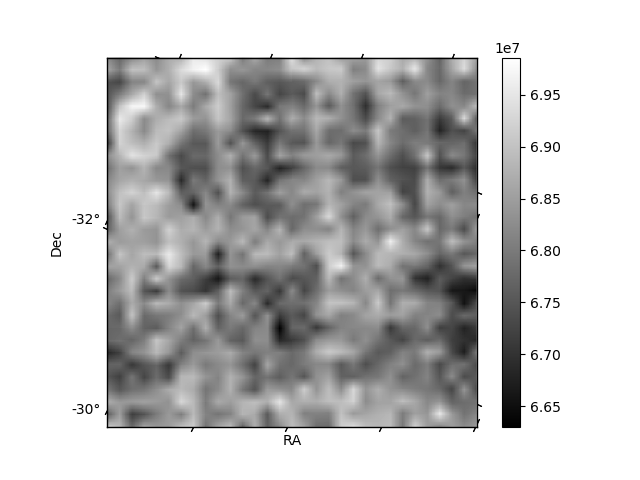
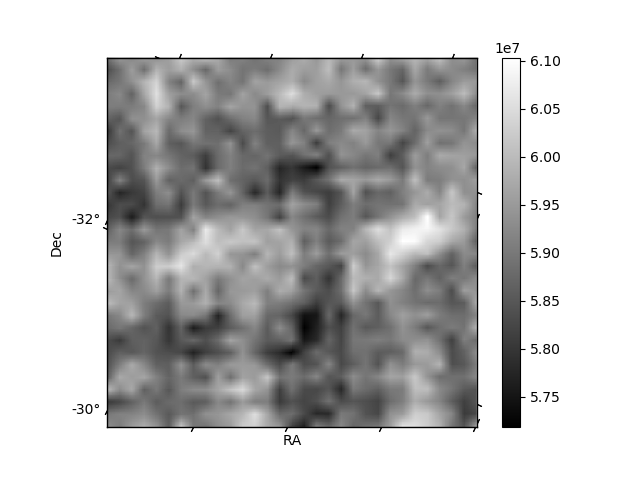
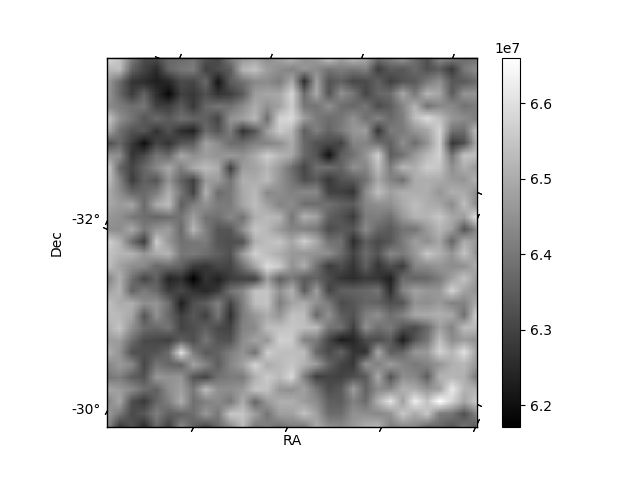
Histogram calculated using DETX and DETY for each event in the final _common_clean file
| Quadrant A | 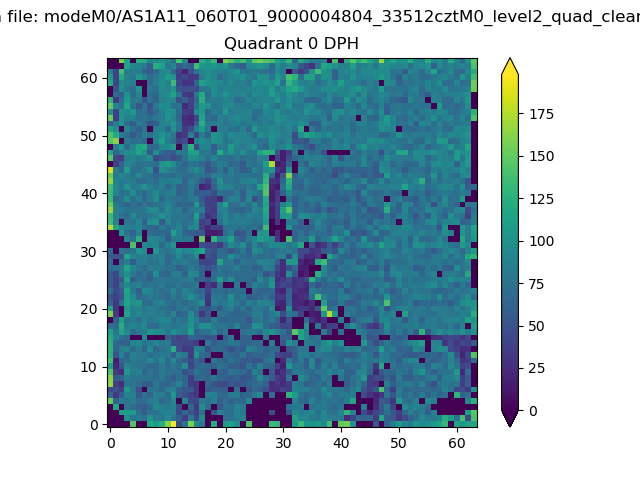 |
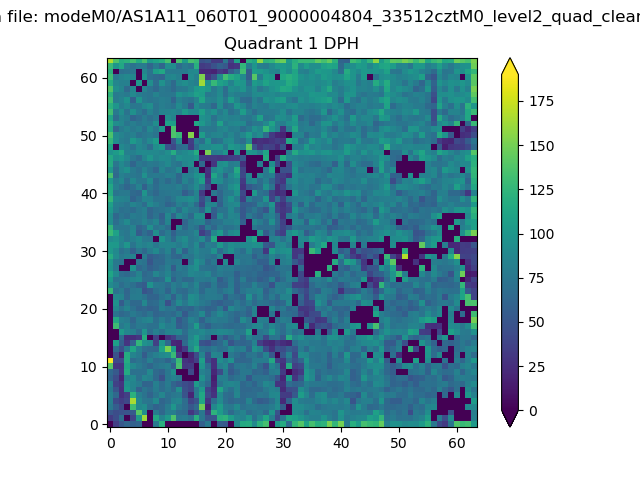 |
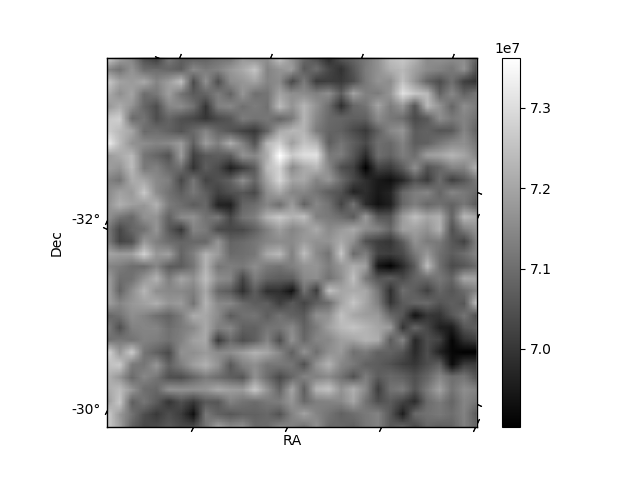
Quadrant B |
|---|---|---|---|
| Quadrant D | 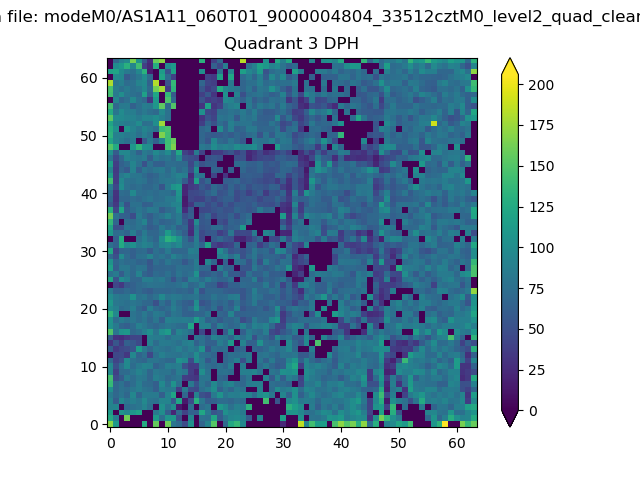 |
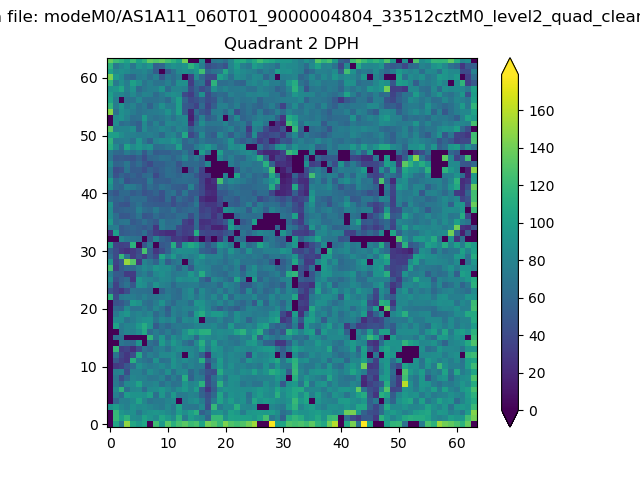 |
Quadrant C |
| Plot type | Count rate plots | Images |
|---|---|---|
| Comparison with Poisson distribution Blue bars denote a histogram of data divided into 1 sec bins. Red curve is a Poisson curve with rate = median count rate of data. |
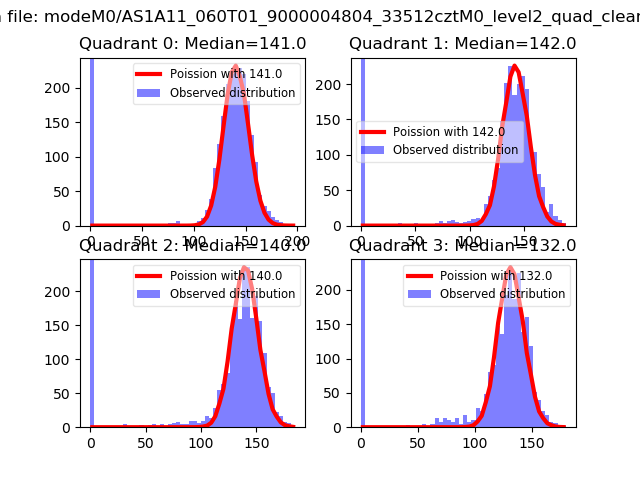 |
 |
| Quadrant-wise count rates Data is divided into 100 sec bins |
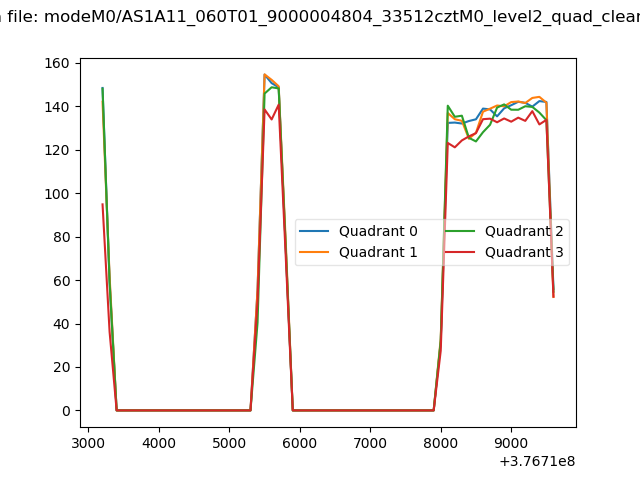 |
|
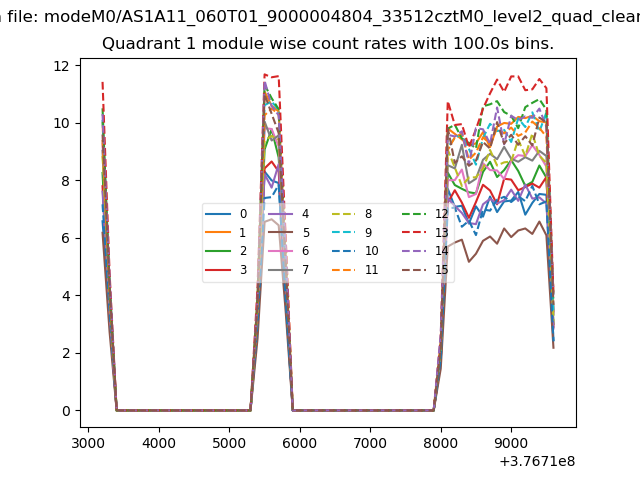
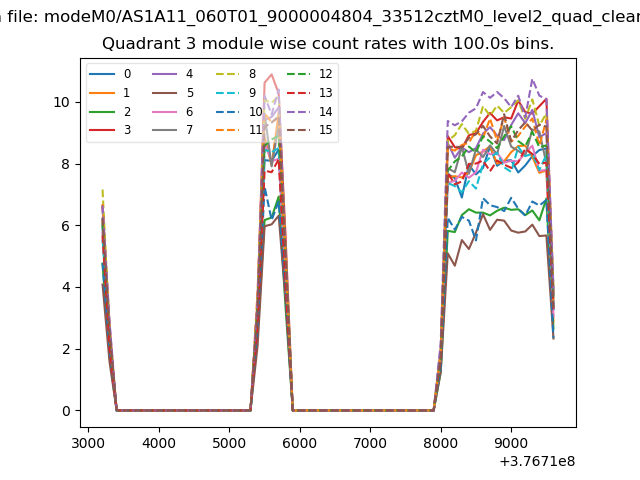
| Module-wise count rates for Quadrant A Data is divided into 100 sec bins |
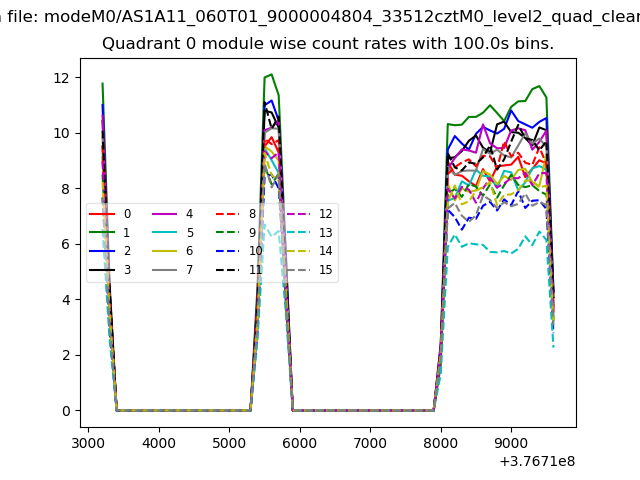 |
 |
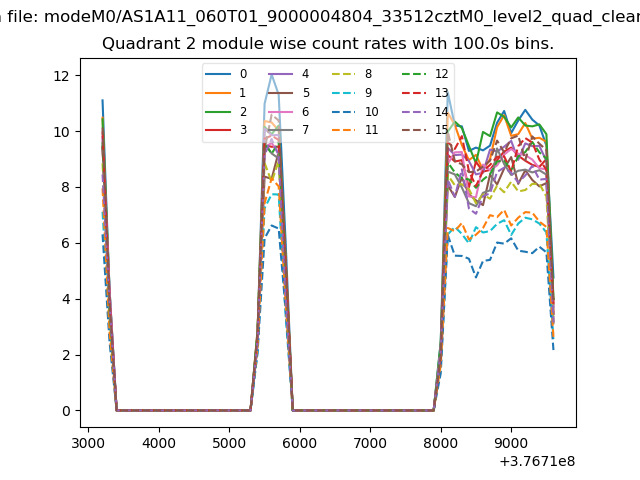
| Module-wise count rates for Quadrant B Data is divided into 100 sec bins |
 |
 |
| Module-wise count rates for Quadrant C Data is divided into 100 sec bins |
 |
 |
| Module-wise count rates for Quadrant D Data is divided into 100 sec bins |
 |
 |
| Parameter | Plot |
|---|---|
| CZT HV Monitor | 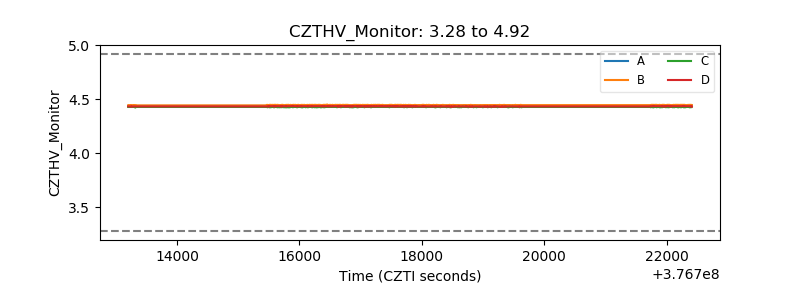 |
| D_VDD | 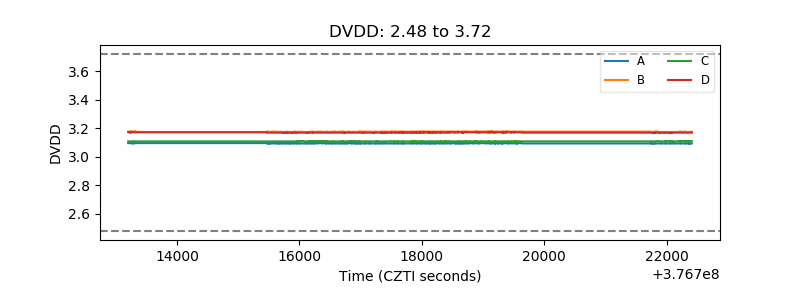 |
| Temperature 1 | 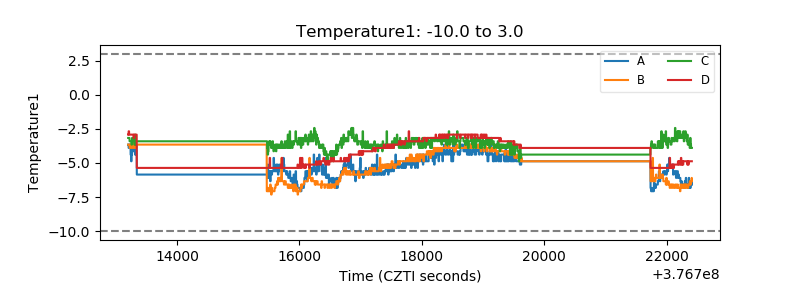 |
| Veto HV Monitor | 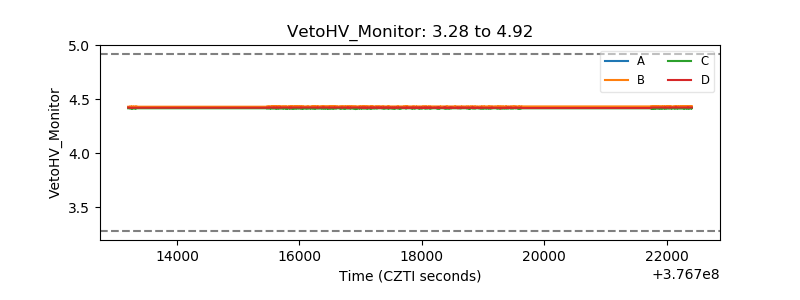 |
| Veto LLD | 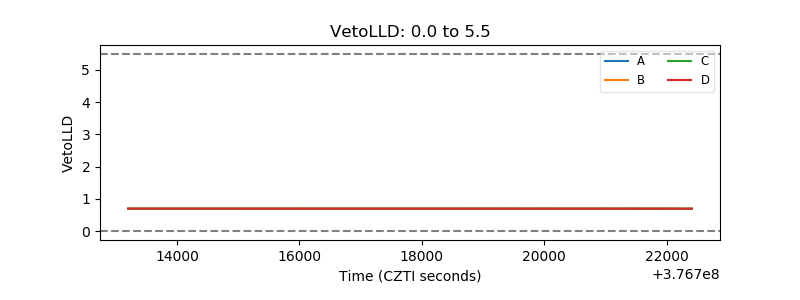 |
| Alpha Counter | 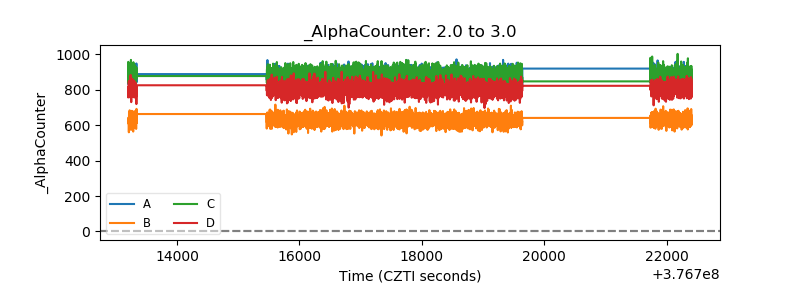 |
| _CPM_Rate | 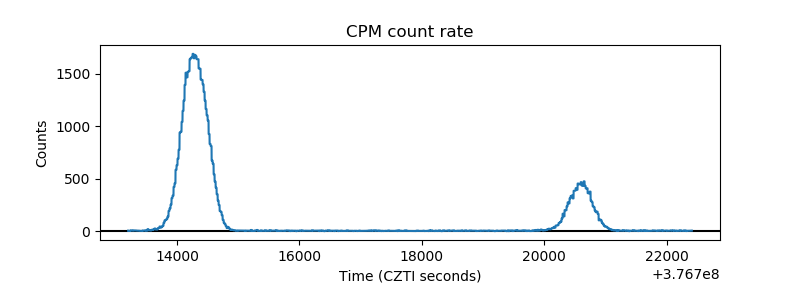 |
| CZT Counter | 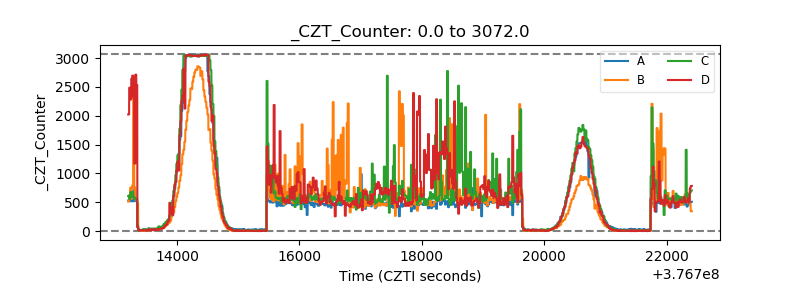 |
| +2.5 Volts monitor | 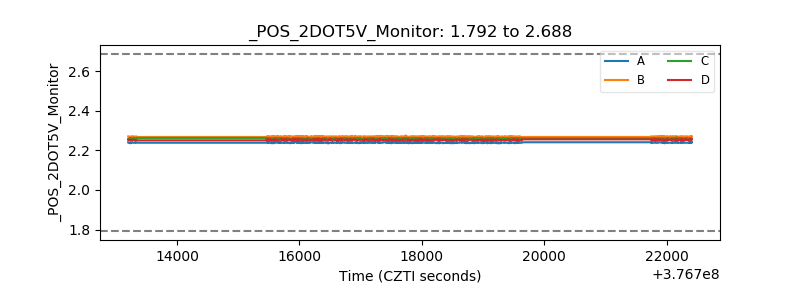 |
| +5 Volts monitor |  |
| _ROLL_ROT | 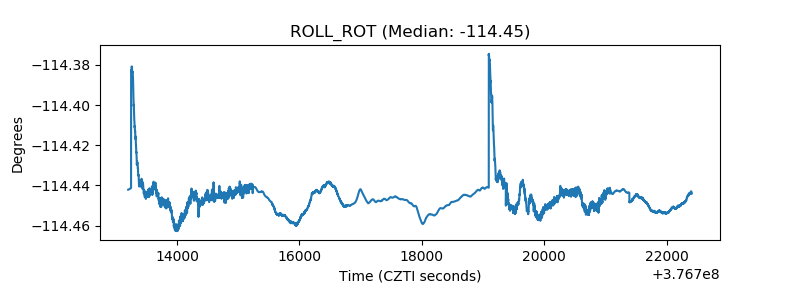 |
| _Roll_DEC | 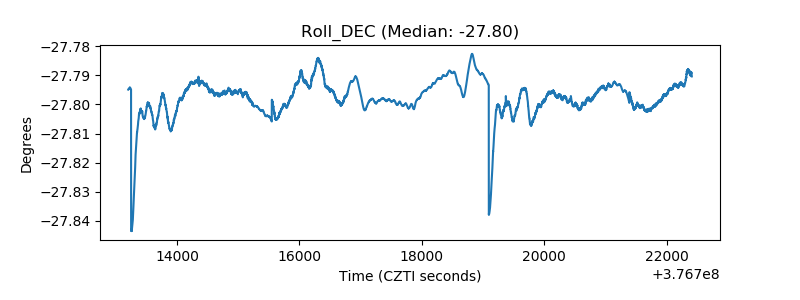 |
| _Roll_RA | 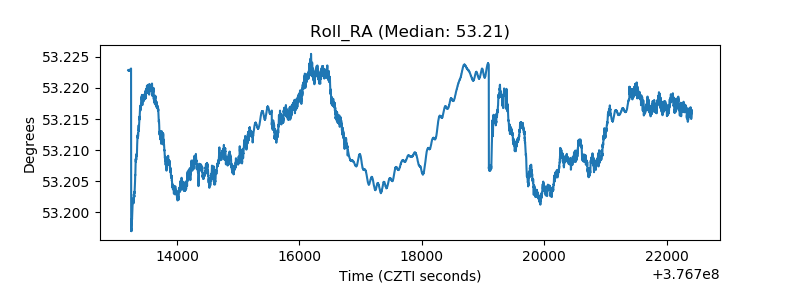 |
| Veto Counter | 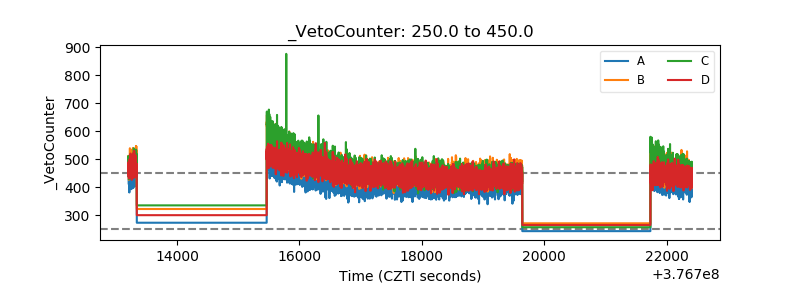 |