| Param | Original file | Final file |
|---|---|---|
| Filename | modeM0/AS1A11_060T01_9000004804_33513cztM0_level2.evt | modeM0/AS1A11_060T01_9000004804_33513cztM0_level2_quad_clean.evt |
| Size (bytes) | 501,310,080 | 49,276,800 |
| Size | 478.1 MB | 47.0 MB |
| Events in quadrant A | 2,412,018 | 295,979 |
| Events in quadrant B | 4,699,270 | 258,130 |
| Events in quadrant C | 3,426,384 | 296,100 |
| Events in quadrant D | 4,292,469 | 277,229 |
| Mode M9 | |||
|---|---|---|---|
| Quadrant | BADHDUFLAG | Total packets | Discarded packets |
| A | 0 | 30 | 0 |
| B | 0 | 30 | 0 |
| C | 0 | 30 | 0 |
| D | 0 | 31 | 0 |
| Mode M0 | |||
|---|---|---|---|
| Quadrant | BADHDUFLAG | Total packets | Discarded packets |
| A | 0 | 10428 | 3 |
| B | 0 | 17403 | 2 |
| C | 0 | 13199 | 2 |
| D | 0 | 16299 | 2 |
| Mode SS | |||
|---|---|---|---|
| Quadrant | BADHDUFLAG | Total packets | Discarded packets |
| A | 0 | 106 | 0 |
| B | 0 | 106 | 0 |
| C | 0 | 106 | 0 |
| D | 0 | 106 | 0 |
| Quadrant | Total seconds | Saturated seconds | Saturation percentage |
|---|---|---|---|
| A | 5195 | 6 | 0.115496% |
| B | 5195 | 734 | 14.128970% |
| C | 5195 | 204 | 3.926853% |
| D | 5195 | 145 | 2.791145% |
Noise dominated data is calculated using 1-second bins in cleaned event files. If a bin has >2000 counts, and if more than 50% of those come from <1% of pixels, then it is considered to be noise-dominated and hence unusable.
| Quadrant | # 1 sec bins | Bins with >0 counts | Bins with >2000 counts | High rate bins dominated by noise | Noise dominated (total time) | Noise dominated (detector-on time) | Marked lightcurve |
|---|---|---|---|---|---|---|---|
| A | 7048 | 5196 | 0 | 0 | 0.00% | 0.00% | 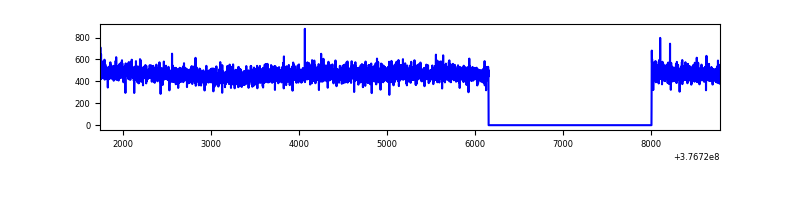 |
| B | 7048 | 5196 | 581 | 581 | 8.24% | 11.18% | 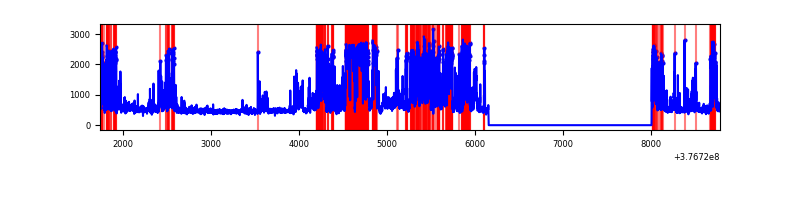 |
| C | 7048 | 5196 | 163 | 163 | 2.31% | 3.14% | 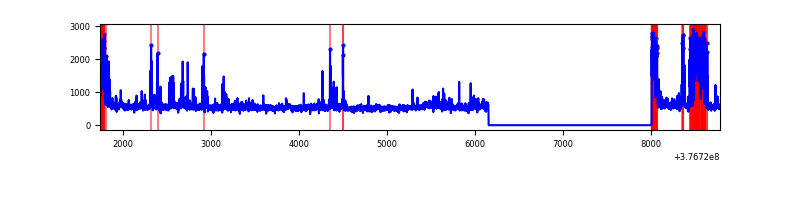 |
| D | 7048 | 5196 | 127 | 127 | 1.80% | 2.44% | 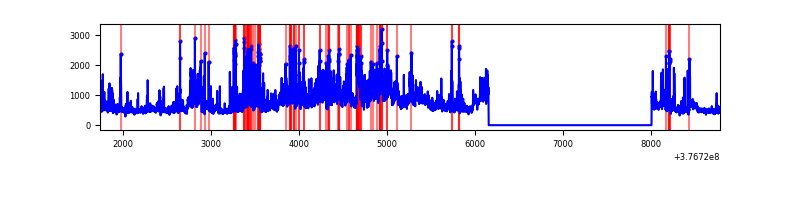 |
Top three noisy pixels from each quadrant. If the there are fewer than three noisy pixels in the level2.evt file, extra rows are filled as -1
| Pixel properties | Quadrant properties | ||||||
|---|---|---|---|---|---|---|---|
| Quadrant | DetID | PixID | Counts | Sigma | Mean | Median | Sigma |
| A | 13 | 6 | 9517 | 71.75 | 621 | 608 | 124.2 |
| A | 13 | 254 | 8736 | 65.46 | 621 | 608 | 124.2 |
| A | 3 | 137 | 6212 | 45.13 | 621 | 608 | 124.2 |
| B | 5 | 172 | 1643111 | 14556.02 | 586 | 570 | 112.8 |
| B | 5 | 255 | 723381 | 6405.47 | 586 | 570 | 112.8 |
| B | 15 | 222 | 14878 | 126.8 | 586 | 570 | 112.8 |
| C | 0 | 10 | 264675 | 1908.3 | 599 | 604 | 138.4 |
| C | 14 | 254 | 245126 | 1767.03 | 599 | 604 | 138.4 |
| C | 15 | 214 | 238903 | 1722.06 | 599 | 604 | 138.4 |
| D | 2 | 120 | 927345 | 6225.3 | 604 | 585 | 148.9 |
| D | 8 | 195 | 473612 | 3177.45 | 604 | 585 | 148.9 |
| D | 2 | 250 | 229621 | 1538.5 | 604 | 585 | 148.9 |
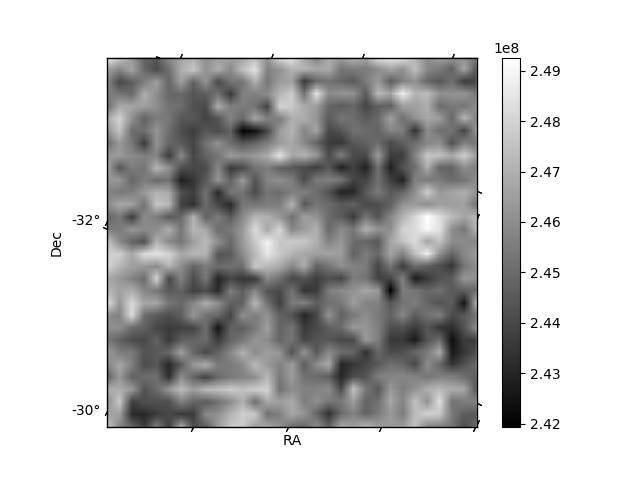
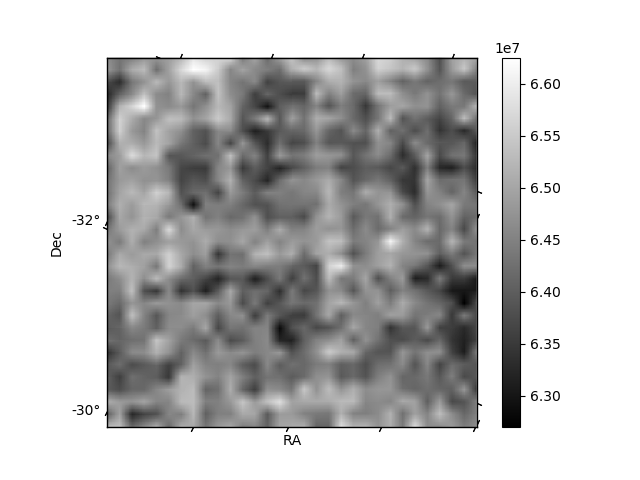
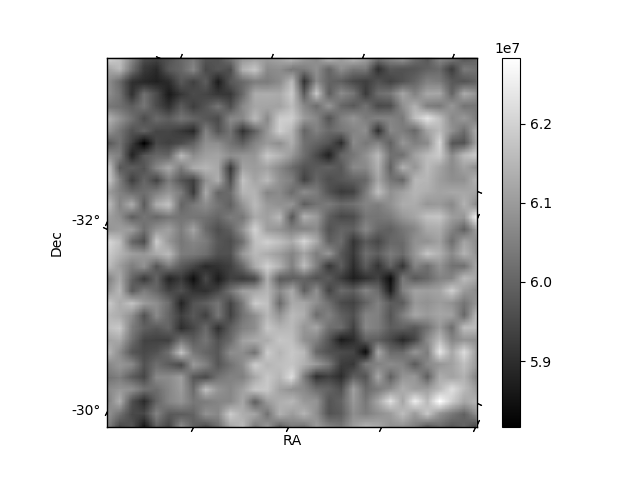
Histogram calculated using DETX and DETY for each event in the final _common_clean file
| Quadrant A | 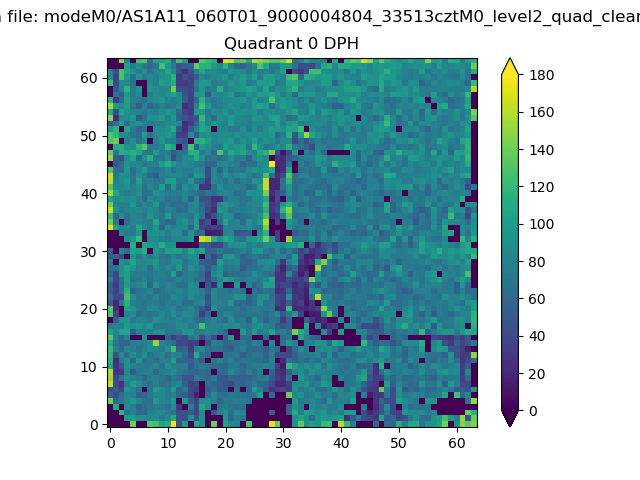 |
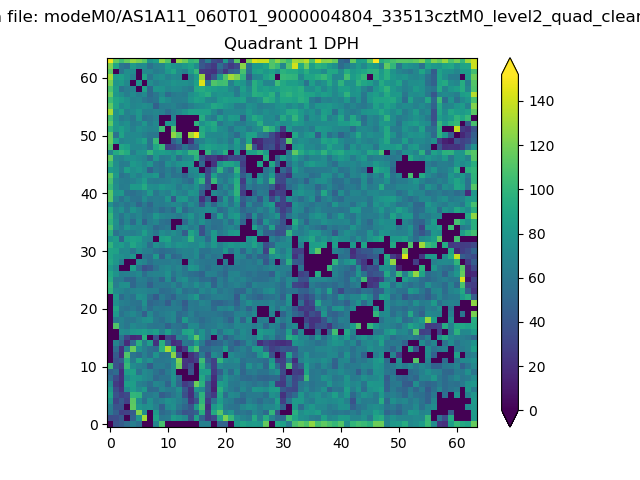 |
Quadrant B |
|---|---|---|---|
| Quadrant D | 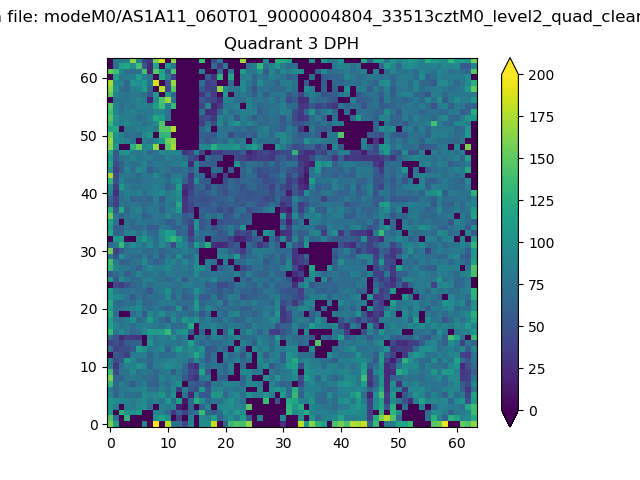 |
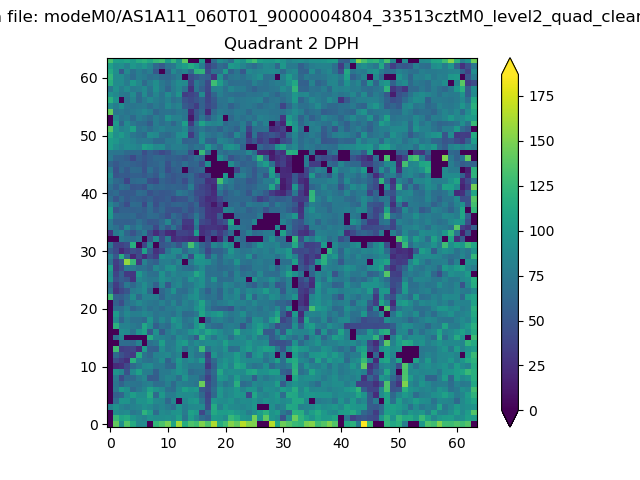 |
Quadrant C |
| Plot type | Count rate plots | Images |
|---|---|---|
| Comparison with Poisson distribution Blue bars denote a histogram of data divided into 1 sec bins. Red curve is a Poisson curve with rate = median count rate of data. |
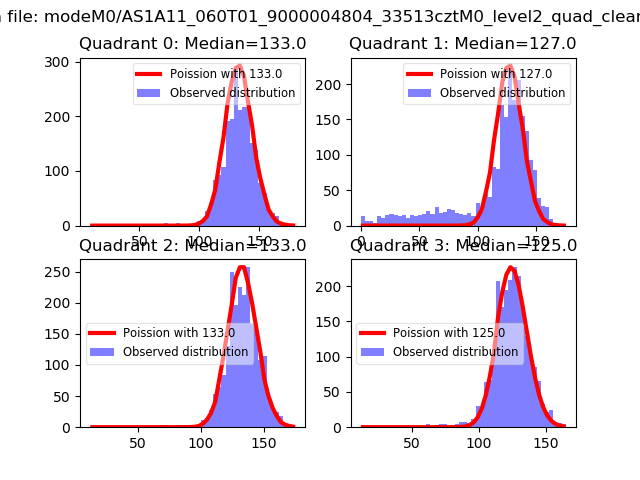 |
 |
| Quadrant-wise count rates Data is divided into 100 sec bins |
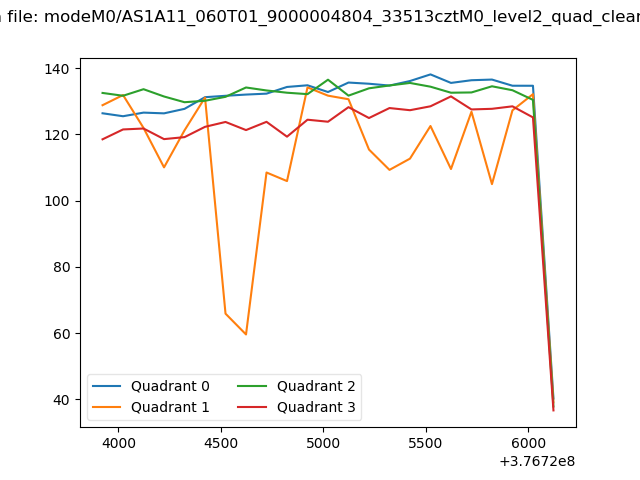 |
|
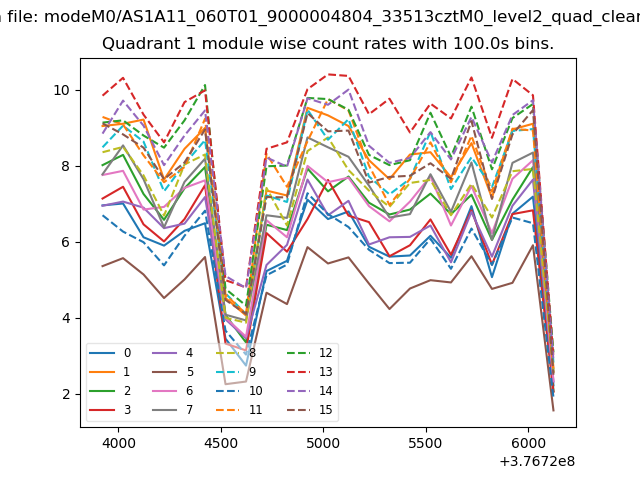
| Module-wise count rates for Quadrant A Data is divided into 100 sec bins |
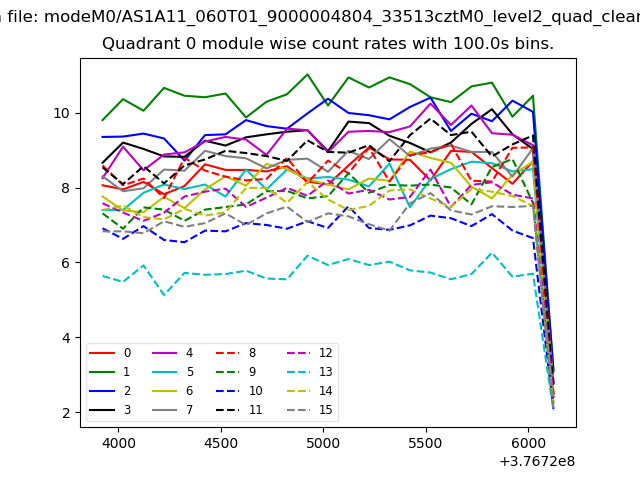 |
 |
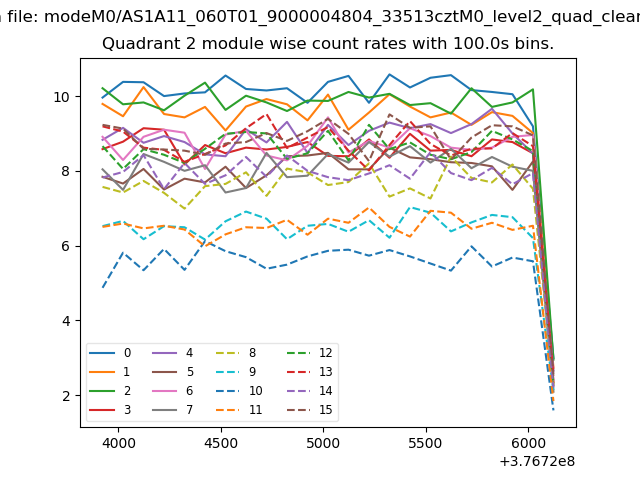
| Module-wise count rates for Quadrant B Data is divided into 100 sec bins |
 |
 |
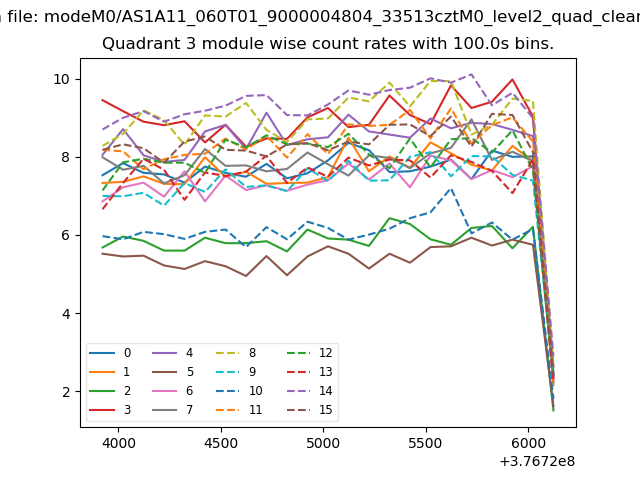
| Module-wise count rates for Quadrant C Data is divided into 100 sec bins |
 |
 |
| Module-wise count rates for Quadrant D Data is divided into 100 sec bins |
 |
 |
| Parameter | Plot |
|---|---|
| CZT HV Monitor | 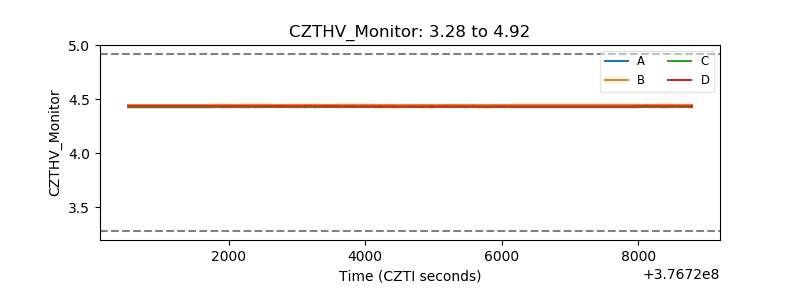 |
| D_VDD | 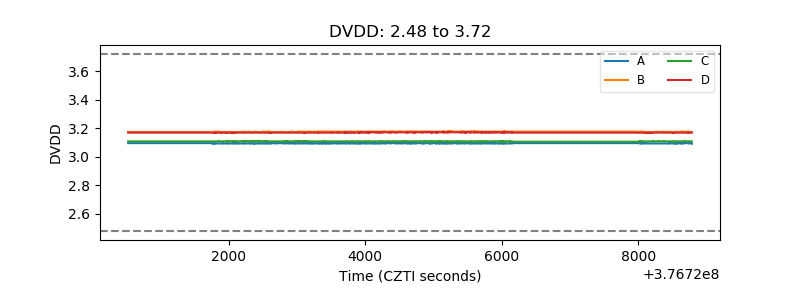 |
| Temperature 1 | 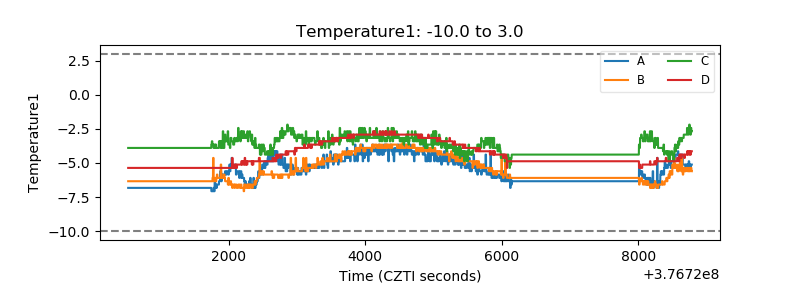 |
| Veto HV Monitor | 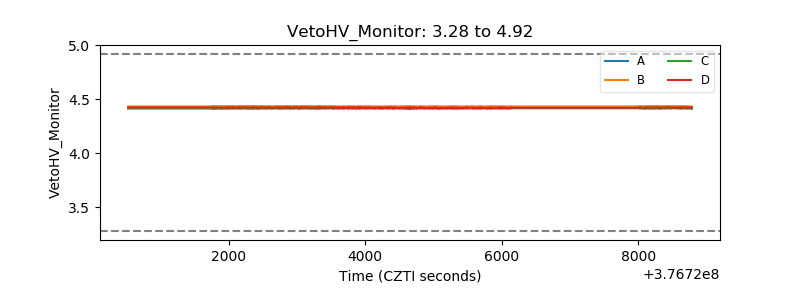 |
| Veto LLD | 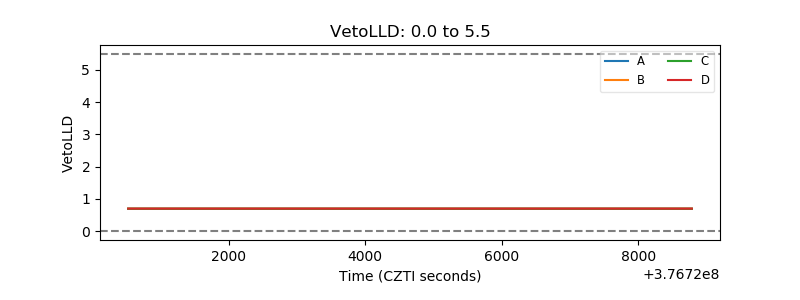 |
| Alpha Counter | 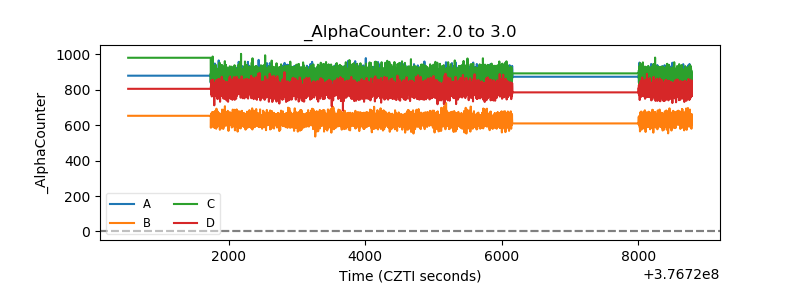 |
| _CPM_Rate | 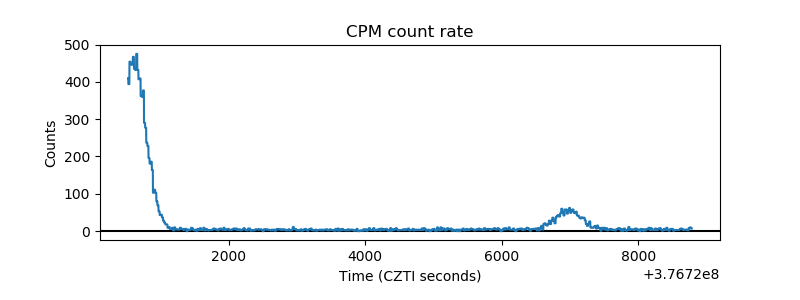 |
| CZT Counter | 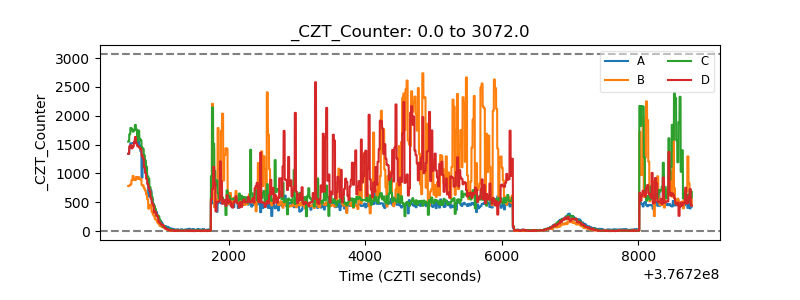 |
| +2.5 Volts monitor |  |
| +5 Volts monitor |  |
| _ROLL_ROT | 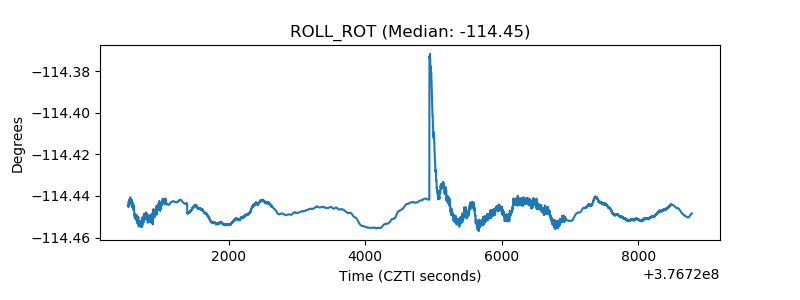 |
| _Roll_DEC | 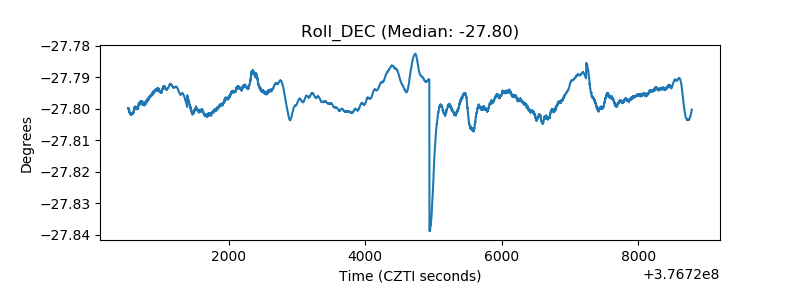 |
| _Roll_RA | 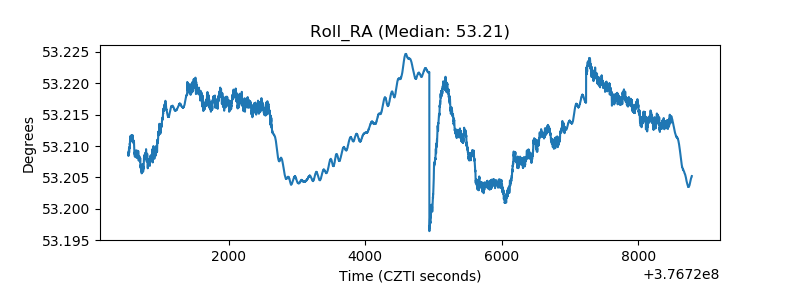 |
| Veto Counter | 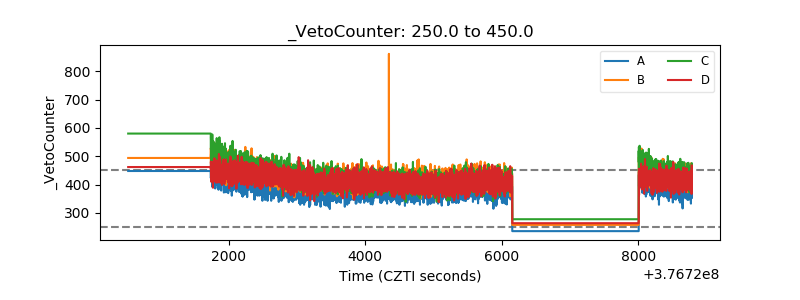 |