| Param | Original file | Final file |
|---|---|---|
| Filename | modeM0/AS1A11_060T01_9000004804_33514cztM0_level2.evt | modeM0/AS1A11_060T01_9000004804_33514cztM0_level2_quad_clean.evt |
| Size (bytes) | 563,123,520 | 71,124,480 |
| Size | 537.0 MB | 67.8 MB |
| Events in quadrant A | 2,756,650 | 445,755 |
| Events in quadrant B | 4,602,580 | 430,496 |
| Events in quadrant C | 4,396,404 | 433,061 |
| Events in quadrant D | 4,888,385 | 421,167 |
| Mode M9 | |||
|---|---|---|---|
| Quadrant | BADHDUFLAG | Total packets | Discarded packets |
| A | 0 | 33 | 0 |
| B | 0 | 33 | 0 |
| C | 0 | 33 | 0 |
| D | 0 | 33 | 0 |
| Mode M0 | |||
|---|---|---|---|
| Quadrant | BADHDUFLAG | Total packets | Discarded packets |
| A | 0 | 12138 | 3 |
| B | 0 | 17538 | 2 |
| C | 0 | 16686 | 2 |
| D | 0 | 18762 | 2 |
| Mode SS | |||
|---|---|---|---|
| Quadrant | BADHDUFLAG | Total packets | Discarded packets |
| A | 0 | 128 | 0 |
| B | 0 | 128 | 0 |
| C | 0 | 128 | 0 |
| D | 0 | 128 | 0 |
| Quadrant | Total seconds | Saturated seconds | Saturation percentage |
|---|---|---|---|
| A | 6048 | 4 | 0.066138% |
| B | 6048 | 577 | 9.540344% |
| C | 6048 | 345 | 5.704365% |
| D | 6048 | 291 | 4.811508% |
Noise dominated data is calculated using 1-second bins in cleaned event files. If a bin has >2000 counts, and if more than 50% of those come from <1% of pixels, then it is considered to be noise-dominated and hence unusable.
| Quadrant | # 1 sec bins | Bins with >0 counts | Bins with >2000 counts | High rate bins dominated by noise | Noise dominated (total time) | Noise dominated (detector-on time) | Marked lightcurve |
|---|---|---|---|---|---|---|---|
| A | 9423 | 6050 | 0 | 0 | 0.00% | 0.00% | 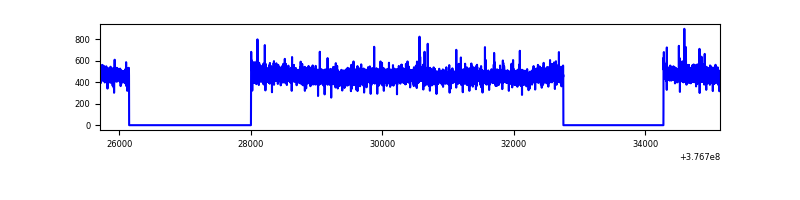 |
| B | 9423 | 6050 | 433 | 433 | 4.60% | 7.16% | 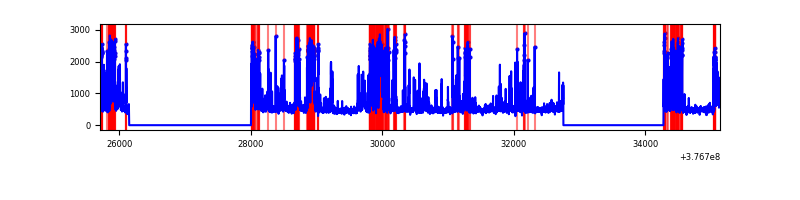 |
| C | 9423 | 6050 | 286 | 286 | 3.04% | 4.73% | 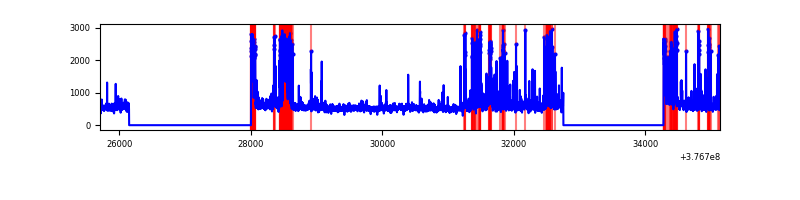 |
| D | 9423 | 6050 | 250 | 250 | 2.65% | 4.13% | 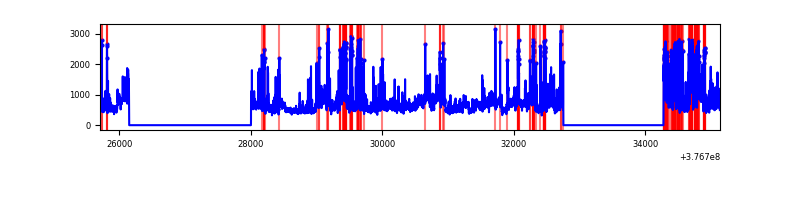 |
Top three noisy pixels from each quadrant. If the there are fewer than three noisy pixels in the level2.evt file, extra rows are filled as -1
| Pixel properties | Quadrant properties | ||||||
|---|---|---|---|---|---|---|---|
| Quadrant | DetID | PixID | Counts | Sigma | Mean | Median | Sigma |
| A | 13 | 254 | 9785 | 63.37 | 711 | 696 | 143.4 |
| A | 3 | 137 | 6957 | 43.65 | 711 | 696 | 143.4 |
| A | 10 | 83 | 6022 | 37.13 | 711 | 696 | 143.4 |
| B | 5 | 172 | 1253297 | 9532.45 | 684 | 667 | 131.4 |
| B | 5 | 255 | 435955 | 3312.52 | 684 | 667 | 131.4 |
| B | 4 | 251 | 197442 | 1497.45 | 684 | 667 | 131.4 |
| C | 14 | 254 | 760505 | 4865.29 | 676 | 684 | 156.2 |
| C | 15 | 214 | 274658 | 1754.31 | 676 | 684 | 156.2 |
| C | 0 | 10 | 261420 | 1669.55 | 676 | 684 | 156.2 |
| D | 8 | 195 | 701645 | 4238.31 | 682 | 662 | 165.4 |
| D | 2 | 120 | 582973 | 3520.79 | 682 | 662 | 165.4 |
| D | 2 | 250 | 569594 | 3439.9 | 682 | 662 | 165.4 |
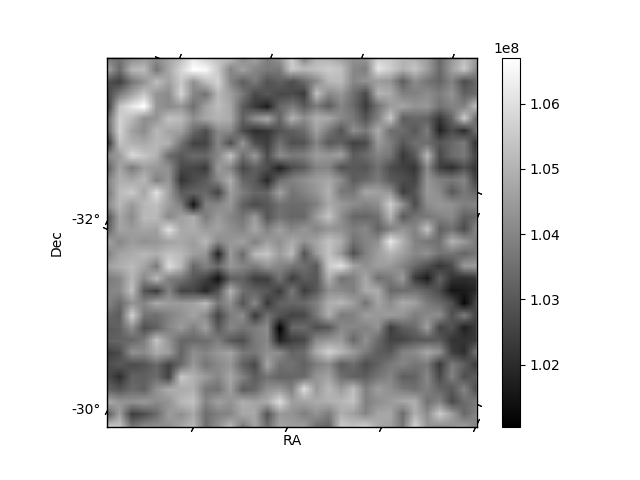
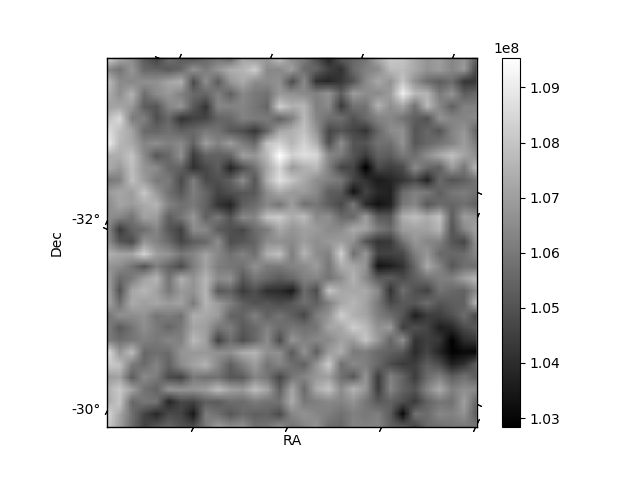
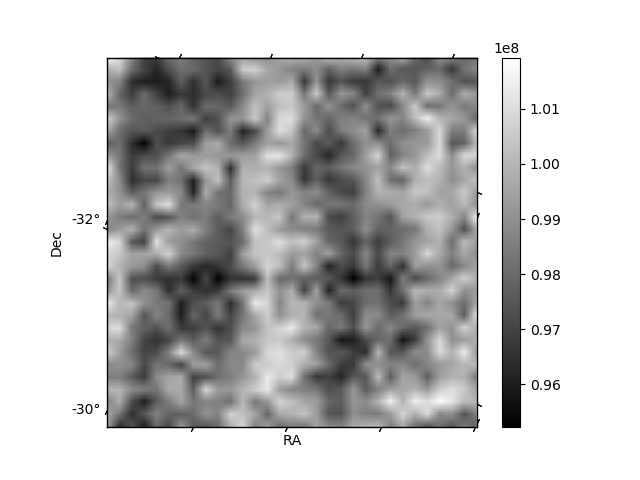
Histogram calculated using DETX and DETY for each event in the final _common_clean file
| Quadrant A | 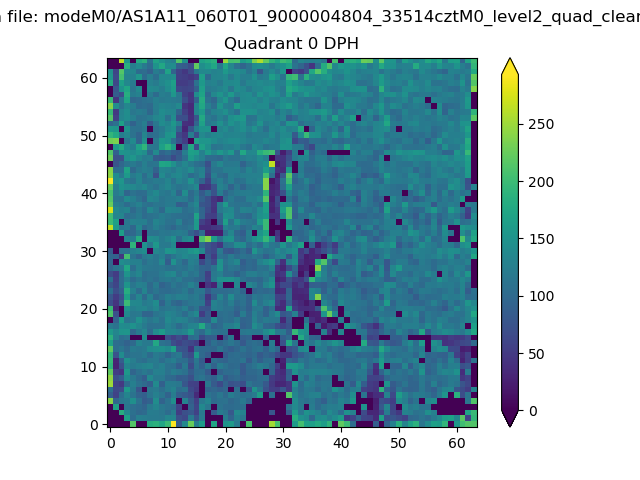 |
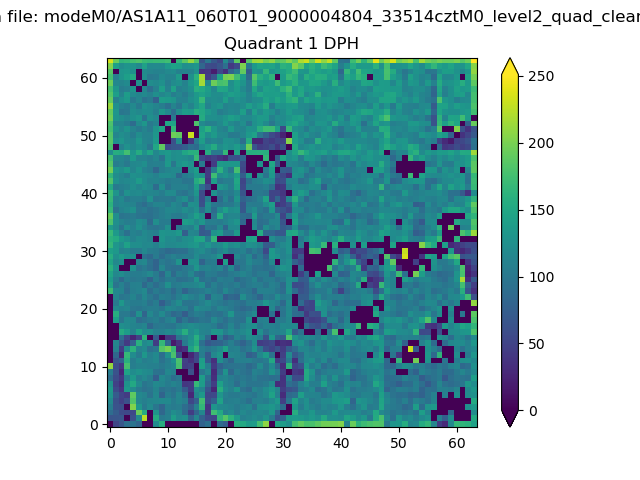 |
Quadrant B |
|---|---|---|---|
| Quadrant D | 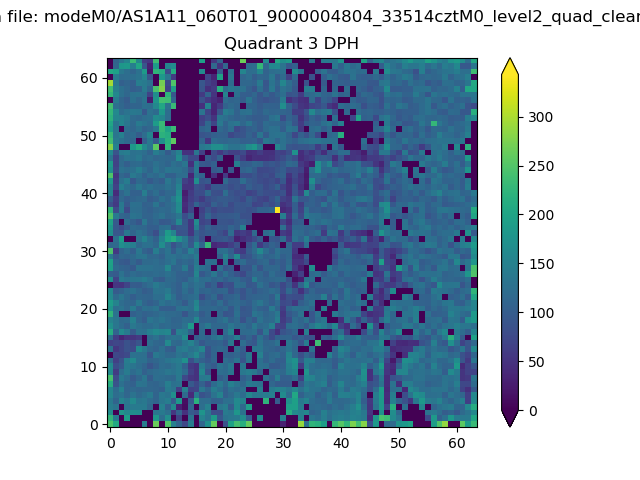 |
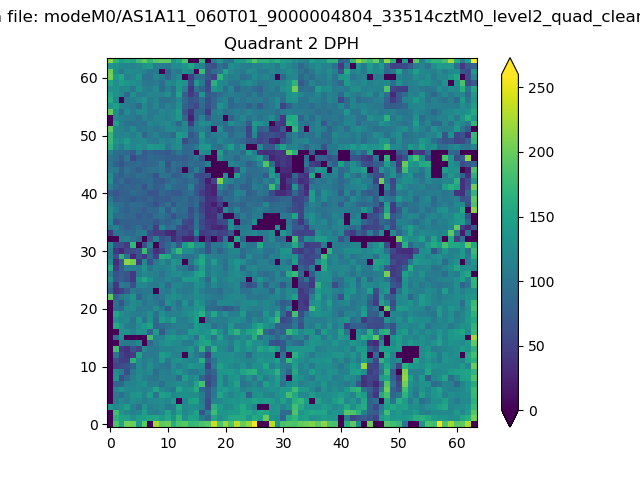 |
Quadrant C |
| Plot type | Count rate plots | Images |
|---|---|---|
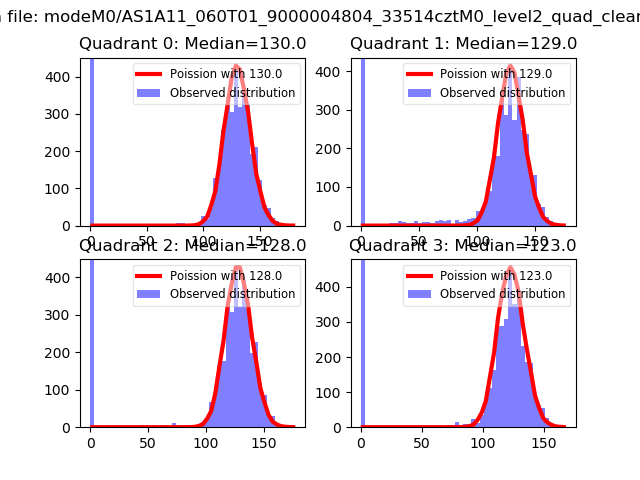
| Comparison with Poisson distribution Blue bars denote a histogram of data divided into 1 sec bins. Red curve is a Poisson curve with rate = median count rate of data. |
 |
 |
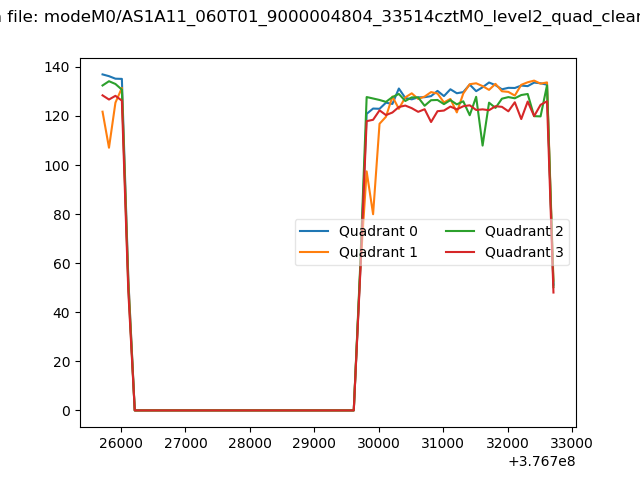
| Quadrant-wise count rates Data is divided into 100 sec bins |
 |
|
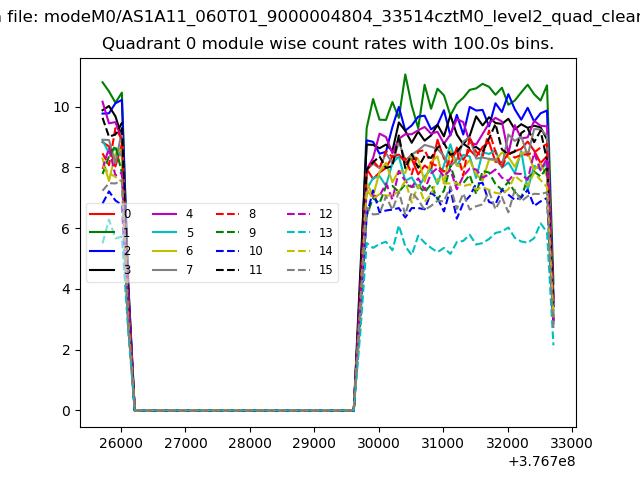
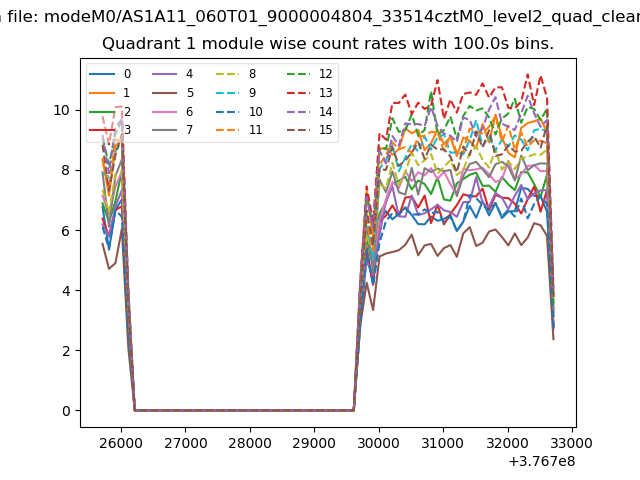
| Module-wise count rates for Quadrant A Data is divided into 100 sec bins |
 |
 |
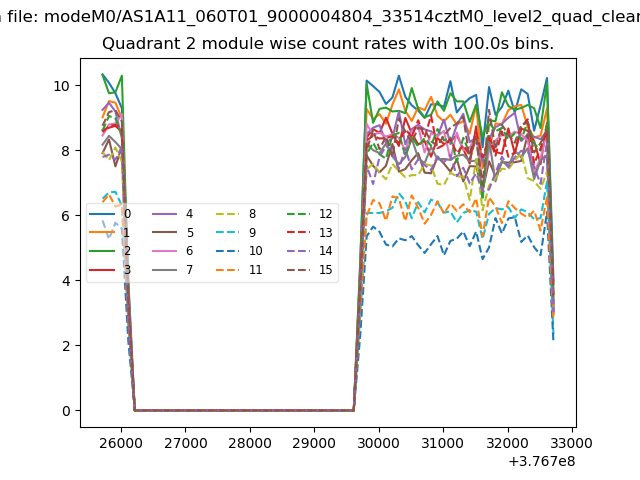
| Module-wise count rates for Quadrant B Data is divided into 100 sec bins |
 |
 |
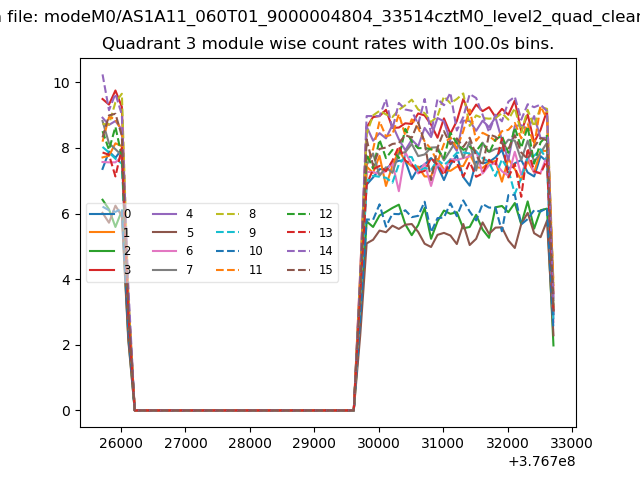
| Module-wise count rates for Quadrant C Data is divided into 100 sec bins |
 |
 |
| Module-wise count rates for Quadrant D Data is divided into 100 sec bins |
 |
 |
| Parameter | Plot |
|---|---|
| CZT HV Monitor | 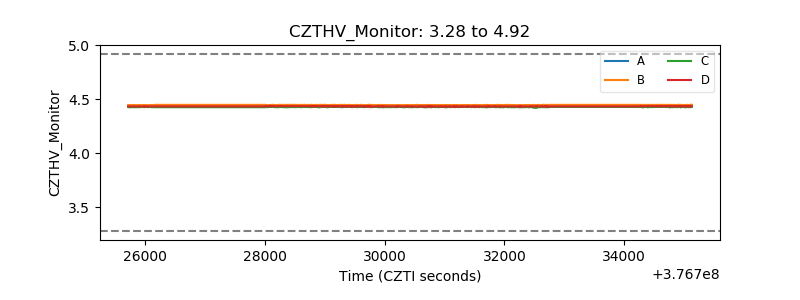 |
| D_VDD | 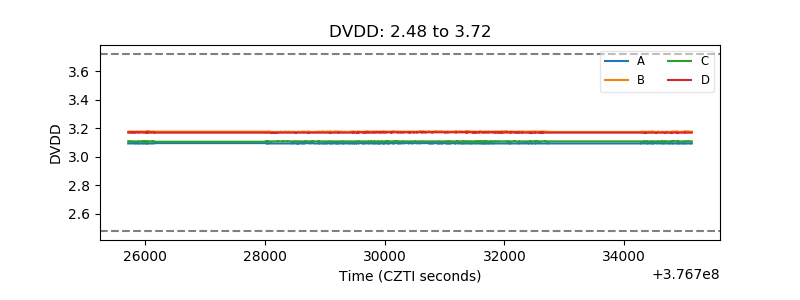 |
| Temperature 1 | 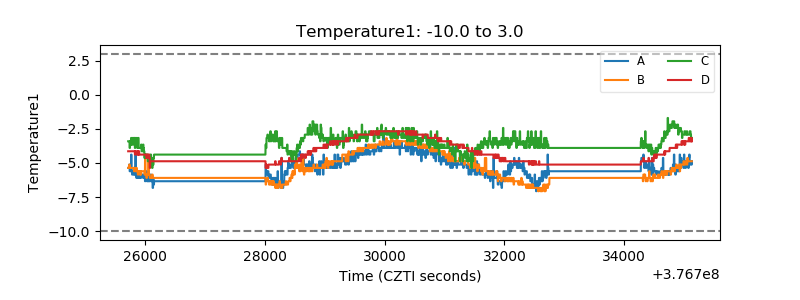 |
| Veto HV Monitor | 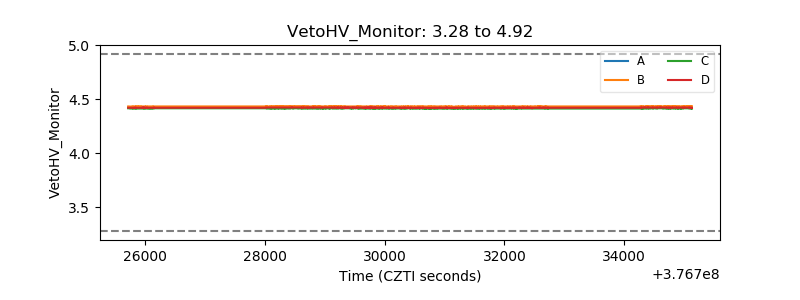 |
| Veto LLD | 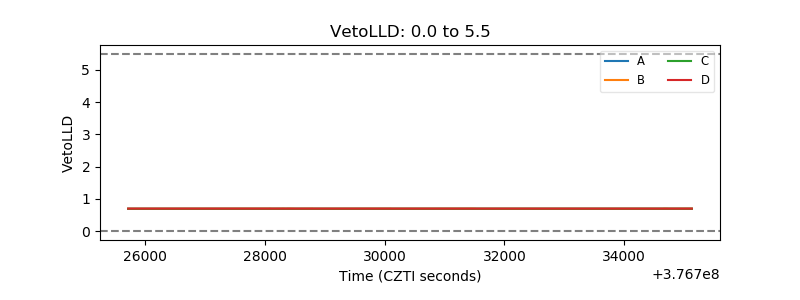 |
| Alpha Counter | 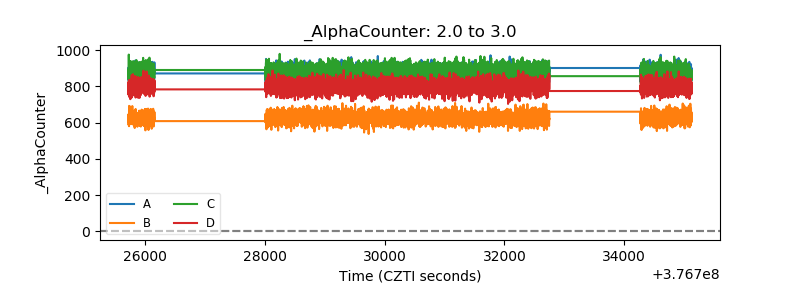 |
| _CPM_Rate | 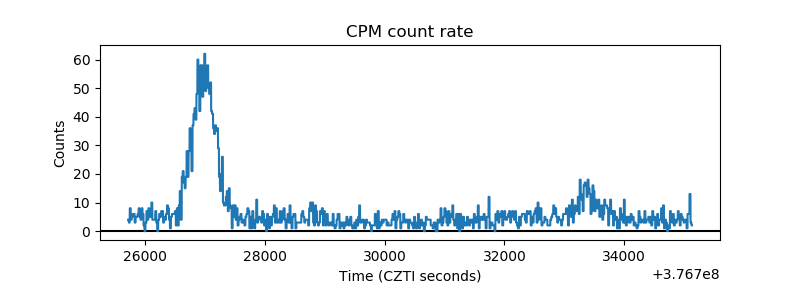 |
| CZT Counter | 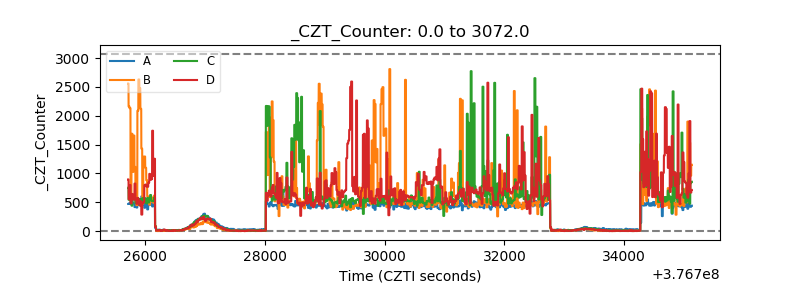 |
| +2.5 Volts monitor |  |
| +5 Volts monitor |  |
| _ROLL_ROT | 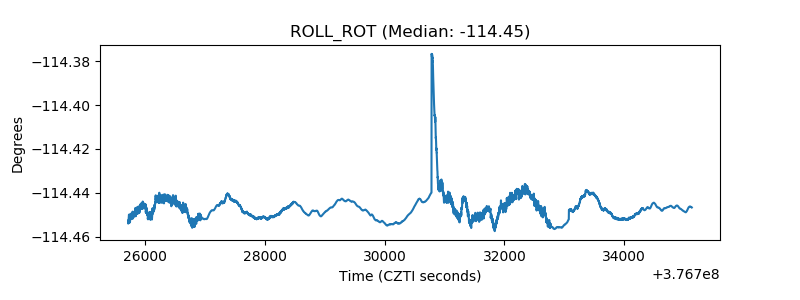 |
| _Roll_DEC | 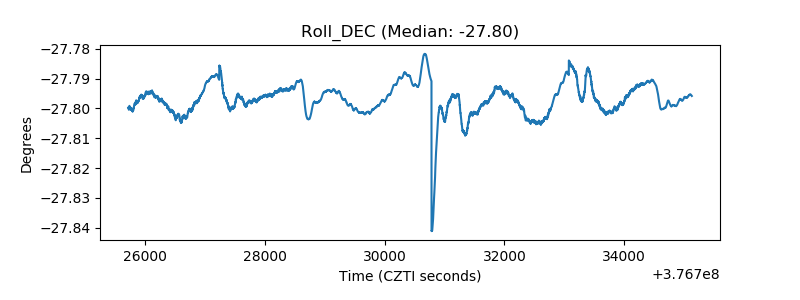 |
| _Roll_RA | 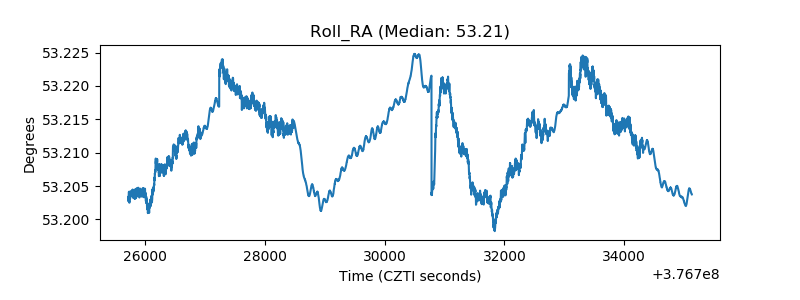 |
| Veto Counter |  |