| Param | Original file | Final file |
|---|---|---|
| Filename | modeM0/AS1A11_060T01_9000004804_33515cztM0_level2.evt | modeM0/AS1A11_060T01_9000004804_33515cztM0_level2_quad_clean.evt |
| Size (bytes) | 565,896,960 | 72,184,320 |
| Size | 539.7 MB | 68.8 MB |
| Events in quadrant A | 2,648,304 | 456,833 |
| Events in quadrant B | 4,289,222 | 455,226 |
| Events in quadrant C | 4,308,942 | 441,821 |
| Events in quadrant D | 5,497,557 | 424,707 |
| Mode M9 | |||
|---|---|---|---|
| Quadrant | BADHDUFLAG | Total packets | Discarded packets |
| A | 0 | 26 | 0 |
| B | 0 | 26 | 0 |
| C | 0 | 26 | 0 |
| D | 0 | 27 | 0 |
| Mode M0 | |||
|---|---|---|---|
| Quadrant | BADHDUFLAG | Total packets | Discarded packets |
| A | 0 | 11688 | 3 |
| B | 0 | 16463 | 2 |
| C | 0 | 16606 | 2 |
| D | 0 | 20275 | 2 |
| Mode SS | |||
|---|---|---|---|
| Quadrant | BADHDUFLAG | Total packets | Discarded packets |
| A | 0 | 118 | 0 |
| B | 0 | 118 | 0 |
| C | 0 | 118 | 0 |
| D | 0 | 118 | 0 |
| Quadrant | Total seconds | Saturated seconds | Saturation percentage |
|---|---|---|---|
| A | 5825 | 11 | 0.188841% |
| B | 5825 | 517 | 8.875536% |
| C | 5825 | 276 | 4.738197% |
| D | 5825 | 443 | 7.605150% |
Noise dominated data is calculated using 1-second bins in cleaned event files. If a bin has >2000 counts, and if more than 50% of those come from <1% of pixels, then it is considered to be noise-dominated and hence unusable.
| Quadrant | # 1 sec bins | Bins with >0 counts | Bins with >2000 counts | High rate bins dominated by noise | Noise dominated (total time) | Noise dominated (detector-on time) | Marked lightcurve |
|---|---|---|---|---|---|---|---|
| A | 7167 | 5826 | 0 | 0 | 0.00% | 0.00% | 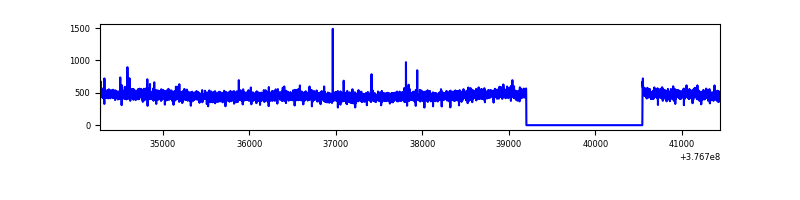 |
| B | 7167 | 5826 | 355 | 355 | 4.95% | 6.09% | 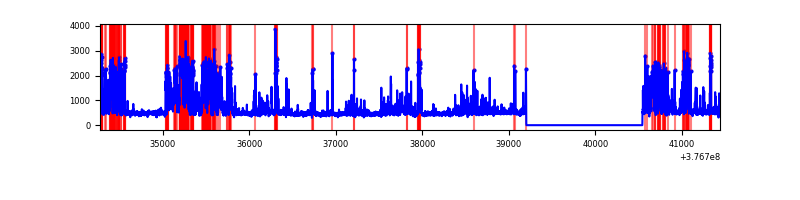 |
| C | 7167 | 5826 | 219 | 219 | 3.06% | 3.76% | 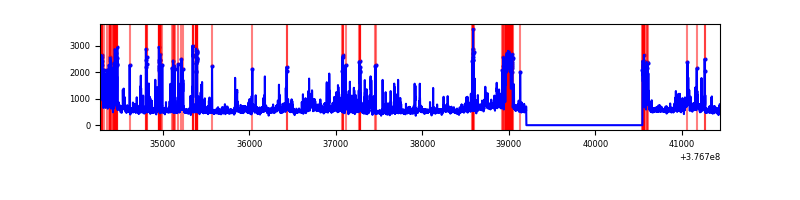 |
| D | 7166 | 5825 | 381 | 381 | 5.32% | 6.54% | 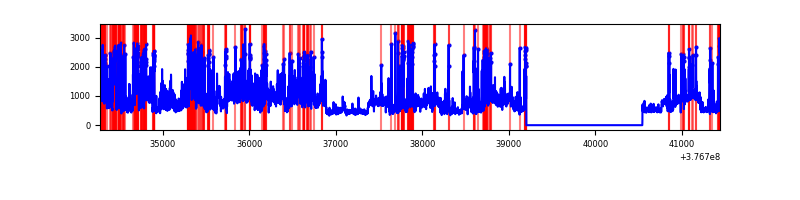 |
Top three noisy pixels from each quadrant. If the there are fewer than three noisy pixels in the level2.evt file, extra rows are filled as -1
| Pixel properties | Quadrant properties | ||||||
|---|---|---|---|---|---|---|---|
| Quadrant | DetID | PixID | Counts | Sigma | Mean | Median | Sigma |
| A | 13 | 254 | 9317 | 62.97 | 682 | 667 | 137.4 |
| A | 13 | 6 | 8519 | 57.16 | 682 | 667 | 137.4 |
| A | 3 | 137 | 6999 | 46.1 | 682 | 667 | 137.4 |
| B | 5 | 255 | 843685 | 6562.74 | 659 | 639 | 128.5 |
| B | 5 | 172 | 558704 | 4344.29 | 659 | 639 | 128.5 |
| B | 4 | 251 | 218824 | 1698.47 | 659 | 639 | 128.5 |
| C | 3 | 233 | 743697 | 4859.96 | 654 | 659 | 152.9 |
| C | 14 | 254 | 368252 | 2404.3 | 654 | 659 | 152.9 |
| C | 15 | 214 | 267922 | 1748.08 | 654 | 659 | 152.9 |
| D | 8 | 195 | 911560 | 5698.0 | 647 | 627 | 159.9 |
| D | 2 | 250 | 780981 | 4881.21 | 647 | 627 | 159.9 |
| D | 2 | 120 | 685921 | 4286.6 | 647 | 627 | 159.9 |
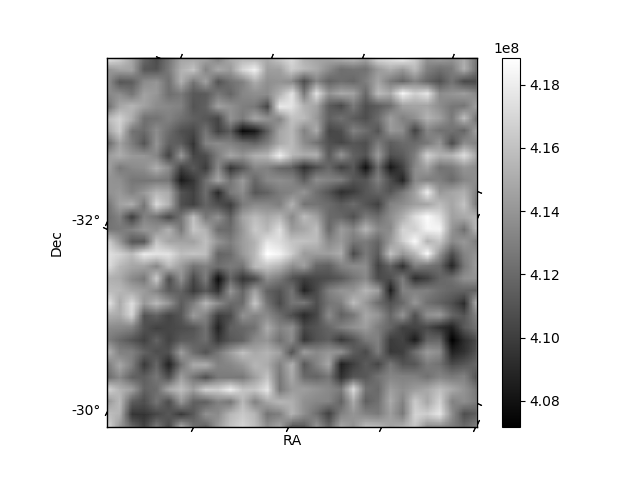
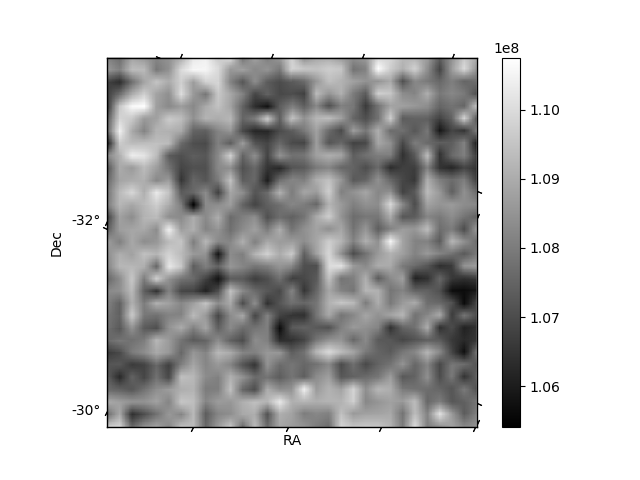
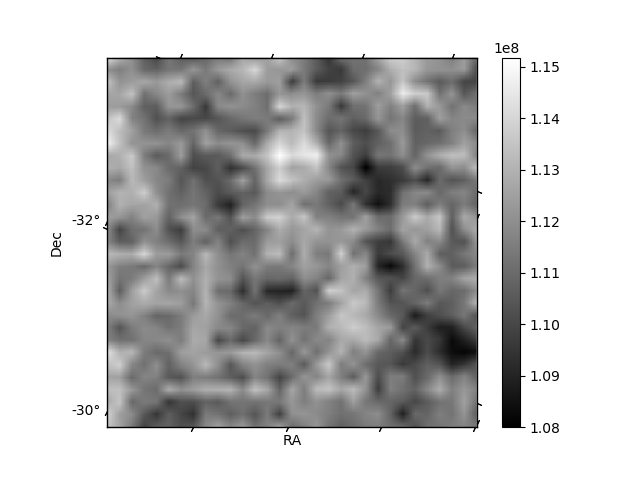
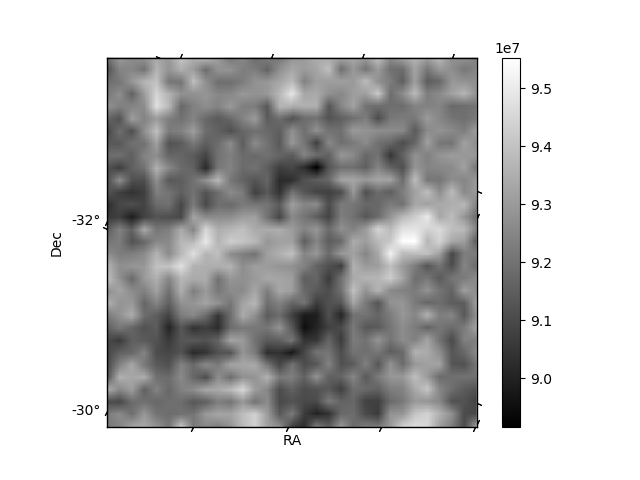
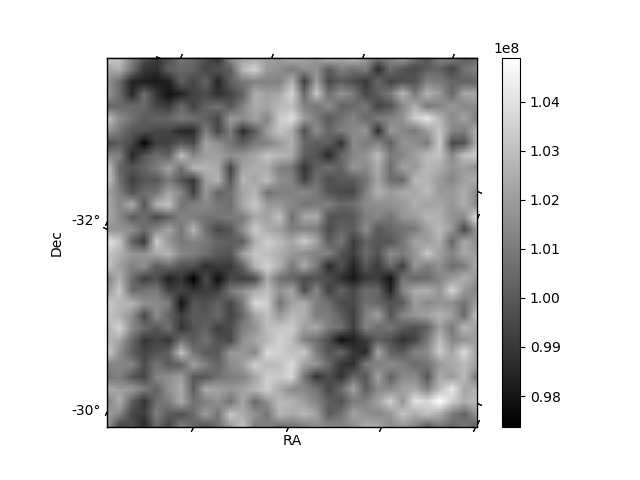
Histogram calculated using DETX and DETY for each event in the final _common_clean file
| Quadrant A | 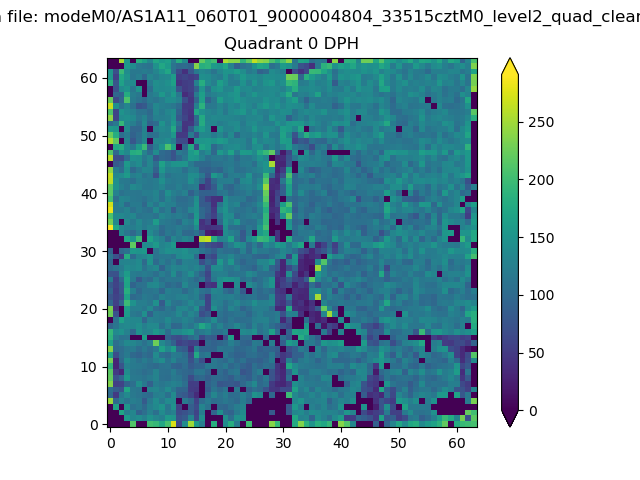 |
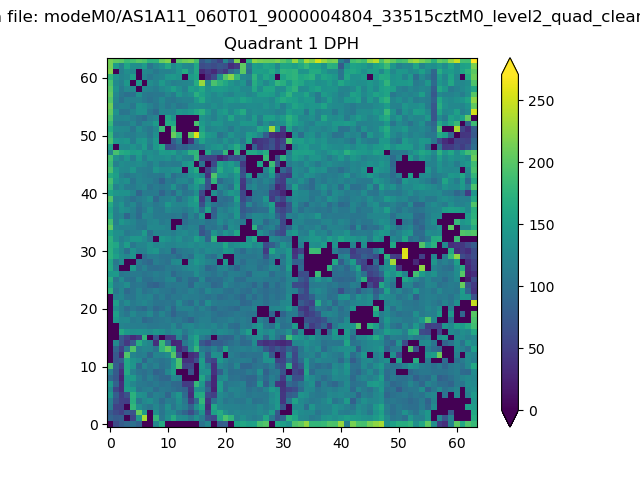 |
Quadrant B |
|---|---|---|---|
| Quadrant D | 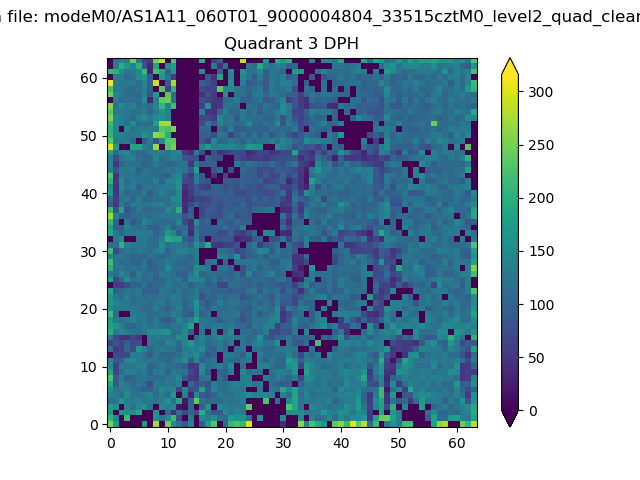 |
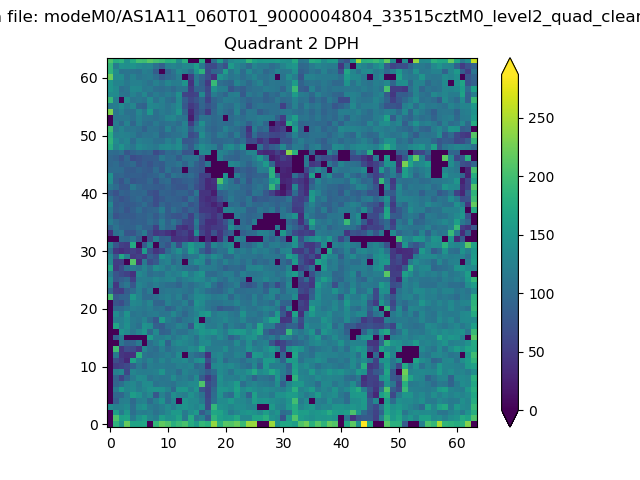 |
Quadrant C |
| Plot type | Count rate plots | Images |
|---|---|---|
| Comparison with Poisson distribution Blue bars denote a histogram of data divided into 1 sec bins. Red curve is a Poisson curve with rate = median count rate of data. |
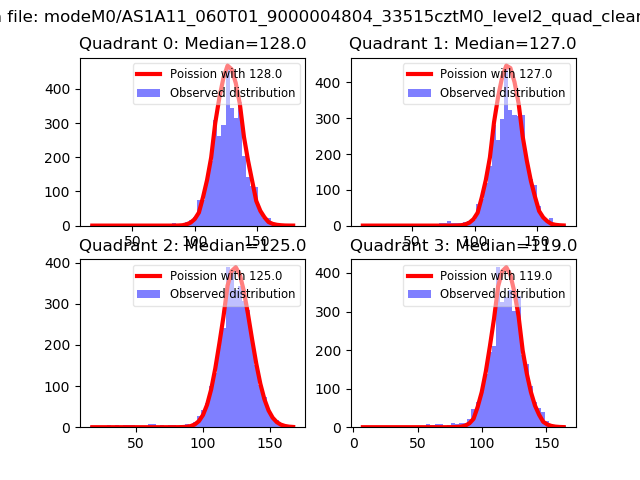 |
 |
| Quadrant-wise count rates Data is divided into 100 sec bins |
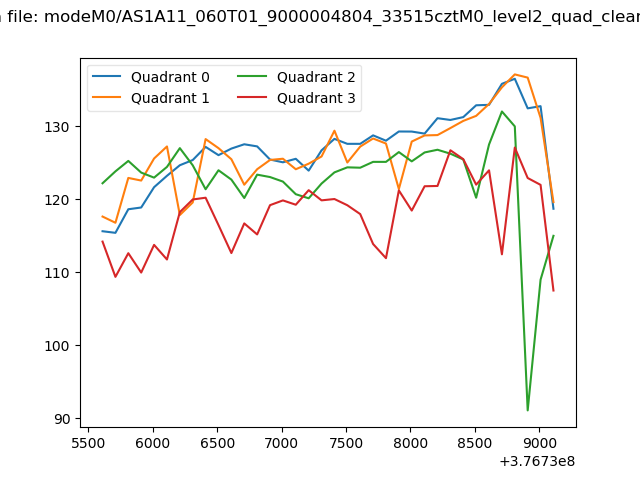 |
|
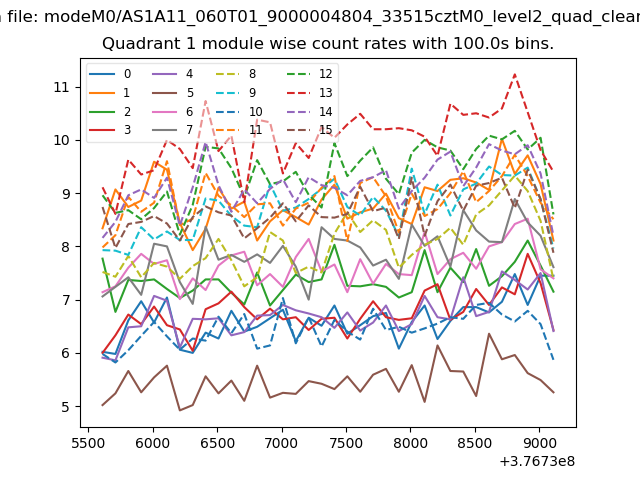
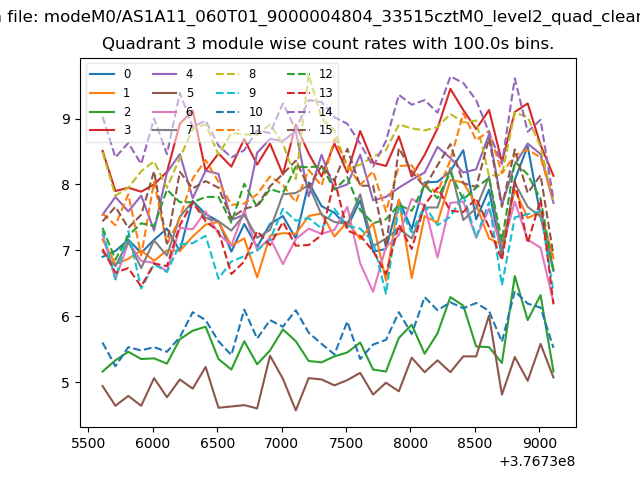
| Module-wise count rates for Quadrant A Data is divided into 100 sec bins |
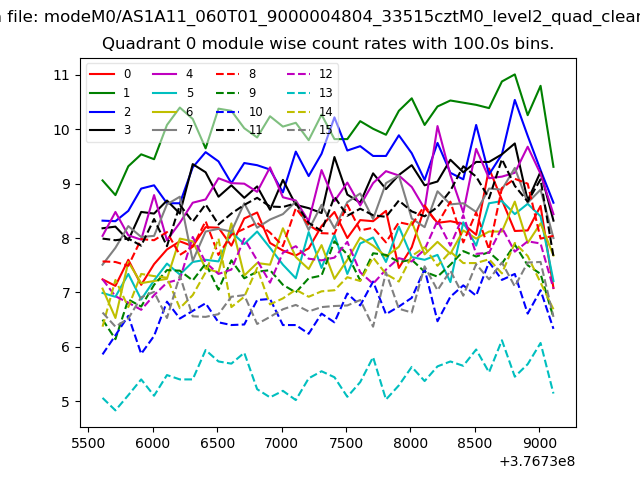 |
 |
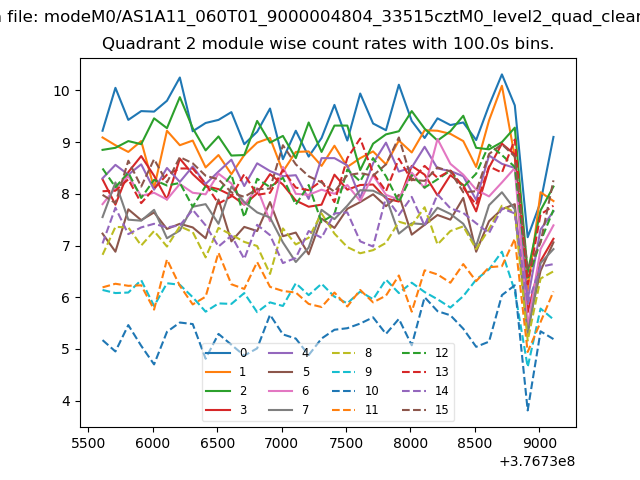
| Module-wise count rates for Quadrant B Data is divided into 100 sec bins |
 |
 |
| Module-wise count rates for Quadrant C Data is divided into 100 sec bins |
 |
 |
| Module-wise count rates for Quadrant D Data is divided into 100 sec bins |
 |
 |
| Parameter | Plot |
|---|---|
| CZT HV Monitor | 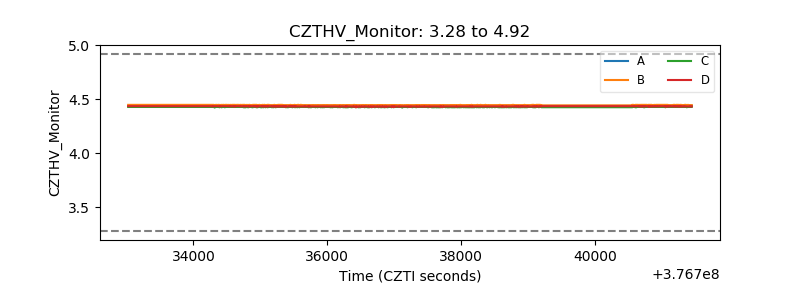 |
| D_VDD | 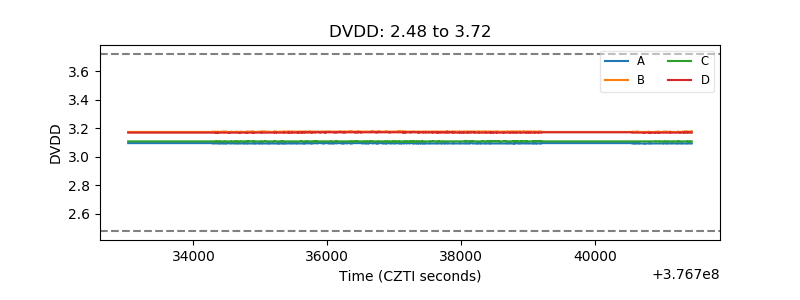 |
| Temperature 1 | 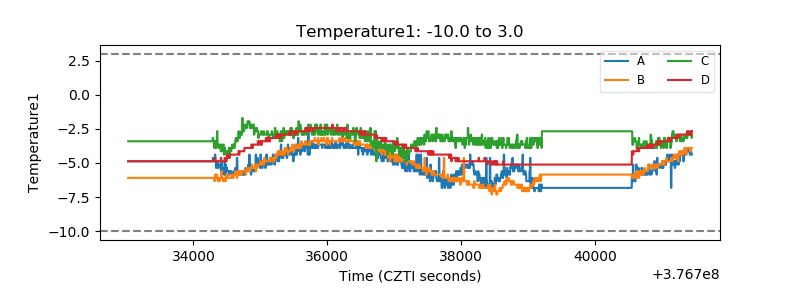 |
| Veto HV Monitor | 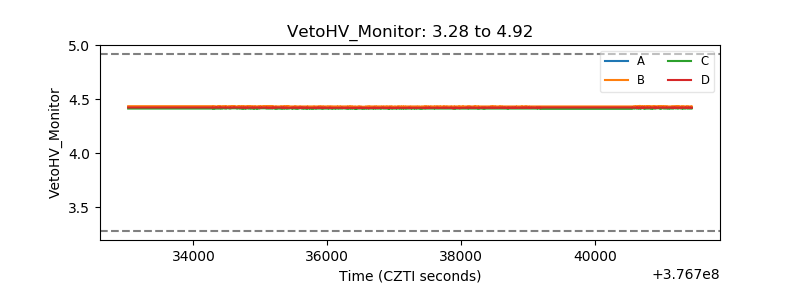 |
| Veto LLD | 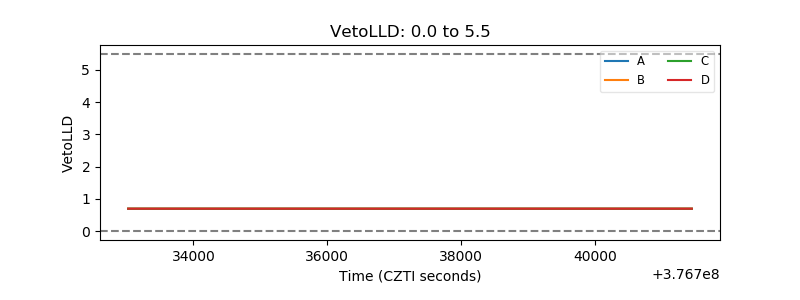 |
| Alpha Counter | 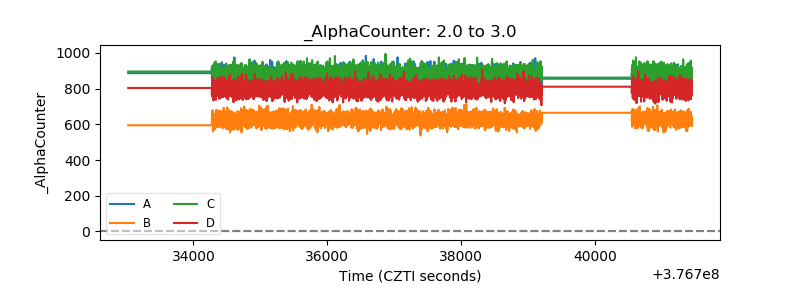 |
| _CPM_Rate | 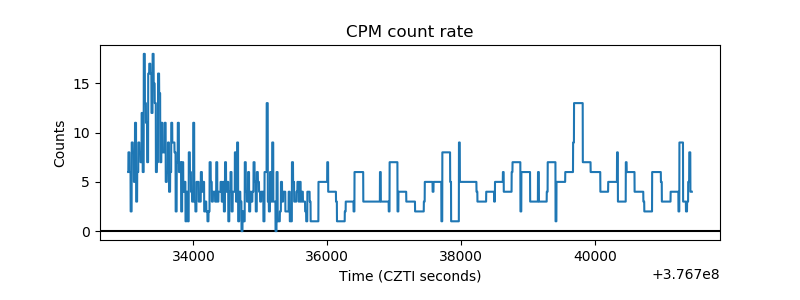 |
| CZT Counter | 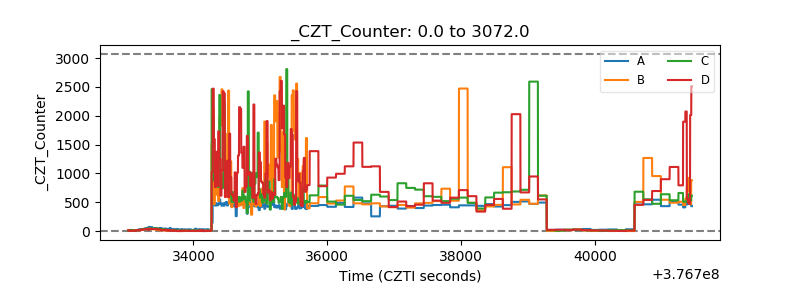 |
| +2.5 Volts monitor |  |
| +5 Volts monitor |  |
| _ROLL_ROT | 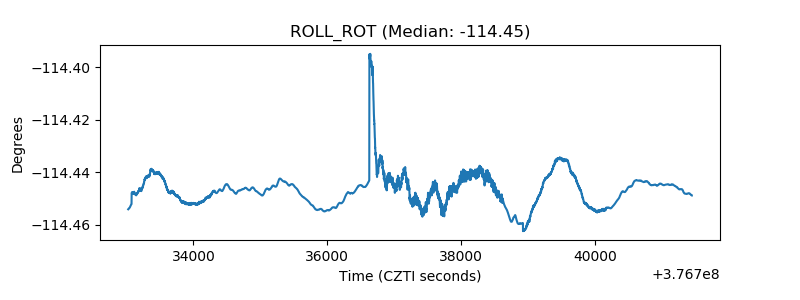 |
| _Roll_DEC | 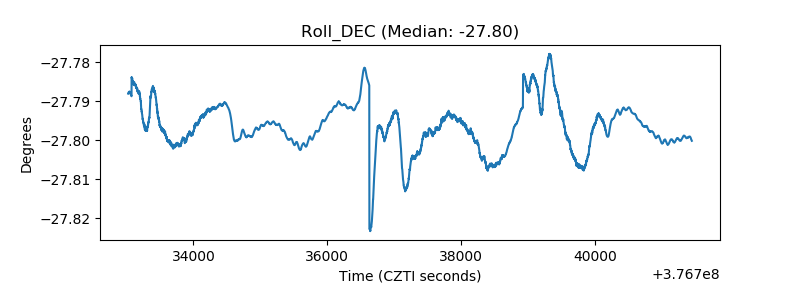 |
| _Roll_RA | 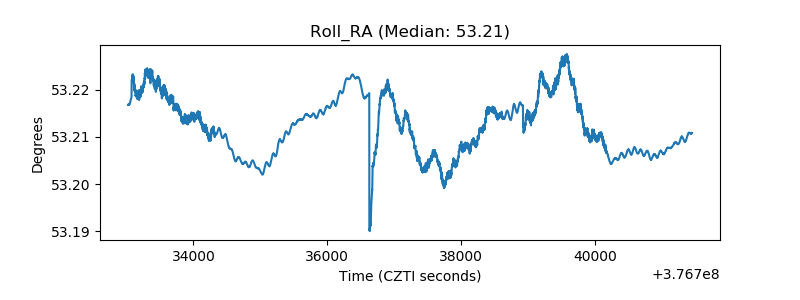 |
| Veto Counter | 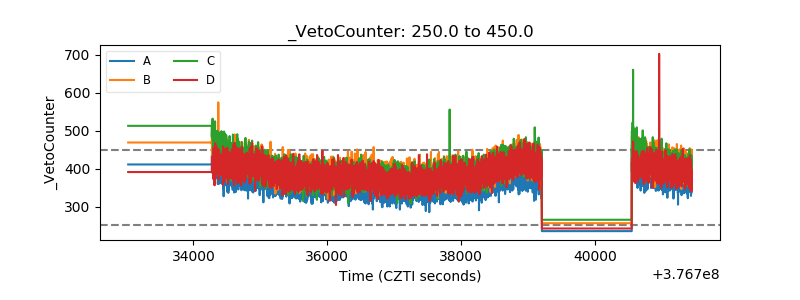 |