| Param | Original file | Final file |
|---|---|---|
| Filename | modeM0/AS1A11_060T01_9000004804_33516cztM0_level2.evt | modeM0/AS1A11_060T01_9000004804_33516cztM0_level2_quad_clean.evt |
| Size (bytes) | 634,798,080 | 95,682,240 |
| Size | 605.4 MB | 91.2 MB |
| Events in quadrant A | 3,119,785 | 628,731 |
| Events in quadrant B | 5,423,793 | 599,526 |
| Events in quadrant C | 4,534,800 | 613,221 |
| Events in quadrant D | 5,686,302 | 581,870 |
| Mode M9 | |||
|---|---|---|---|
| Quadrant | BADHDUFLAG | Total packets | Discarded packets |
| A | 0 | 27 | 0 |
| B | 0 | 27 | 0 |
| C | 0 | 27 | 0 |
| D | 0 | 27 | 0 |
| Mode M0 | |||
|---|---|---|---|
| Quadrant | BADHDUFLAG | Total packets | Discarded packets |
| A | 0 | 13667 | 3 |
| B | 0 | 20534 | 2 |
| C | 0 | 17998 | 2 |
| D | 0 | 21442 | 2 |
| Mode SS | |||
|---|---|---|---|
| Quadrant | BADHDUFLAG | Total packets | Discarded packets |
| A | 0 | 138 | 0 |
| B | 0 | 138 | 0 |
| C | 0 | 138 | 0 |
| D | 0 | 138 | 0 |
| Quadrant | Total seconds | Saturated seconds | Saturation percentage |
|---|---|---|---|
| A | 6809 | 12 | 0.176237% |
| B | 6809 | 696 | 10.221765% |
| C | 6809 | 193 | 2.834484% |
| D | 6809 | 387 | 5.683654% |
Noise dominated data is calculated using 1-second bins in cleaned event files. If a bin has >2000 counts, and if more than 50% of those come from <1% of pixels, then it is considered to be noise-dominated and hence unusable.
| Quadrant | # 1 sec bins | Bins with >0 counts | Bins with >2000 counts | High rate bins dominated by noise | Noise dominated (total time) | Noise dominated (detector-on time) | Marked lightcurve |
|---|---|---|---|---|---|---|---|
| A | 9464 | 6811 | 0 | 0 | 0.00% | 0.00% | 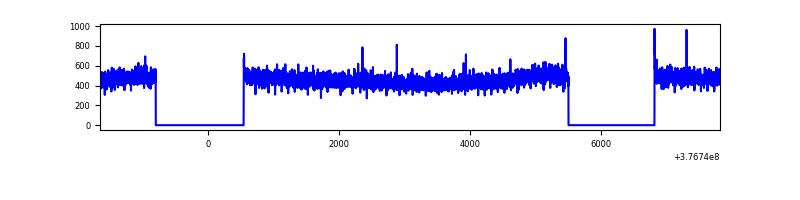 |
| B | 9464 | 6811 | 466 | 466 | 4.92% | 6.84% | 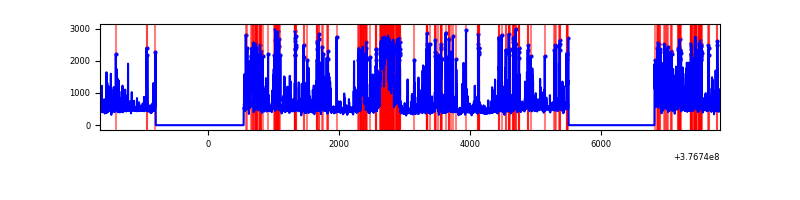 |
| C | 9464 | 6811 | 149 | 149 | 1.57% | 2.19% | 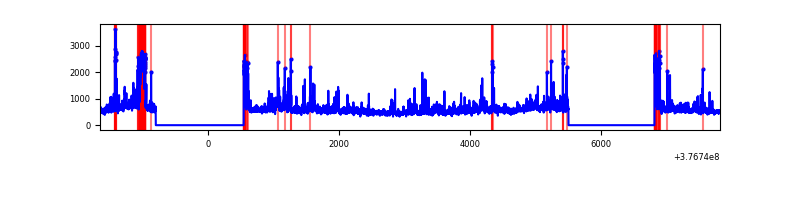 |
| D | 9464 | 6811 | 328 | 328 | 3.47% | 4.82% | 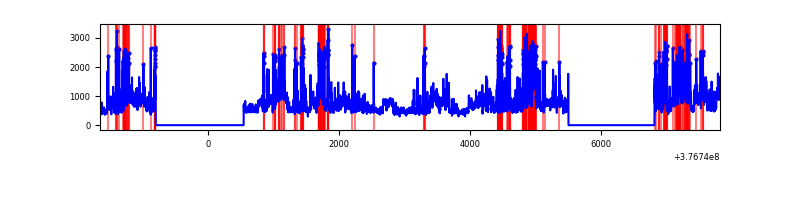 |
Top three noisy pixels from each quadrant. If the there are fewer than three noisy pixels in the level2.evt file, extra rows are filled as -1
| Pixel properties | Quadrant properties | ||||||
|---|---|---|---|---|---|---|---|
| Quadrant | DetID | PixID | Counts | Sigma | Mean | Median | Sigma |
| A | 13 | 254 | 11660 | 66.93 | 805 | 788 | 162.4 |
| A | 3 | 137 | 8207 | 45.67 | 805 | 788 | 162.4 |
| A | 0 | 226 | 6598 | 35.77 | 805 | 788 | 162.4 |
| B | 5 | 255 | 1316356 | 8812.24 | 770 | 749 | 149.3 |
| B | 5 | 172 | 1006831 | 6738.97 | 770 | 749 | 149.3 |
| B | 4 | 251 | 20704 | 133.66 | 770 | 749 | 149.3 |
| C | 3 | 233 | 764975 | 4236.88 | 776 | 783 | 180.4 |
| C | 15 | 214 | 312490 | 1728.19 | 776 | 783 | 180.4 |
| C | 0 | 10 | 207180 | 1144.32 | 776 | 783 | 180.4 |
| D | 8 | 195 | 1178852 | 6301.91 | 765 | 744 | 186.9 |
| D | 2 | 250 | 612227 | 3270.93 | 765 | 744 | 186.9 |
| D | 13 | 249 | 475035 | 2537.07 | 765 | 744 | 186.9 |
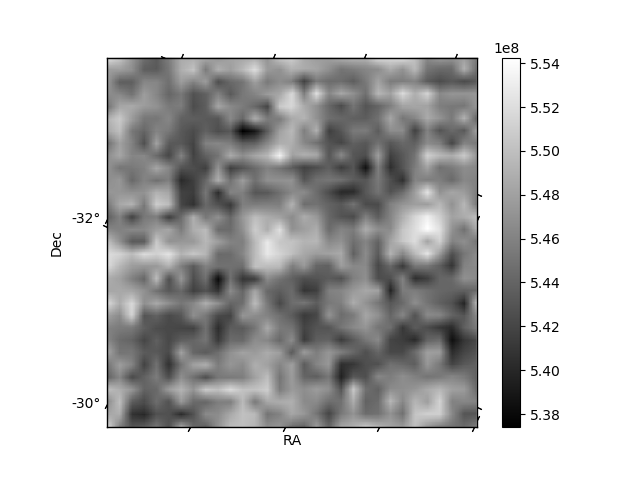
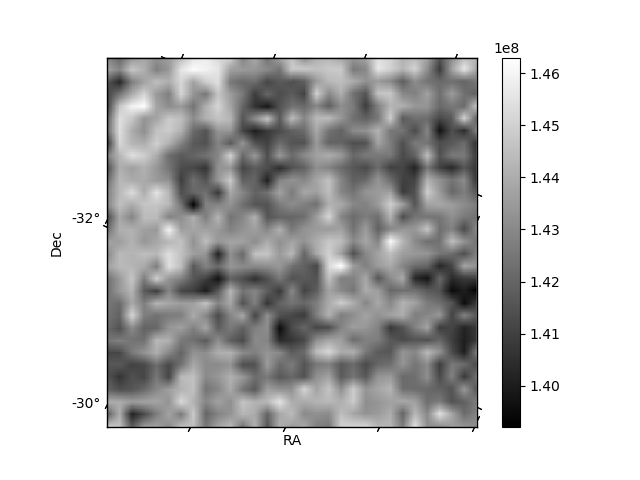
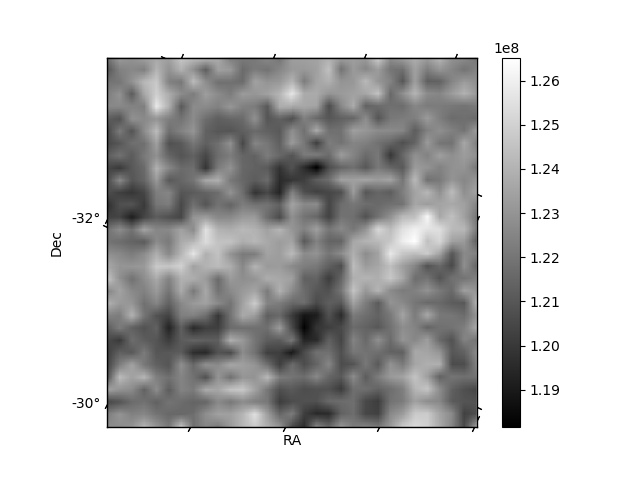
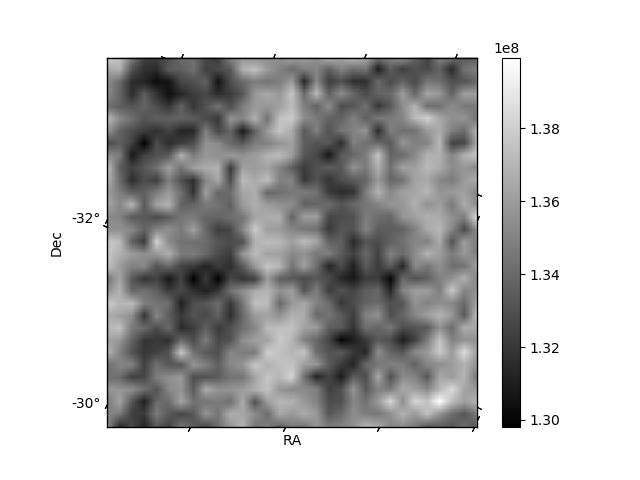
Histogram calculated using DETX and DETY for each event in the final _common_clean file
| Quadrant A | 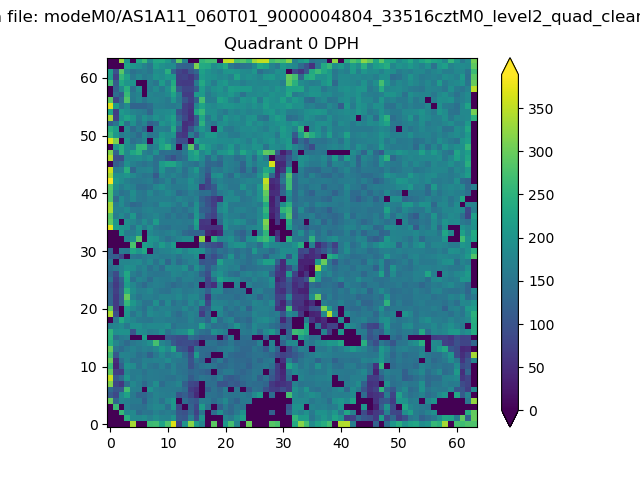 |
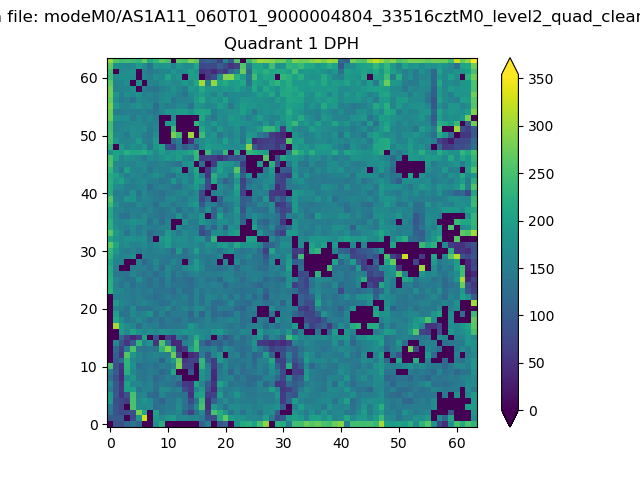 |
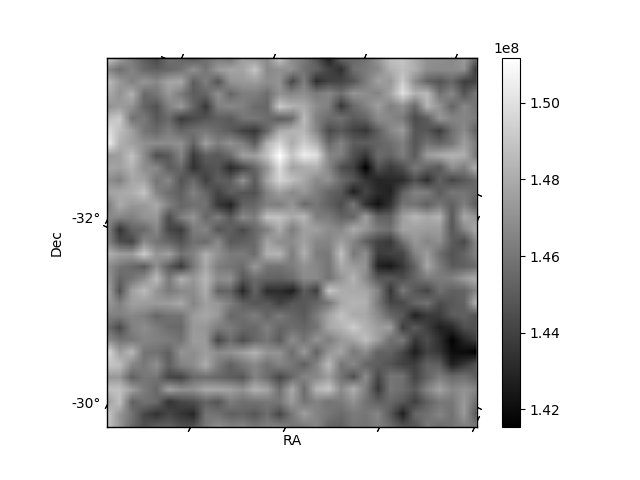
Quadrant B |
|---|---|---|---|
| Quadrant D | 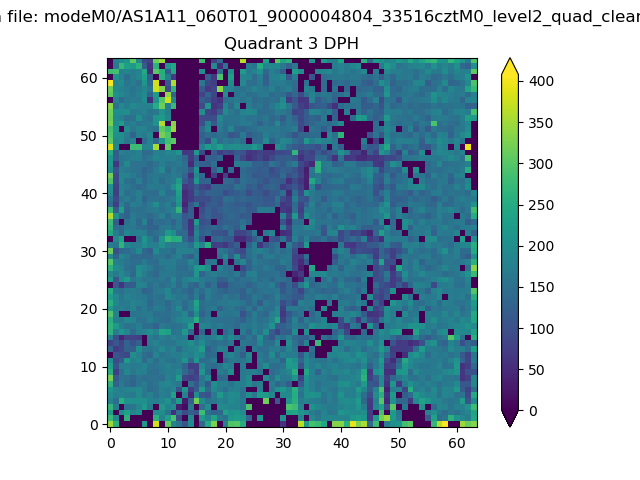 |
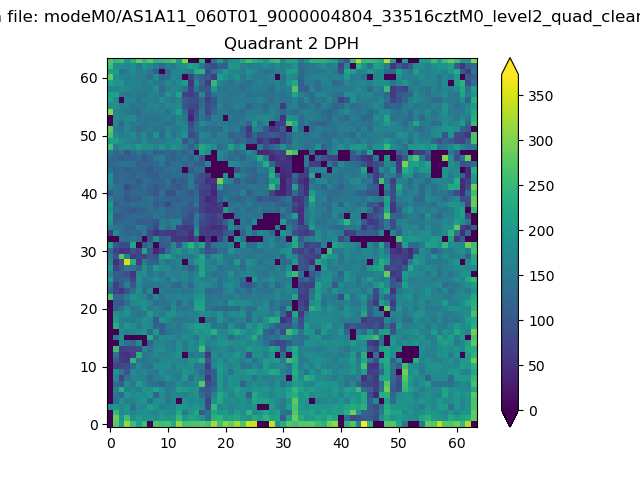 |
Quadrant C |
| Plot type | Count rate plots | Images |
|---|---|---|
| Comparison with Poisson distribution Blue bars denote a histogram of data divided into 1 sec bins. Red curve is a Poisson curve with rate = median count rate of data. |
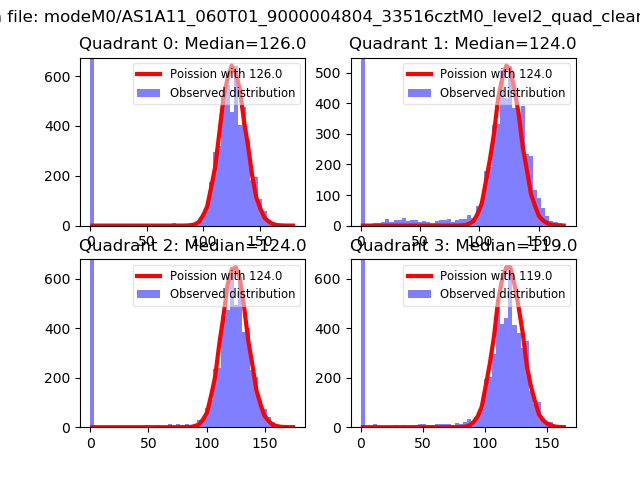 |
 |
| Quadrant-wise count rates Data is divided into 100 sec bins |
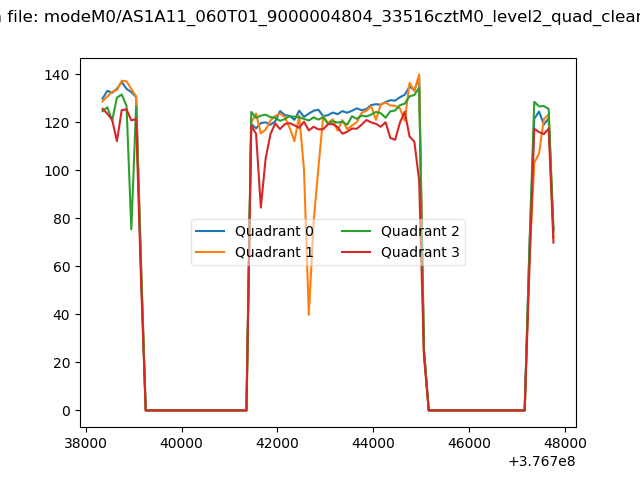 |
|
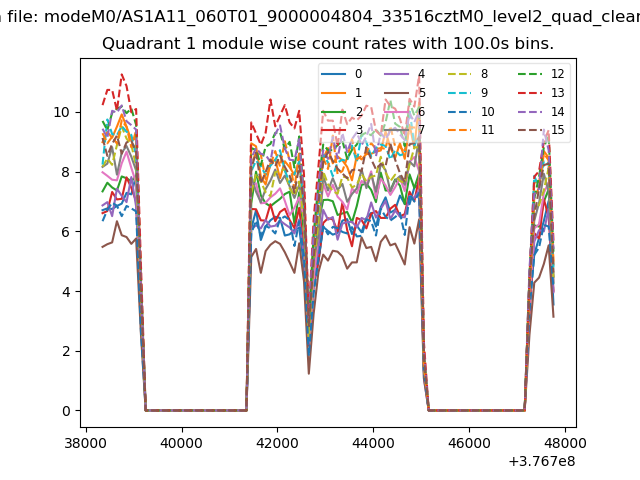
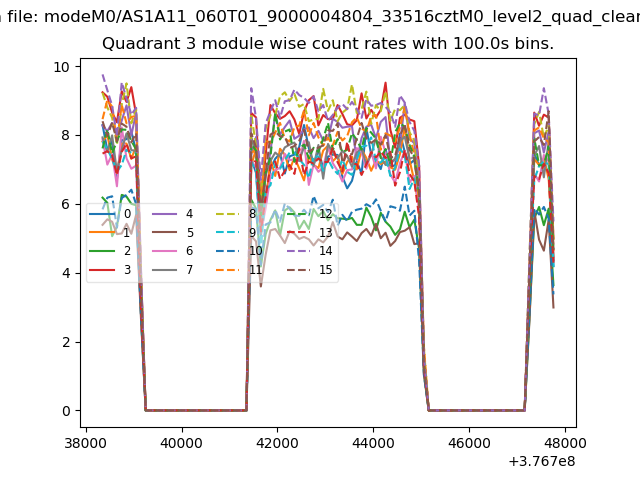
| Module-wise count rates for Quadrant A Data is divided into 100 sec bins |
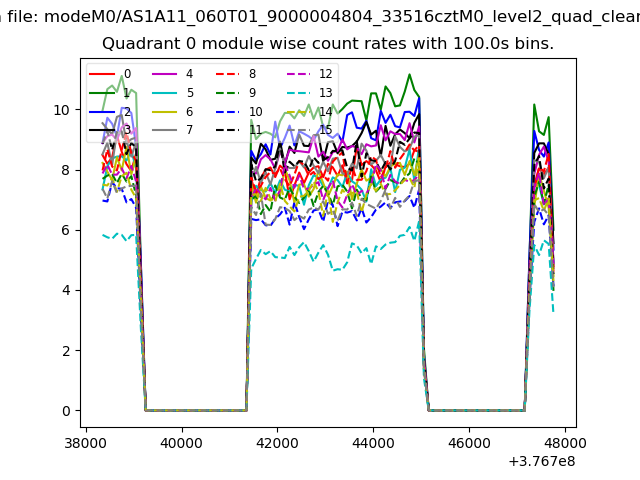 |
 |
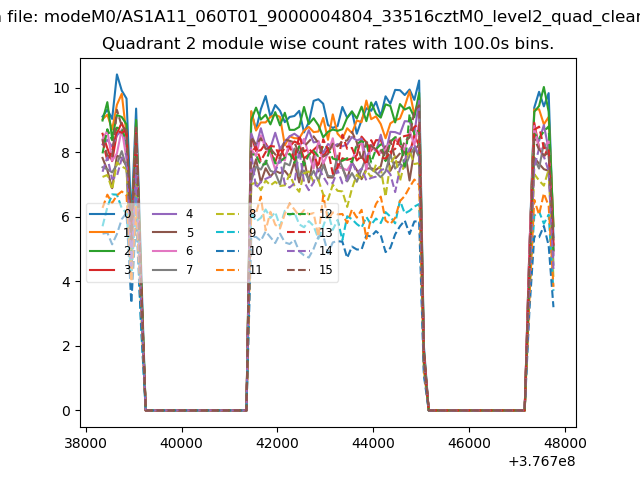
| Module-wise count rates for Quadrant B Data is divided into 100 sec bins |
 |
 |
| Module-wise count rates for Quadrant C Data is divided into 100 sec bins |
 |
 |
| Module-wise count rates for Quadrant D Data is divided into 100 sec bins |
 |
 |
| Parameter | Plot |
|---|---|
| CZT HV Monitor | 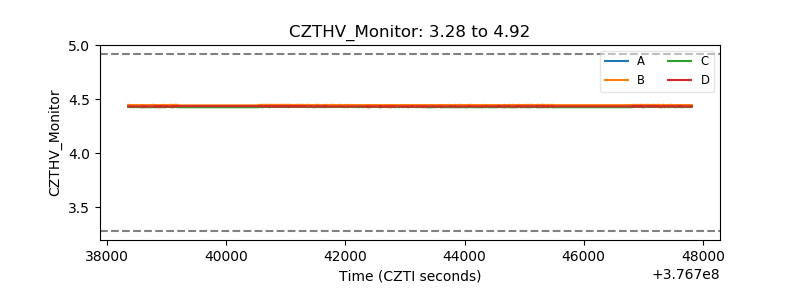 |
| D_VDD | 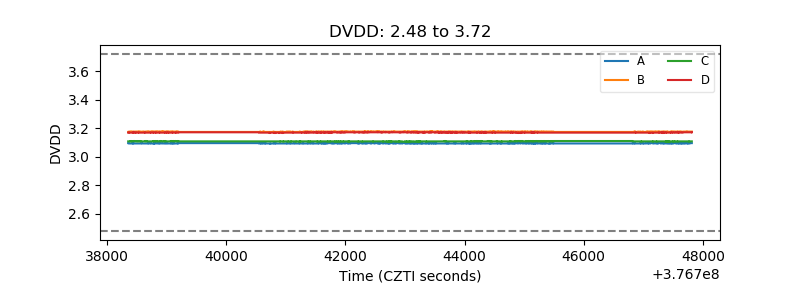 |
| Temperature 1 | 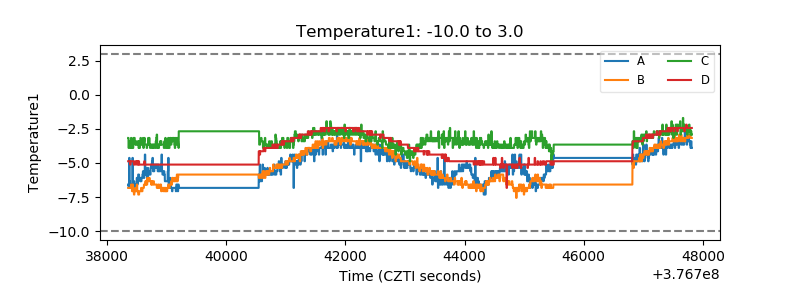 |
| Veto HV Monitor | 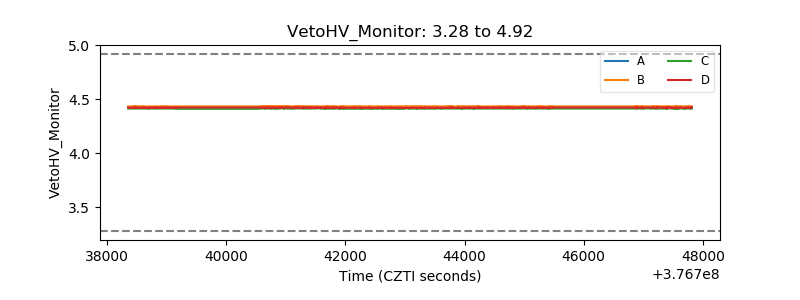 |
| Veto LLD | 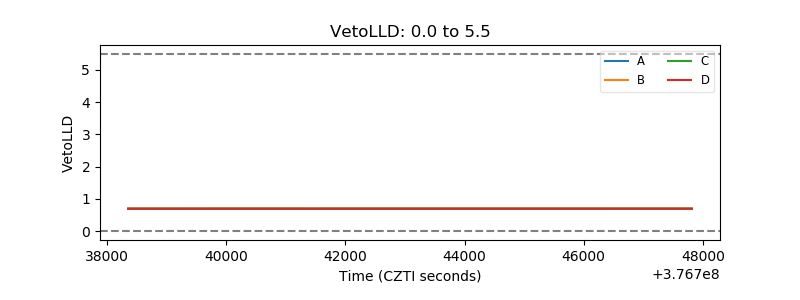 |
| Alpha Counter | 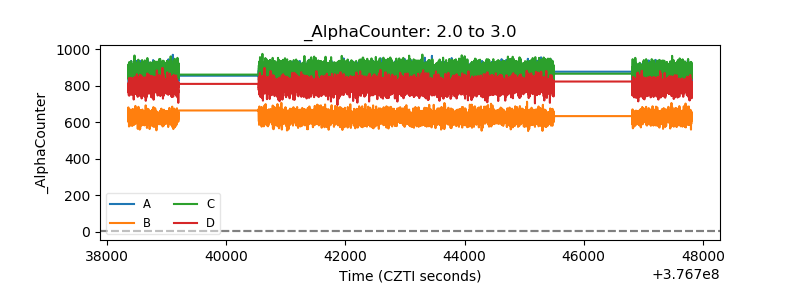 |
| _CPM_Rate | 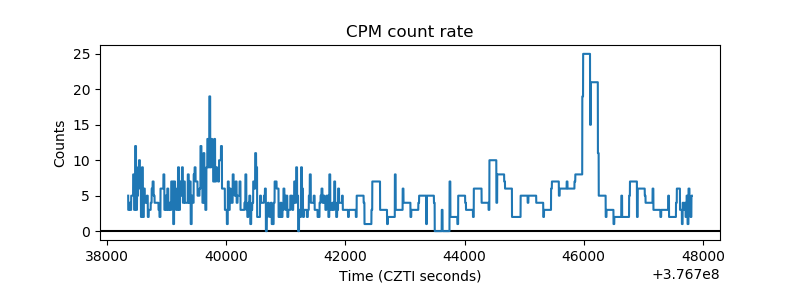 |
| CZT Counter | 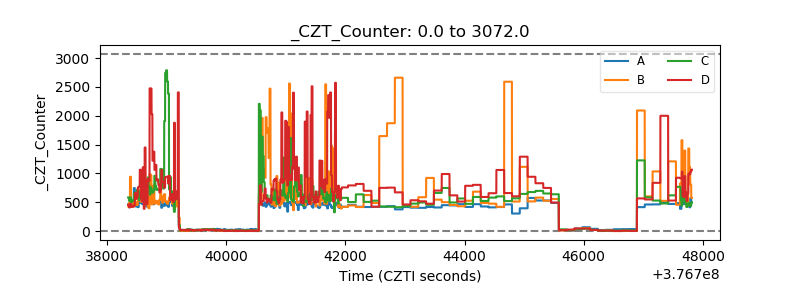 |
| +2.5 Volts monitor | 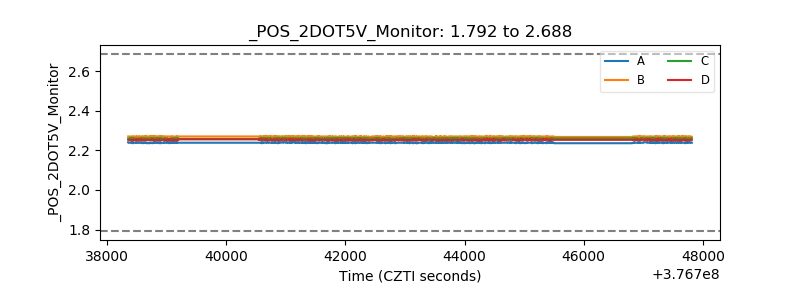 |
| +5 Volts monitor |  |
| _ROLL_ROT | 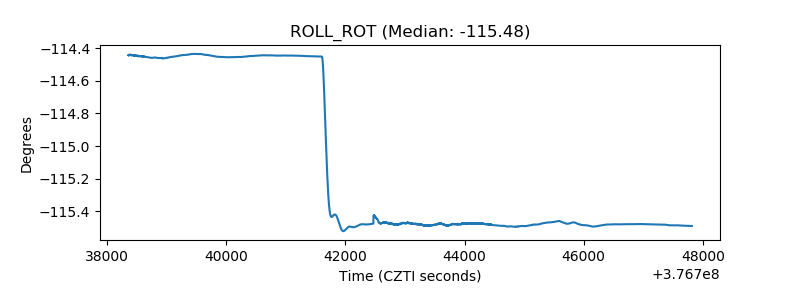 |
| _Roll_DEC | 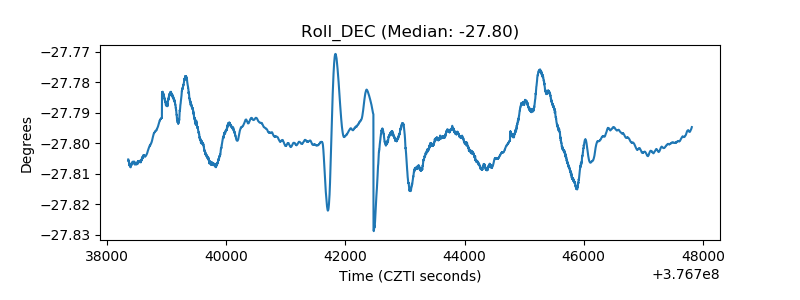 |
| _Roll_RA | 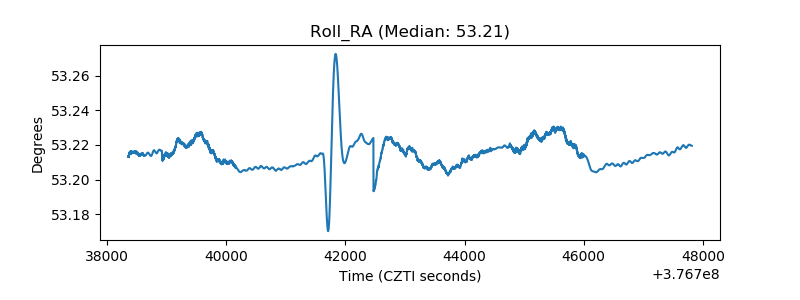 |
| Veto Counter | 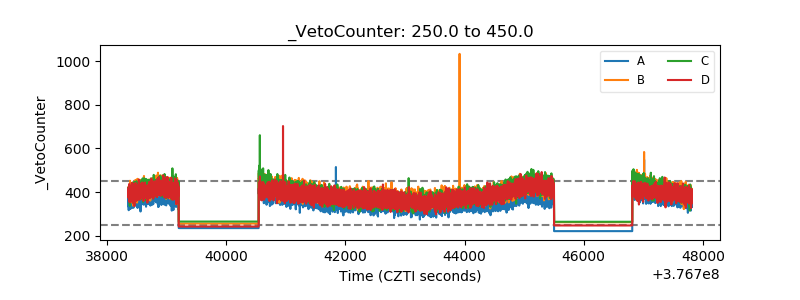 |