| Param | Original file | Final file |
|---|---|---|
| Filename | modeM0/AS1A11_060T01_9000004804_33518cztM0_level2.evt | modeM0/AS1A11_060T01_9000004804_33518cztM0_level2_quad_clean.evt |
| Size (bytes) | 1,072,347,840 | 156,703,680 |
| Size | 1022.7 MB | 149.4 MB |
| Events in quadrant A | 5,099,966 | 1,035,474 |
| Events in quadrant B | 9,467,025 | 975,848 |
| Events in quadrant C | 7,214,522 | 1,006,733 |
| Events in quadrant D | 9,942,784 | 955,432 |
| Mode M9 | |||
|---|---|---|---|
| Quadrant | BADHDUFLAG | Total packets | Discarded packets |
| A | 0 | 41 | 0 |
| B | 0 | 41 | 0 |
| C | 0 | 41 | 0 |
| D | 0 | 41 | 0 |
| Mode M0 | |||
|---|---|---|---|
| Quadrant | BADHDUFLAG | Total packets | Discarded packets |
| A | 0 | 22470 | 4 |
| B | 0 | 35608 | 3 |
| C | 0 | 29037 | 3 |
| D | 0 | 37117 | 3 |
| Mode SS | |||
|---|---|---|---|
| Quadrant | BADHDUFLAG | Total packets | Discarded packets |
| A | 0 | 230 | 0 |
| B | 0 | 230 | 0 |
| C | 0 | 230 | 0 |
| D | 0 | 230 | 0 |
| Quadrant | Total seconds | Saturated seconds | Saturation percentage |
|---|---|---|---|
| A | 11155 | 20 | 0.179292% |
| B | 11155 | 1291 | 11.573286% |
| C | 11155 | 164 | 1.470193% |
| D | 11155 | 570 | 5.109816% |
Noise dominated data is calculated using 1-second bins in cleaned event files. If a bin has >2000 counts, and if more than 50% of those come from <1% of pixels, then it is considered to be noise-dominated and hence unusable.
| Quadrant | # 1 sec bins | Bins with >0 counts | Bins with >2000 counts | High rate bins dominated by noise | Noise dominated (total time) | Noise dominated (detector-on time) | Marked lightcurve |
|---|---|---|---|---|---|---|---|
| A | 15274 | 11158 | 0 | 0 | 0.00% | 0.00% | 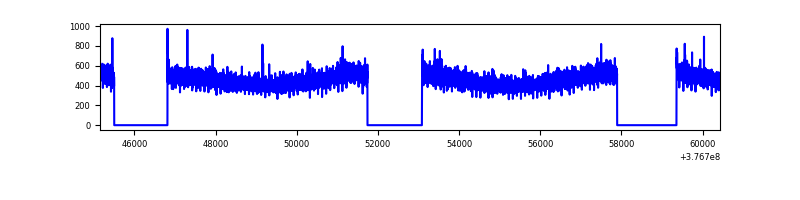 |
| B | 15274 | 11158 | 925 | 925 | 6.06% | 8.29% |  |
| C | 15274 | 11158 | 115 | 115 | 0.75% | 1.03% | 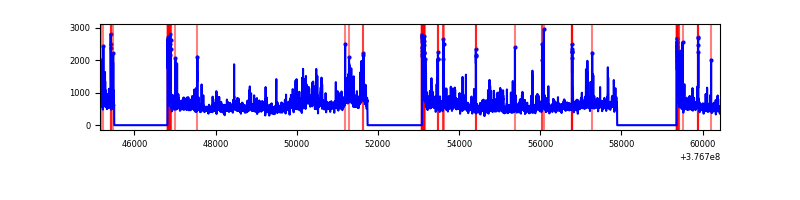 |
| D | 15274 | 11158 | 473 | 473 | 3.10% | 4.24% | 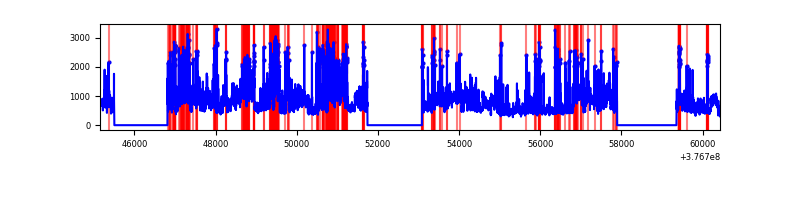 |
Top three noisy pixels from each quadrant. If the there are fewer than three noisy pixels in the level2.evt file, extra rows are filled as -1
| Pixel properties | Quadrant properties | ||||||
|---|---|---|---|---|---|---|---|
| Quadrant | DetID | PixID | Counts | Sigma | Mean | Median | Sigma |
| A | 13 | 254 | 18050 | 63.6 | 1316 | 1289 | 263.5 |
| A | 3 | 137 | 13436 | 46.09 | 1316 | 1289 | 263.5 |
| A | 0 | 226 | 10813 | 36.14 | 1316 | 1289 | 263.5 |
| B | 5 | 255 | 2728881 | 11329.36 | 1250 | 1218 | 240.8 |
| B | 5 | 172 | 1731661 | 7187.4 | 1250 | 1218 | 240.8 |
| B | 12 | 111 | 30632 | 122.17 | 1250 | 1218 | 240.8 |
| C | 3 | 233 | 916267 | 3135.86 | 1266 | 1276 | 291.8 |
| C | 15 | 214 | 512066 | 1750.58 | 1266 | 1276 | 291.8 |
| C | 0 | 10 | 343450 | 1172.7 | 1266 | 1276 | 291.8 |
| D | 8 | 195 | 2403157 | 7857.62 | 1251 | 1216 | 305.7 |
| D | 2 | 120 | 990187 | 3235.28 | 1251 | 1216 | 305.7 |
| D | 2 | 250 | 834195 | 2724.98 | 1251 | 1216 | 305.7 |
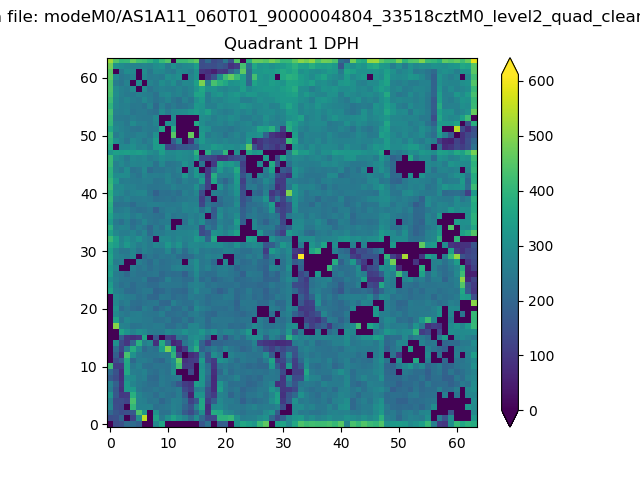
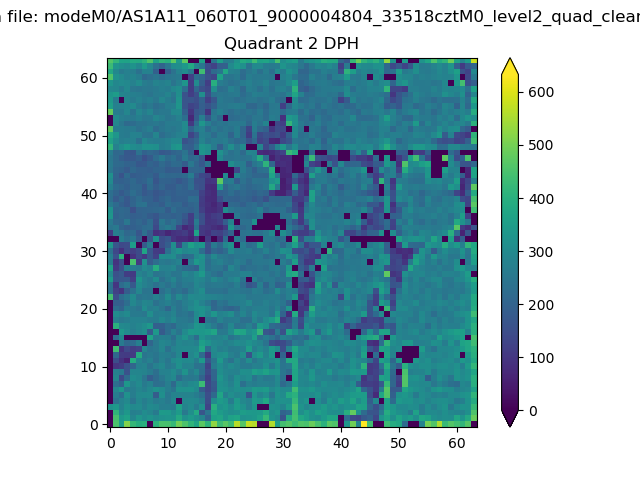
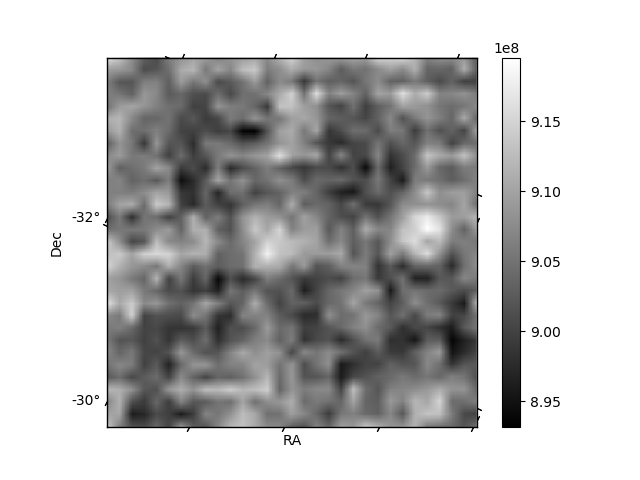
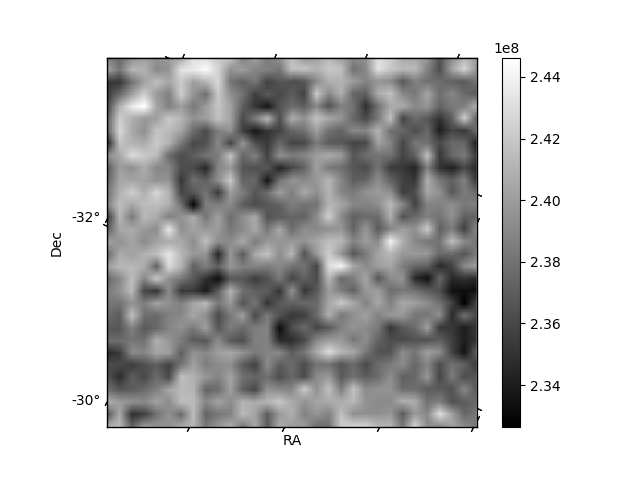
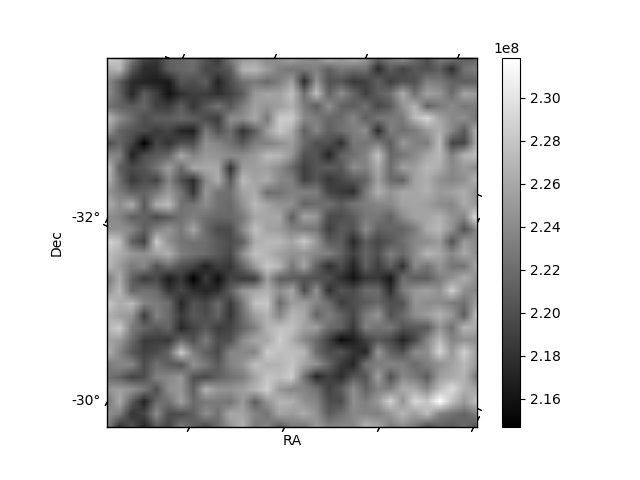
Histogram calculated using DETX and DETY for each event in the final _common_clean file
| Quadrant A | 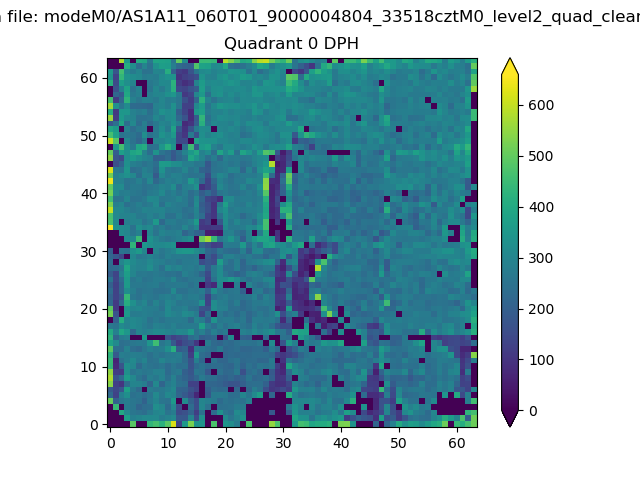 |
 |
Quadrant B |
|---|---|---|---|
| Quadrant D | 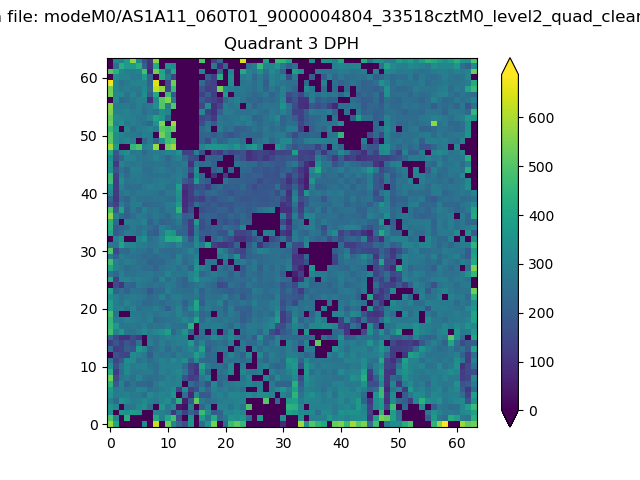 |
 |
Quadrant C |
| Plot type | Count rate plots | Images |
|---|---|---|
| Comparison with Poisson distribution Blue bars denote a histogram of data divided into 1 sec bins. Red curve is a Poisson curve with rate = median count rate of data. |
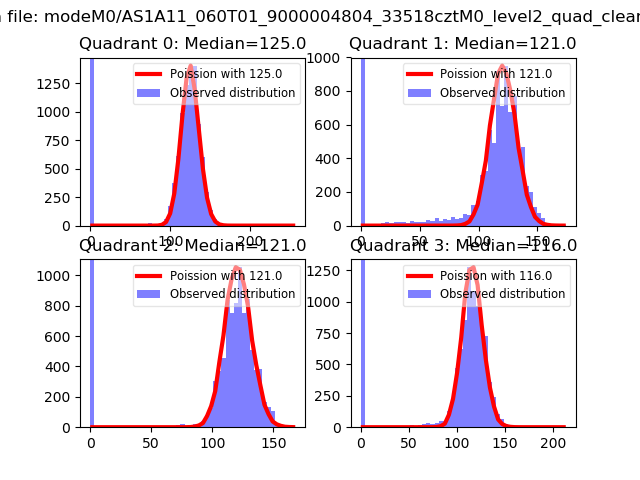 |
 |
| Quadrant-wise count rates Data is divided into 100 sec bins |
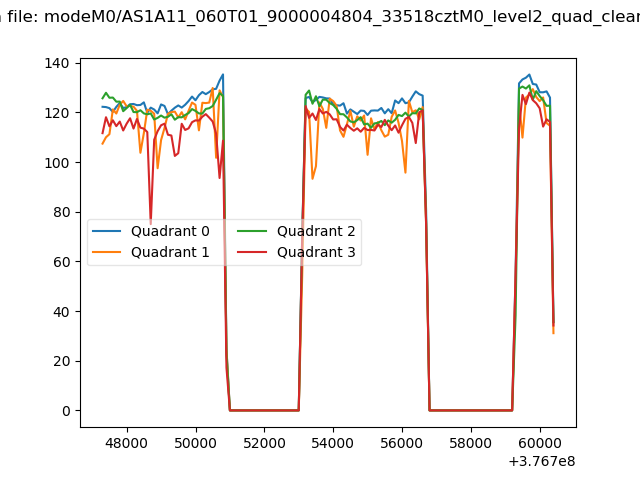 |
|
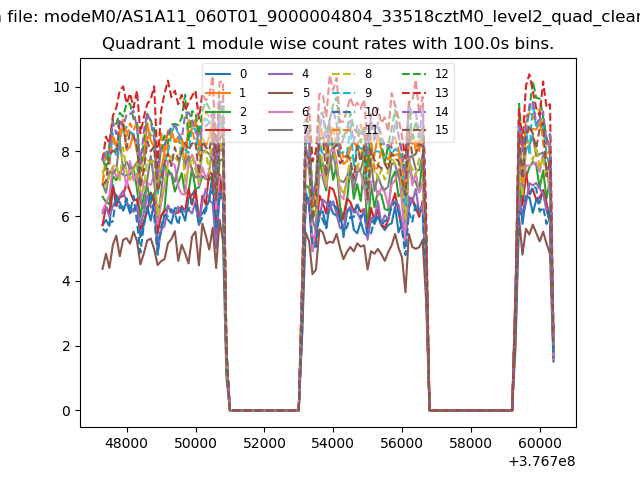
| Module-wise count rates for Quadrant A Data is divided into 100 sec bins |
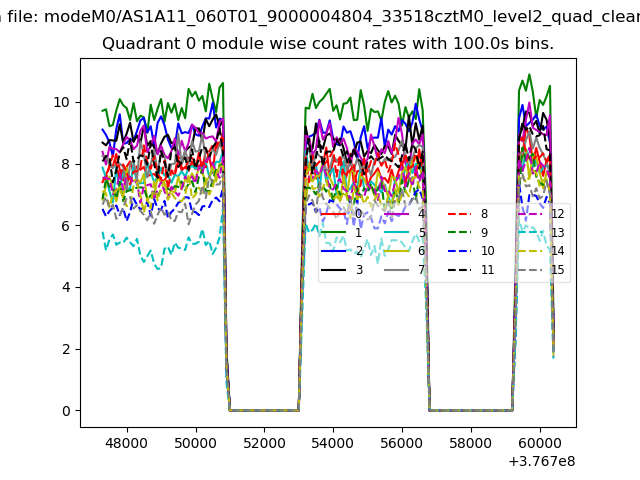 |
 |
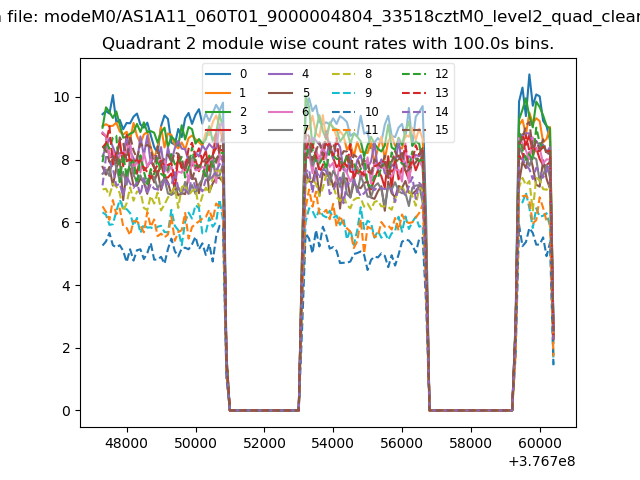
| Module-wise count rates for Quadrant B Data is divided into 100 sec bins |
 |
 |
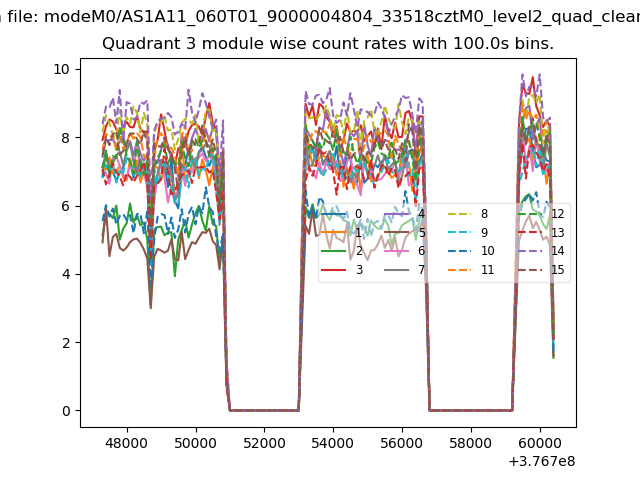
| Module-wise count rates for Quadrant C Data is divided into 100 sec bins |
 |
 |
| Module-wise count rates for Quadrant D Data is divided into 100 sec bins |
 |
 |
| Parameter | Plot |
|---|---|
| CZT HV Monitor | 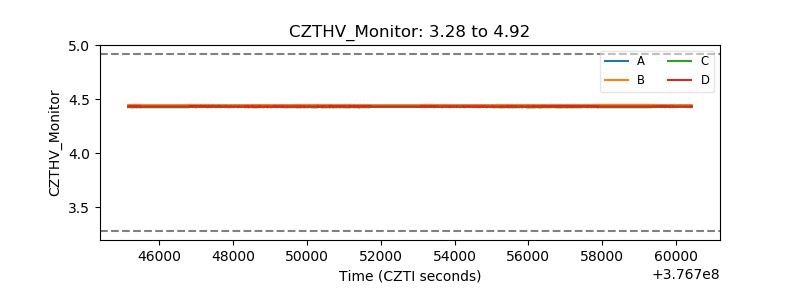 |
| D_VDD | 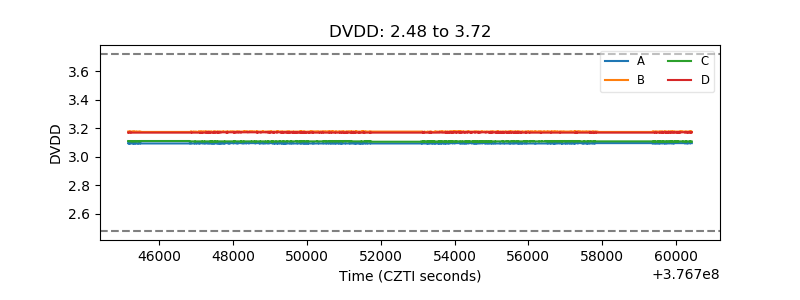 |
| Temperature 1 | 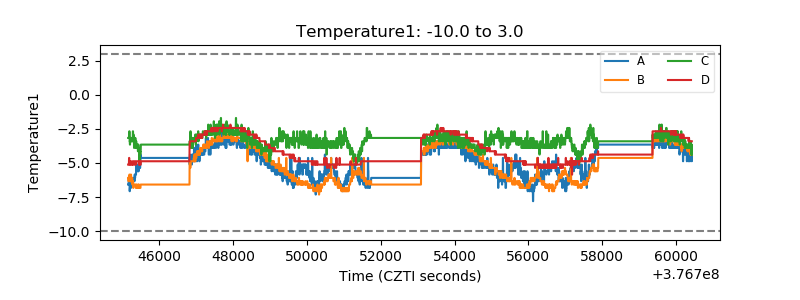 |
| Veto HV Monitor | 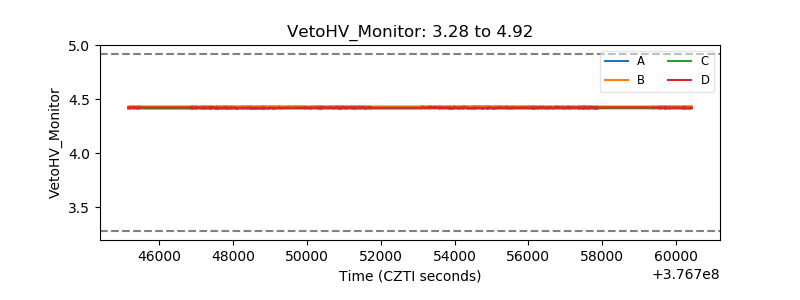 |
| Veto LLD | 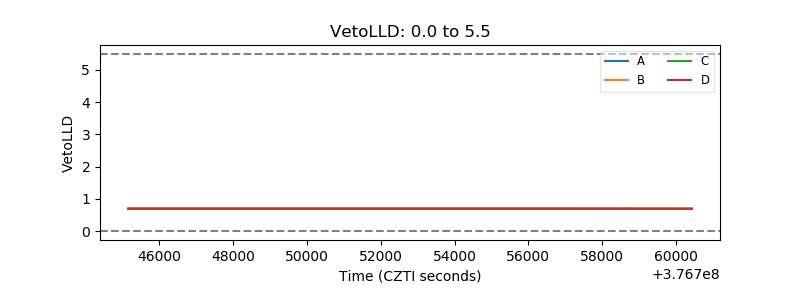 |
| Alpha Counter | 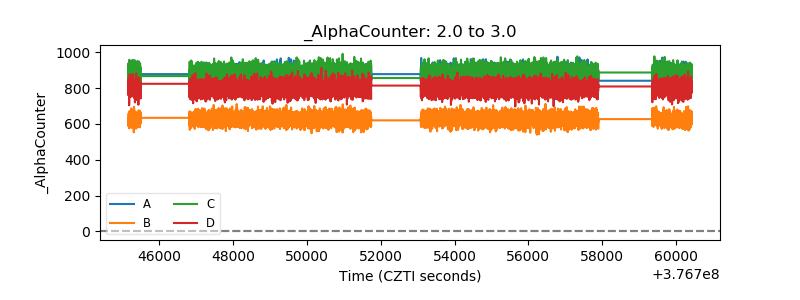 |
| _CPM_Rate | 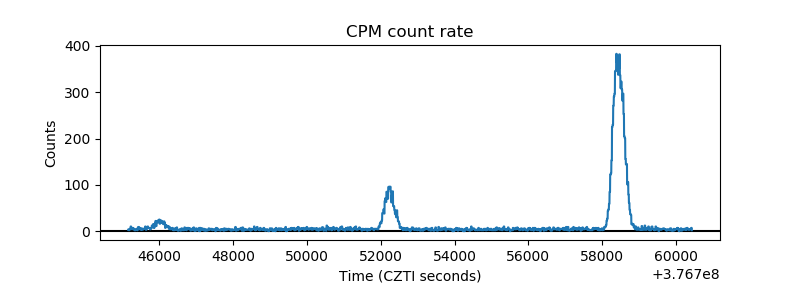 |
| CZT Counter | 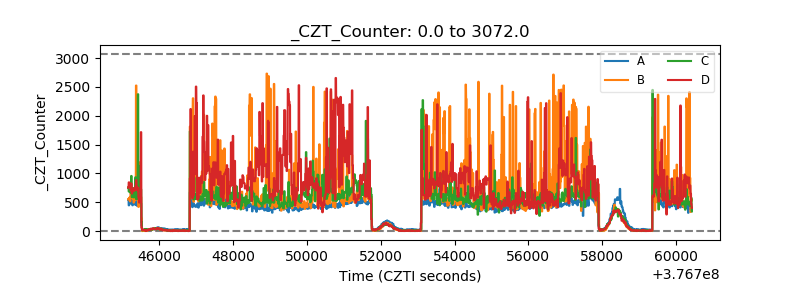 |
| +2.5 Volts monitor |  |
| +5 Volts monitor |  |
| _ROLL_ROT | 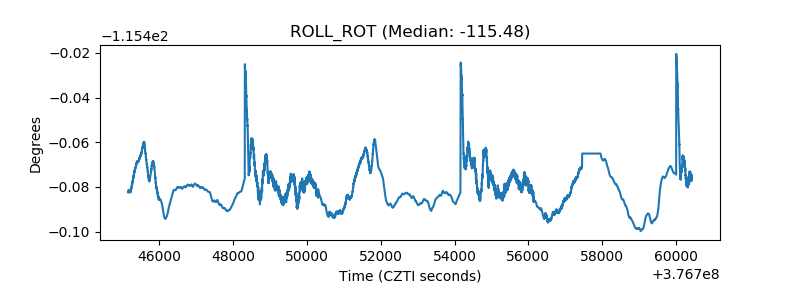 |
| _Roll_DEC | 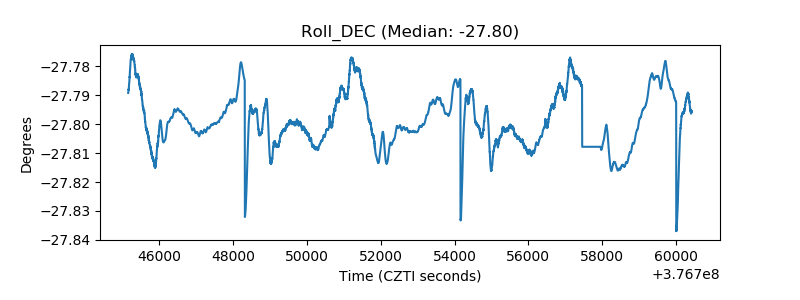 |
| _Roll_RA |  |
| Veto Counter | 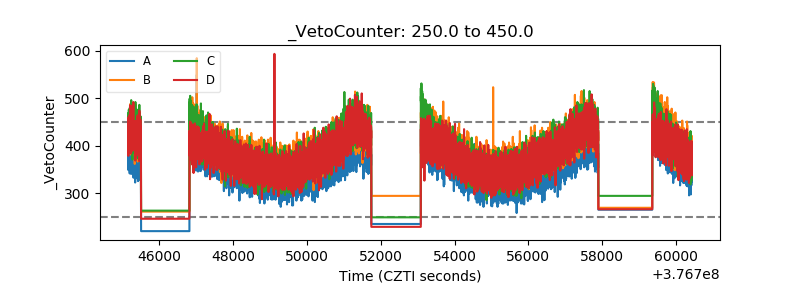 |