| Param | Original file | Final file |
|---|---|---|
| Filename | modeM0/AS1A11_060T01_9000004804_33519cztM0_level2.evt | modeM0/AS1A11_060T01_9000004804_33519cztM0_level2_quad_clean.evt |
| Size (bytes) | 501,621,120 | 81,213,120 |
| Size | 478.4 MB | 77.5 MB |
| Events in quadrant A | 2,591,354 | 537,731 |
| Events in quadrant B | 4,458,732 | 515,659 |
| Events in quadrant C | 3,455,800 | 514,230 |
| Events in quadrant D | 4,302,384 | 496,041 |
| Mode M9 | |||
|---|---|---|---|
| Quadrant | BADHDUFLAG | Total packets | Discarded packets |
| A | 0 | 17 | 0 |
| B | 0 | 17 | 0 |
| C | 0 | 17 | 0 |
| D | 0 | 18 | 0 |
| Mode M0 | |||
|---|---|---|---|
| Quadrant | BADHDUFLAG | Total packets | Discarded packets |
| A | 0 | 11434 | 2 |
| B | 0 | 17095 | 1 |
| C | 0 | 13993 | 1 |
| D | 0 | 16595 | 1 |
| Mode SS | |||
|---|---|---|---|
| Quadrant | BADHDUFLAG | Total packets | Discarded packets |
| A | 0 | 114 | 0 |
| B | 0 | 114 | 0 |
| C | 0 | 114 | 0 |
| D | 0 | 114 | 0 |
| Quadrant | Total seconds | Saturated seconds | Saturation percentage |
|---|---|---|---|
| A | 5658 | 7 | 0.123719% |
| B | 5658 | 489 | 8.642630% |
| C | 5658 | 71 | 1.254860% |
| D | 5658 | 140 | 2.474373% |
Noise dominated data is calculated using 1-second bins in cleaned event files. If a bin has >2000 counts, and if more than 50% of those come from <1% of pixels, then it is considered to be noise-dominated and hence unusable.
| Quadrant | # 1 sec bins | Bins with >0 counts | Bins with >2000 counts | High rate bins dominated by noise | Noise dominated (total time) | Noise dominated (detector-on time) | Marked lightcurve |
|---|---|---|---|---|---|---|---|
| A | 7240 | 5659 | 0 | 0 | 0.00% | 0.00% |  |
| B | 7239 | 5658 | 323 | 323 | 4.46% | 5.71% | 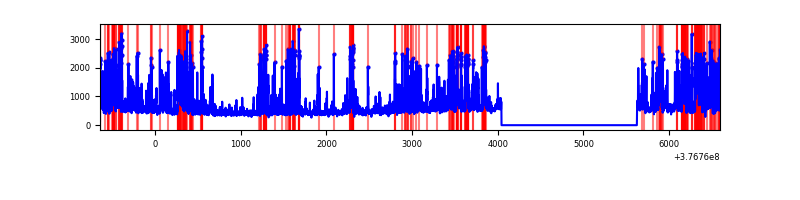 |
| C | 7240 | 5659 | 62 | 62 | 0.86% | 1.10% | 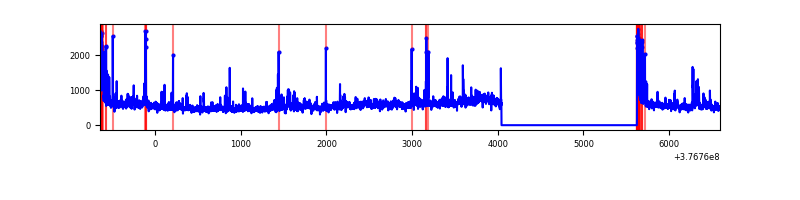 |
| D | 7240 | 5659 | 114 | 114 | 1.57% | 2.01% | 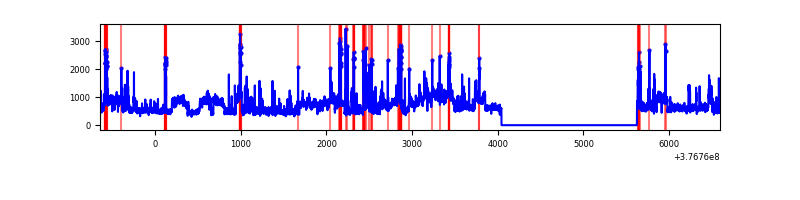 |
Top three noisy pixels from each quadrant. If the there are fewer than three noisy pixels in the level2.evt file, extra rows are filled as -1
| Pixel properties | Quadrant properties | ||||||
|---|---|---|---|---|---|---|---|
| Quadrant | DetID | PixID | Counts | Sigma | Mean | Median | Sigma |
| A | 13 | 254 | 9626 | 66.76 | 668 | 656 | 134.4 |
| A | 3 | 137 | 6764 | 45.46 | 668 | 656 | 134.4 |
| A | 13 | 6 | 6007 | 39.82 | 668 | 656 | 134.4 |
| B | 5 | 255 | 1320501 | 10542.49 | 646 | 629 | 125.2 |
| B | 5 | 172 | 568999 | 4539.86 | 646 | 629 | 125.2 |
| B | 12 | 111 | 15448 | 118.37 | 646 | 629 | 125.2 |
| C | 3 | 233 | 308508 | 2071.73 | 638 | 643 | 148.6 |
| C | 15 | 214 | 263337 | 1767.76 | 638 | 643 | 148.6 |
| C | 0 | 10 | 194398 | 1303.84 | 638 | 643 | 148.6 |
| D | 8 | 195 | 1238299 | 7942.63 | 636 | 619 | 155.8 |
| D | 13 | 249 | 237812 | 1522.15 | 636 | 619 | 155.8 |
| D | 2 | 250 | 200980 | 1285.79 | 636 | 619 | 155.8 |
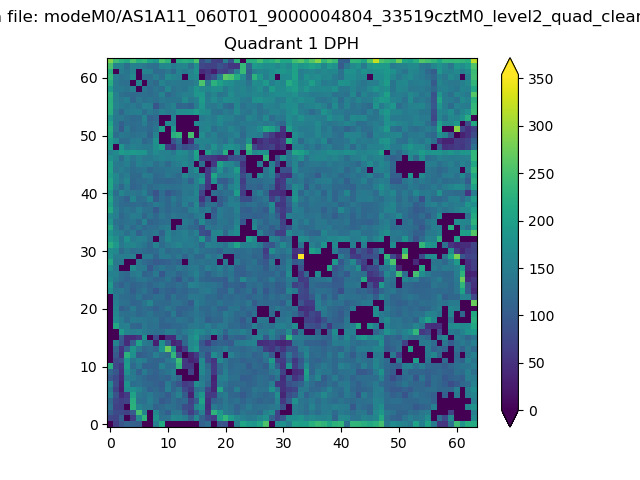
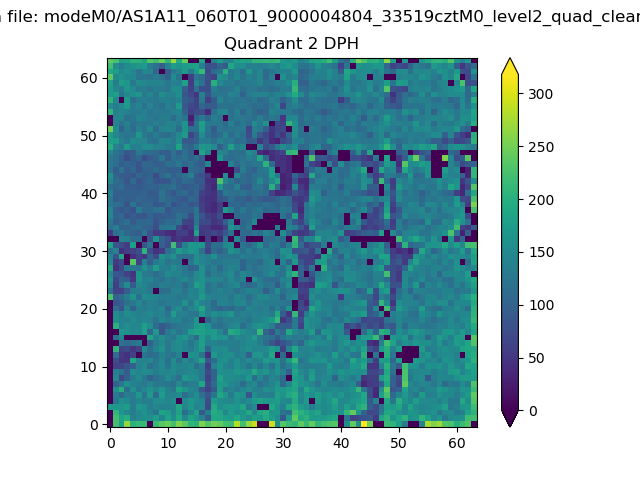
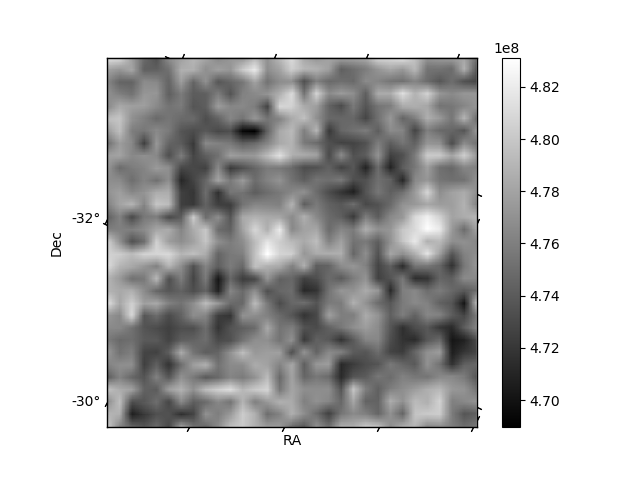
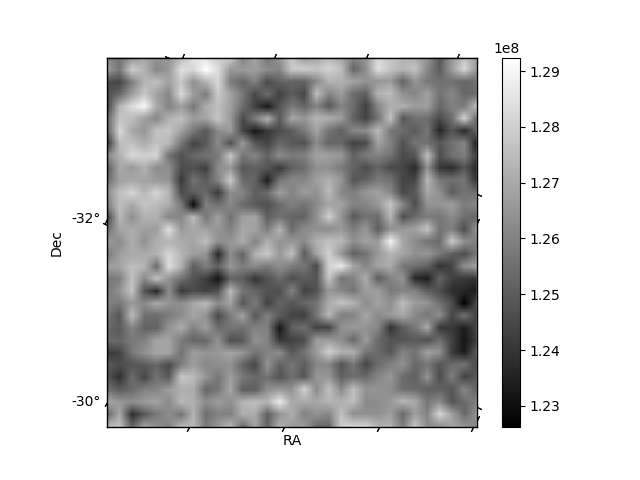
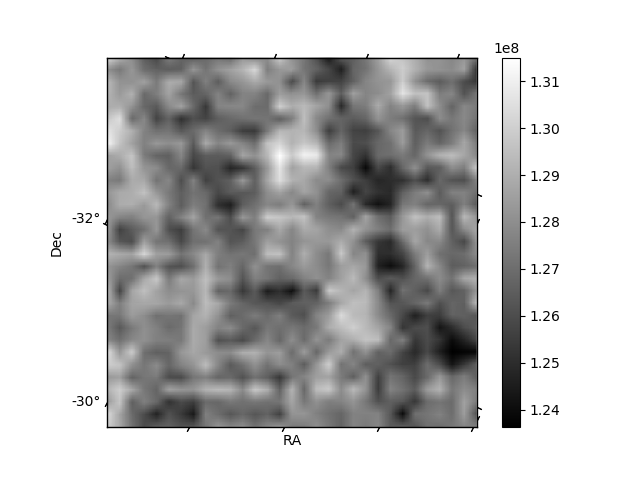
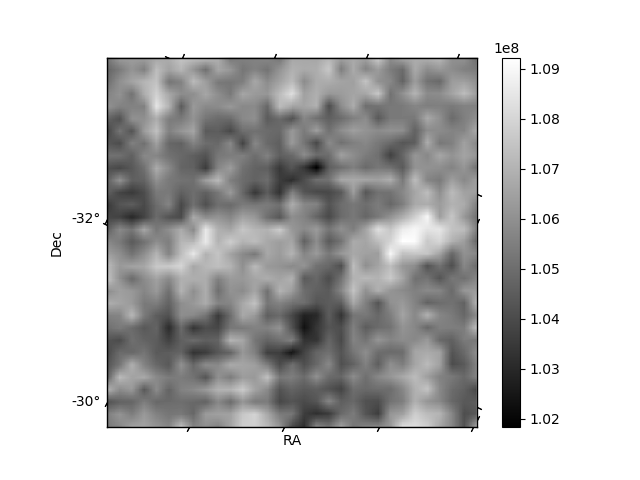
Histogram calculated using DETX and DETY for each event in the final _common_clean file
| Quadrant A | 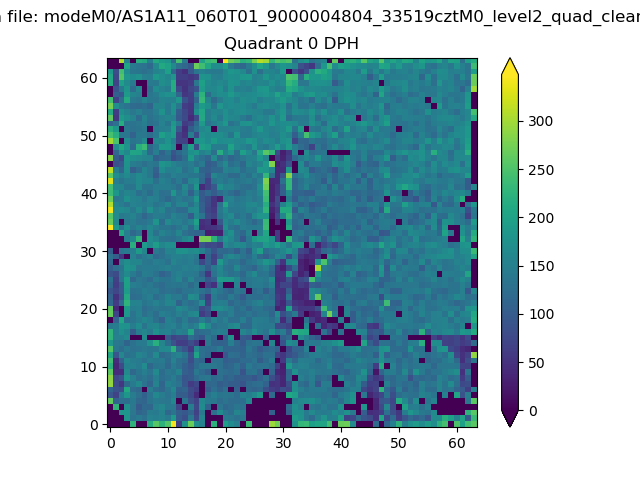 |
 |
Quadrant B |
|---|---|---|---|
| Quadrant D | 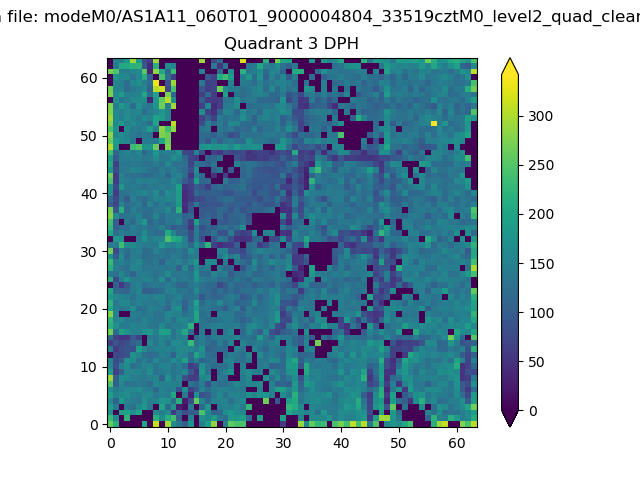 |
 |
Quadrant C |
| Plot type | Count rate plots | Images |
|---|---|---|
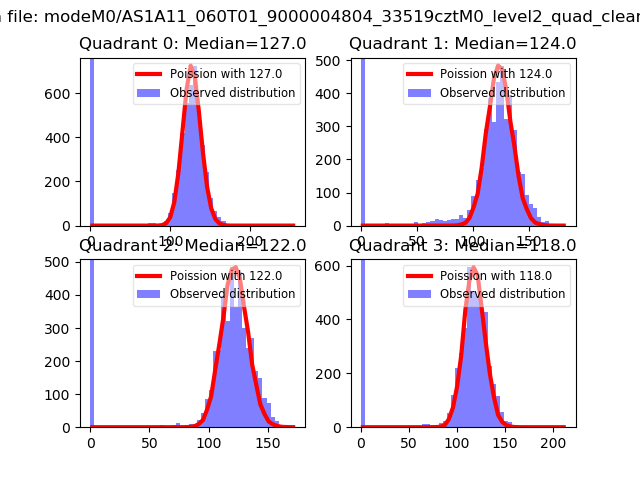
| Comparison with Poisson distribution Blue bars denote a histogram of data divided into 1 sec bins. Red curve is a Poisson curve with rate = median count rate of data. |
 |
 |
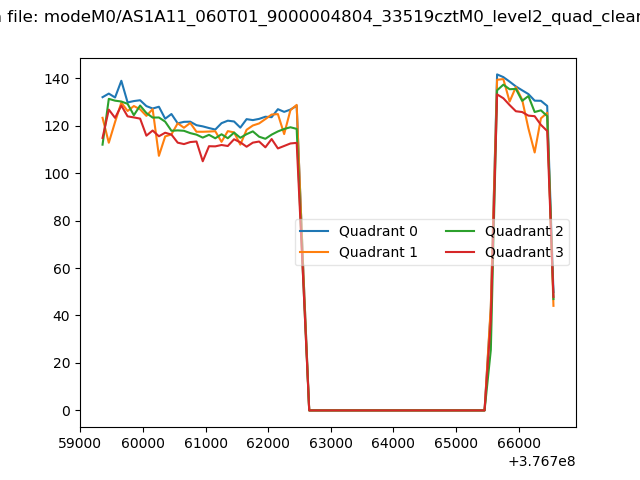
| Quadrant-wise count rates Data is divided into 100 sec bins |
 |
|
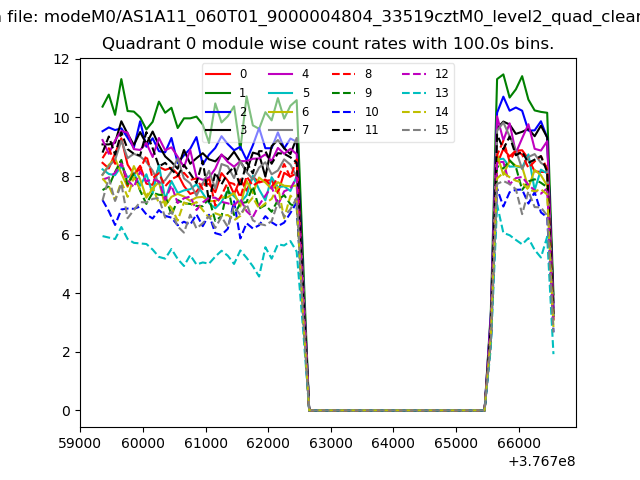
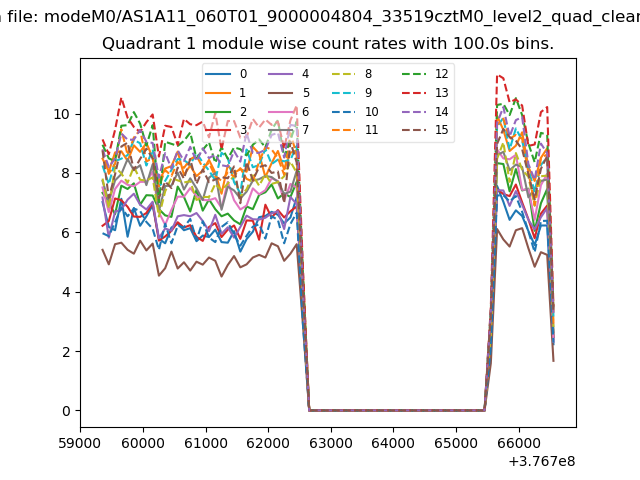
| Module-wise count rates for Quadrant A Data is divided into 100 sec bins |
 |
 |
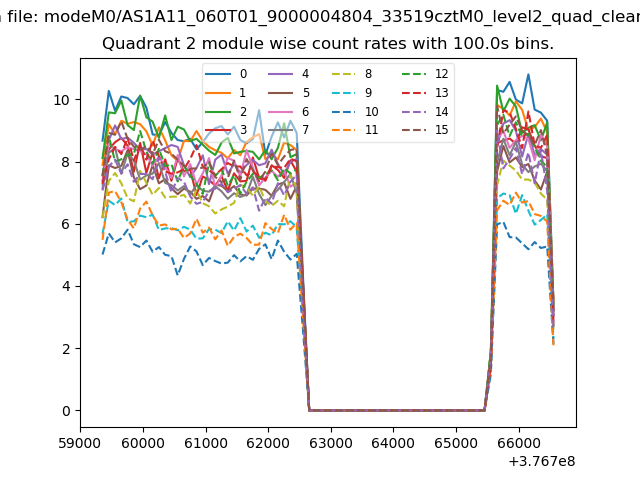
| Module-wise count rates for Quadrant B Data is divided into 100 sec bins |
 |
 |
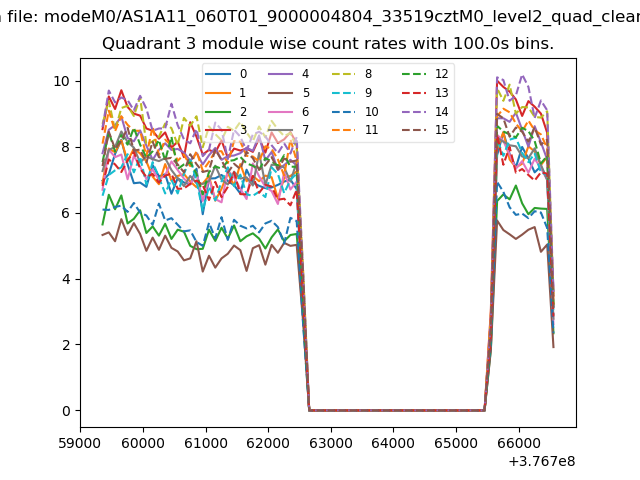
| Module-wise count rates for Quadrant C Data is divided into 100 sec bins |
 |
 |
| Module-wise count rates for Quadrant D Data is divided into 100 sec bins |
 |
 |
| Parameter | Plot |
|---|---|
| CZT HV Monitor | 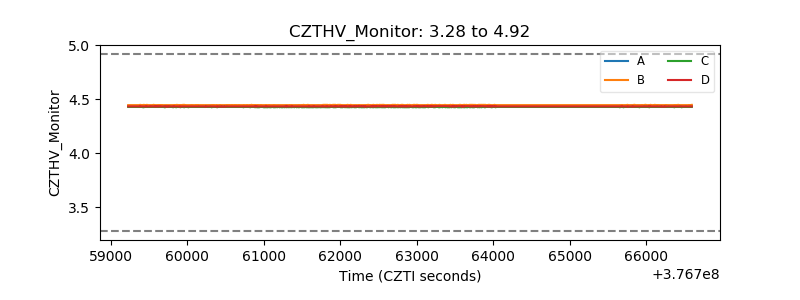 |
| D_VDD |  |
| Temperature 1 | 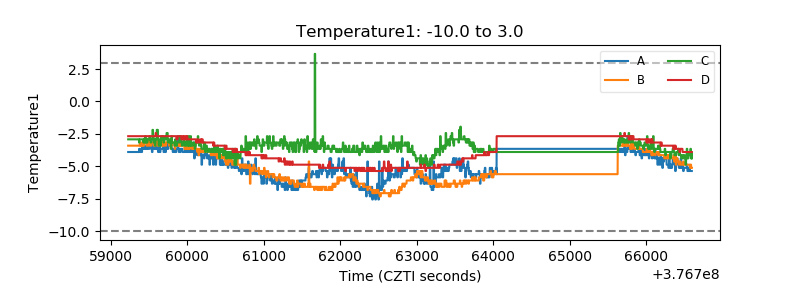 |
| Veto HV Monitor | 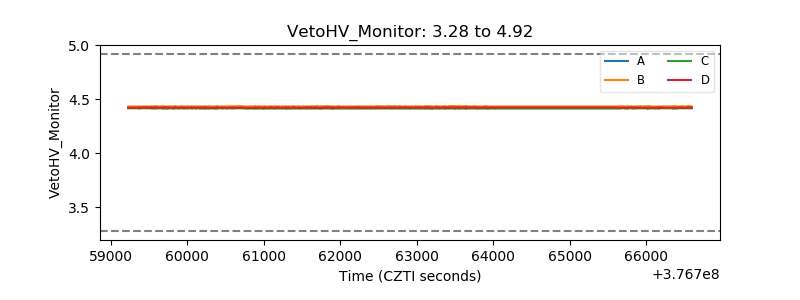 |
| Veto LLD | 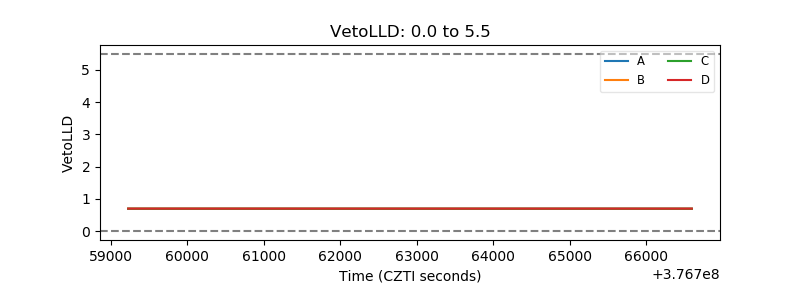 |
| Alpha Counter | 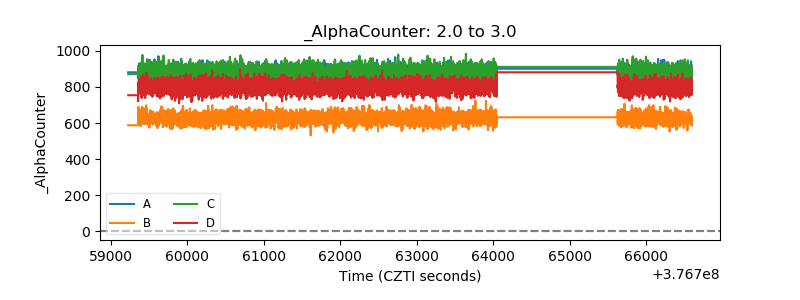 |
| _CPM_Rate | 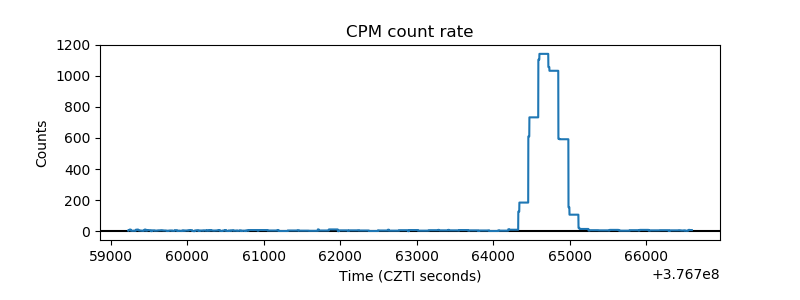 |
| CZT Counter | 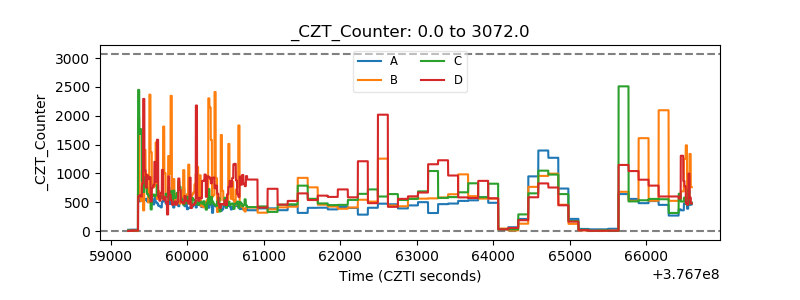 |
| +2.5 Volts monitor |  |
| +5 Volts monitor |  |
| _ROLL_ROT | 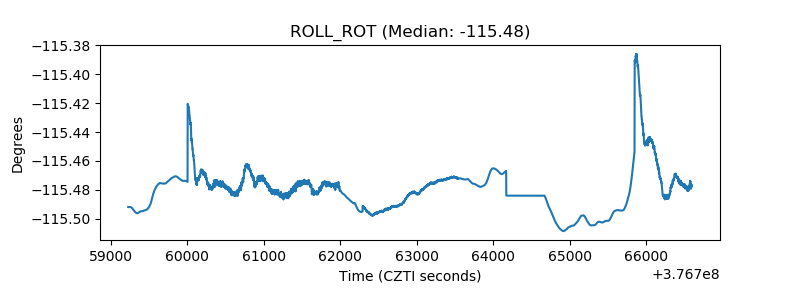 |
| _Roll_DEC | 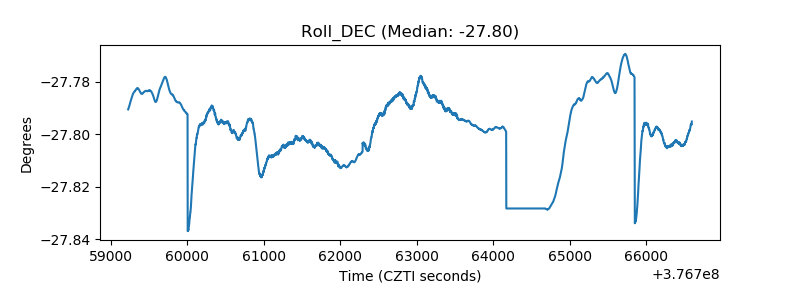 |
| _Roll_RA | 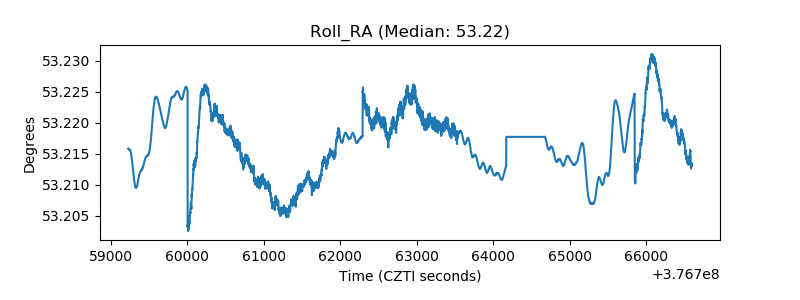 |
| Veto Counter | 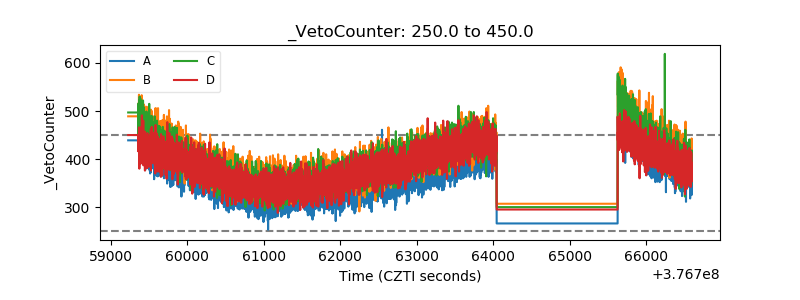 |