| Param | Original file | Final file |
|---|---|---|
| Filename | modeM0/AS1A11_060T01_9000004804_33522cztM0_level2.evt | modeM0/AS1A11_060T01_9000004804_33522cztM0_level2_quad_clean.evt |
| Size (bytes) | 512,559,360 | 68,808,960 |
| Size | 488.8 MB | 65.6 MB |
| Events in quadrant A | 2,487,926 | 454,709 |
| Events in quadrant B | 5,063,019 | 412,441 |
| Events in quadrant C | 3,248,931 | 433,036 |
| Events in quadrant D | 4,363,788 | 411,700 |
| Mode M9 | |||
|---|---|---|---|
| Quadrant | BADHDUFLAG | Total packets | Discarded packets |
| A | 0 | 23 | 0 |
| B | 0 | 23 | 0 |
| C | 0 | 23 | 0 |
| D | 0 | 24 | 0 |
| Mode M0 | |||
|---|---|---|---|
| Quadrant | BADHDUFLAG | Total packets | Discarded packets |
| A | 0 | 10737 | 3 |
| B | 0 | 18601 | 2 |
| C | 0 | 13082 | 2 |
| D | 0 | 16582 | 2 |
| Mode SS | |||
|---|---|---|---|
| Quadrant | BADHDUFLAG | Total packets | Discarded packets |
| A | 0 | 108 | 0 |
| B | 0 | 108 | 0 |
| C | 0 | 108 | 0 |
| D | 0 | 108 | 0 |
| Quadrant | Total seconds | Saturated seconds | Saturation percentage |
|---|---|---|---|
| A | 5303 | 6 | 0.113144% |
| B | 5303 | 891 | 16.801810% |
| C | 5303 | 96 | 1.810296% |
| D | 5303 | 114 | 2.149727% |
Noise dominated data is calculated using 1-second bins in cleaned event files. If a bin has >2000 counts, and if more than 50% of those come from <1% of pixels, then it is considered to be noise-dominated and hence unusable.
| Quadrant | # 1 sec bins | Bins with >0 counts | Bins with >2000 counts | High rate bins dominated by noise | Noise dominated (total time) | Noise dominated (detector-on time) | Marked lightcurve |
|---|---|---|---|---|---|---|---|
| A | 7126 | 5304 | 1 | 1 | 0.01% | 0.02% | 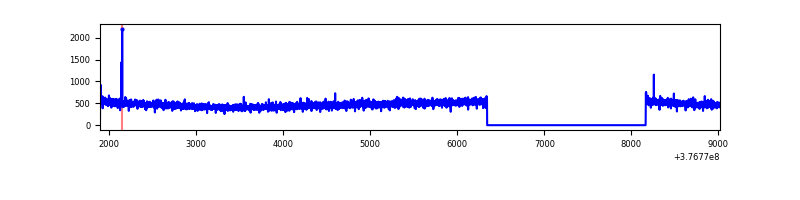 |
| B | 7126 | 5304 | 587 | 587 | 8.24% | 11.07% | 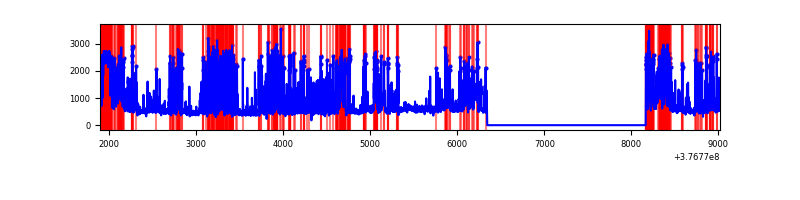 |
| C | 7126 | 5304 | 84 | 84 | 1.18% | 1.58% | 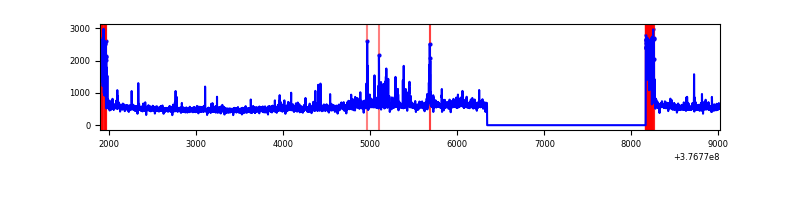 |
| D | 7126 | 5304 | 114 | 114 | 1.60% | 2.15% | 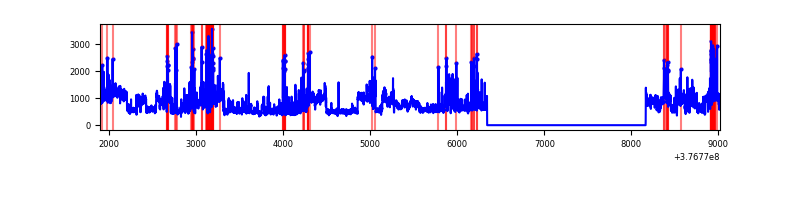 |
Top three noisy pixels from each quadrant. If the there are fewer than three noisy pixels in the level2.evt file, extra rows are filled as -1
| Pixel properties | Quadrant properties | ||||||
|---|---|---|---|---|---|---|---|
| Quadrant | DetID | PixID | Counts | Sigma | Mean | Median | Sigma |
| A | 13 | 254 | 8737 | 63.55 | 640 | 629 | 127.6 |
| A | 9 | 143 | 6486 | 45.91 | 640 | 629 | 127.6 |
| A | 3 | 137 | 6302 | 44.47 | 640 | 629 | 127.6 |
| B | 5 | 255 | 1902273 | 16617.44 | 600 | 585 | 114.4 |
| B | 5 | 172 | 749466 | 6543.91 | 600 | 585 | 114.4 |
| B | 4 | 170 | 15259 | 128.23 | 600 | 585 | 114.4 |
| C | 0 | 10 | 275203 | 1911.91 | 618 | 624 | 143.6 |
| C | 15 | 214 | 246771 | 1713.94 | 618 | 624 | 143.6 |
| C | 3 | 233 | 163995 | 1137.56 | 618 | 624 | 143.6 |
| D | 8 | 195 | 1245002 | 8387.46 | 613 | 596 | 148.4 |
| D | 2 | 250 | 280207 | 1884.62 | 613 | 596 | 148.4 |
| D | 12 | 6 | 171788 | 1153.86 | 613 | 596 | 148.4 |
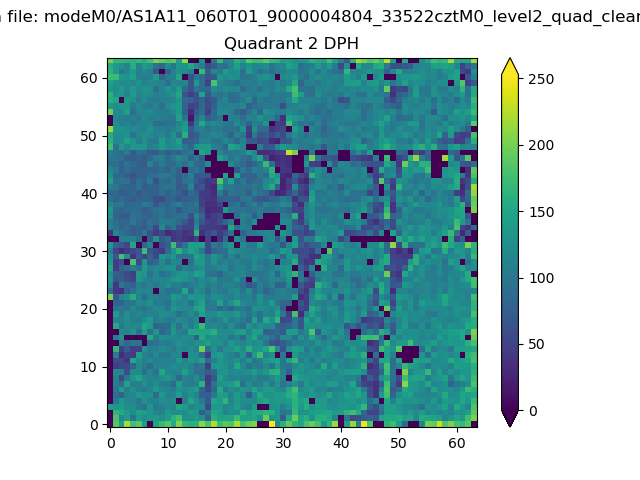
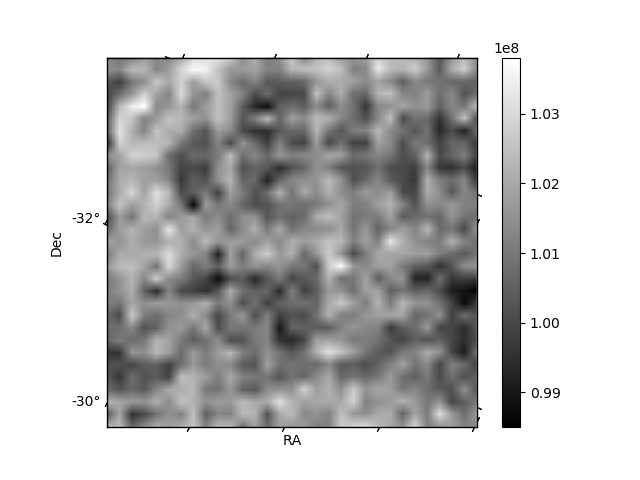
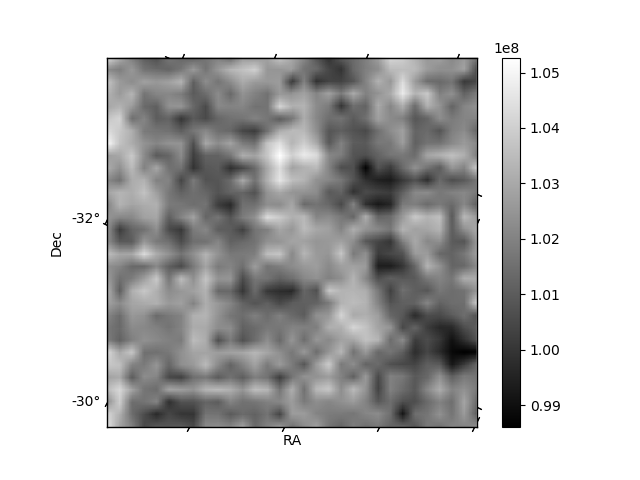
Histogram calculated using DETX and DETY for each event in the final _common_clean file
| Quadrant A | 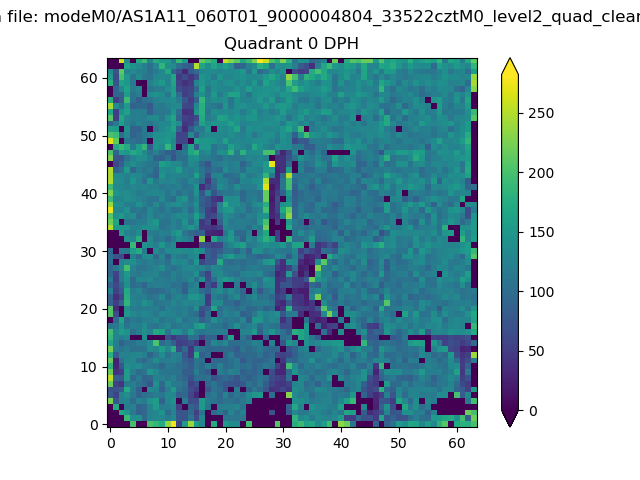 |
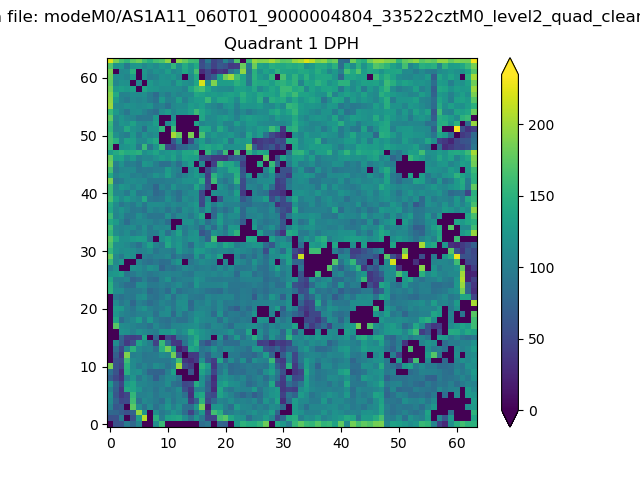 |
Quadrant B |
|---|---|---|---|
| Quadrant D | 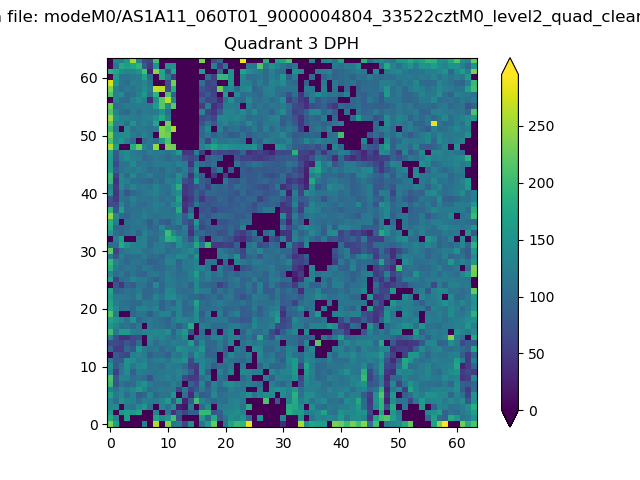 |
 |
Quadrant C |
| Plot type | Count rate plots | Images |
|---|---|---|
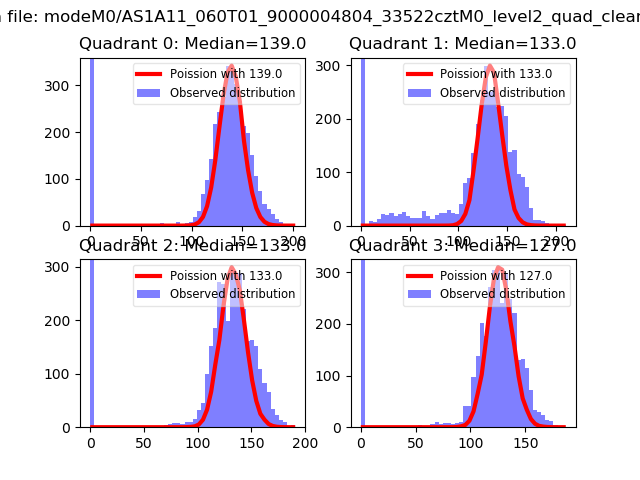
| Comparison with Poisson distribution Blue bars denote a histogram of data divided into 1 sec bins. Red curve is a Poisson curve with rate = median count rate of data. |
 |
 |
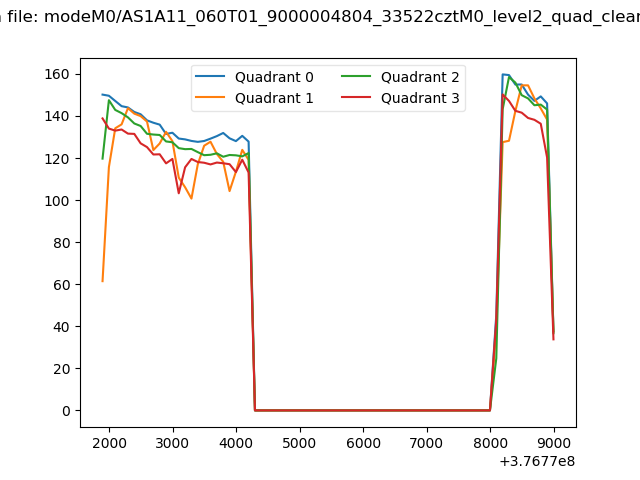
| Quadrant-wise count rates Data is divided into 100 sec bins |
 |
|
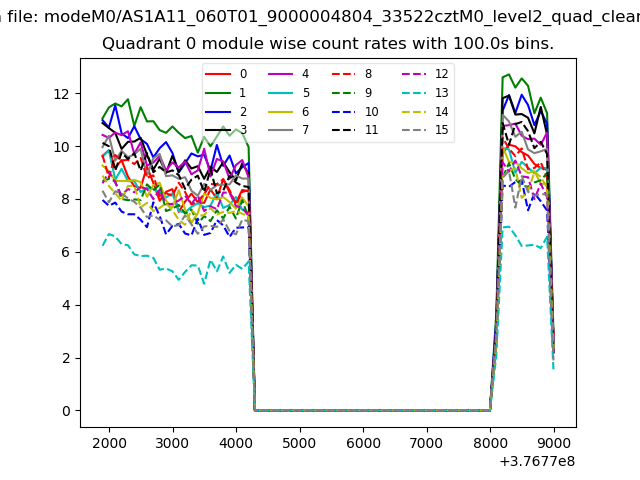
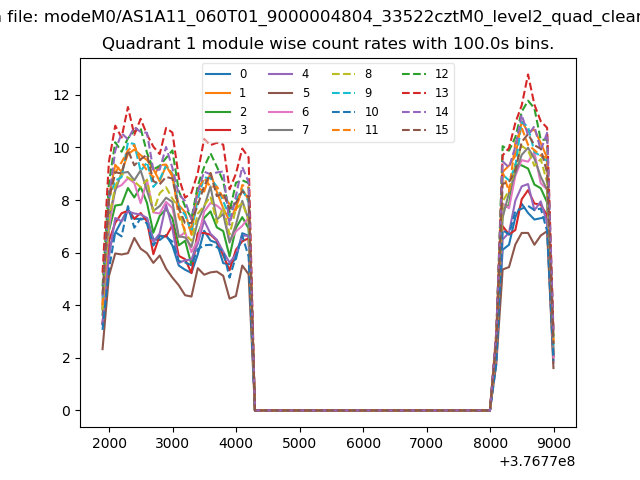
| Module-wise count rates for Quadrant A Data is divided into 100 sec bins |
 |
 |
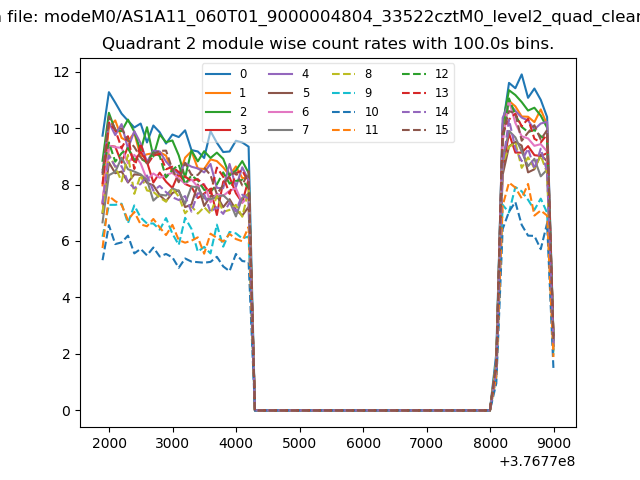
| Module-wise count rates for Quadrant B Data is divided into 100 sec bins |
 |
 |
| Module-wise count rates for Quadrant C Data is divided into 100 sec bins |
 |
 |
| Module-wise count rates for Quadrant D Data is divided into 100 sec bins |
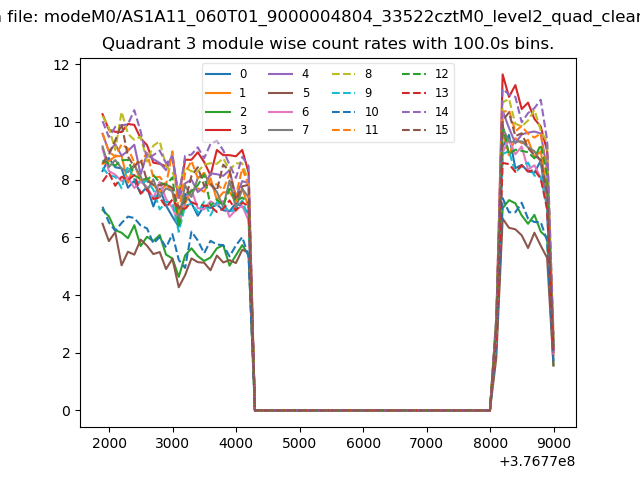 |
 |
| Parameter | Plot |
|---|---|
| CZT HV Monitor | 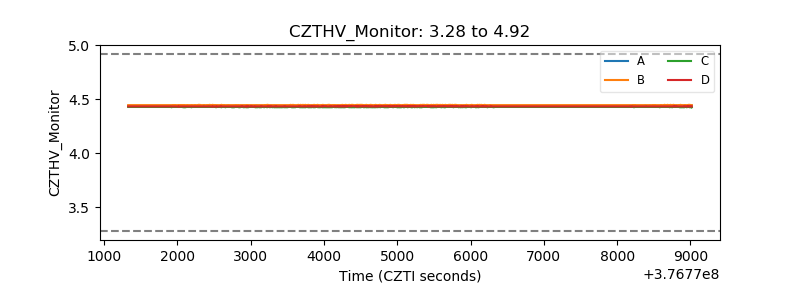 |
| D_VDD | 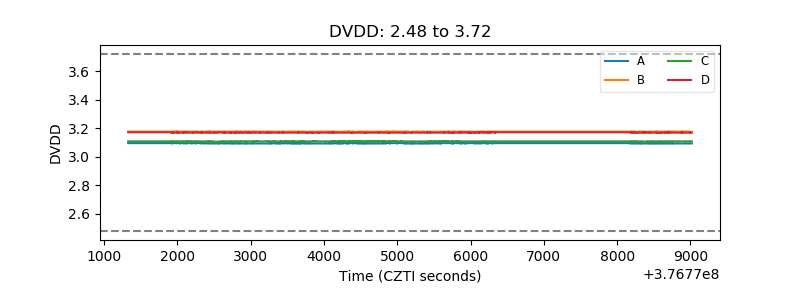 |
| Temperature 1 | 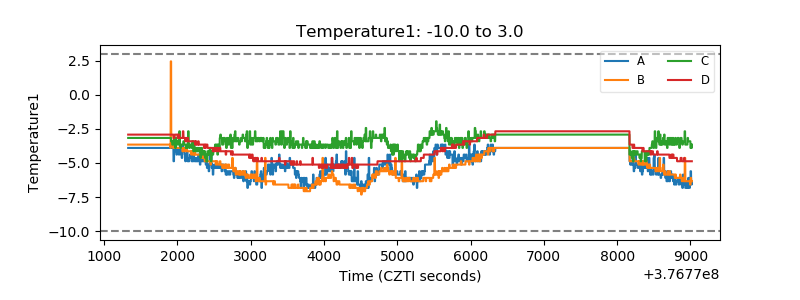 |
| Veto HV Monitor |  |
| Veto LLD | 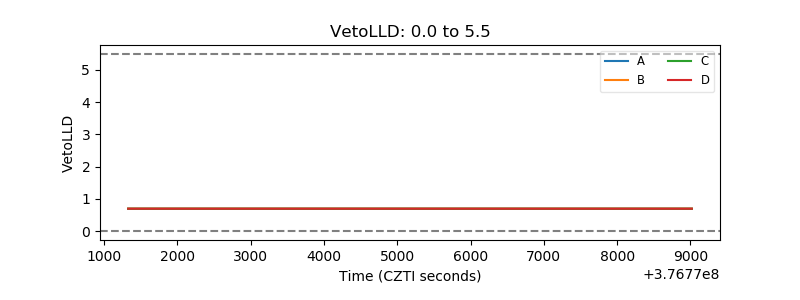 |
| Alpha Counter | 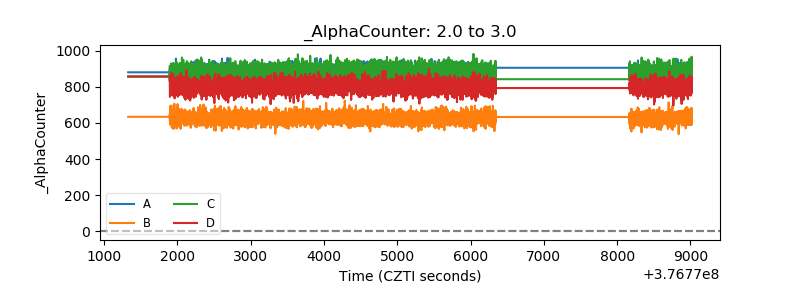 |
| _CPM_Rate | 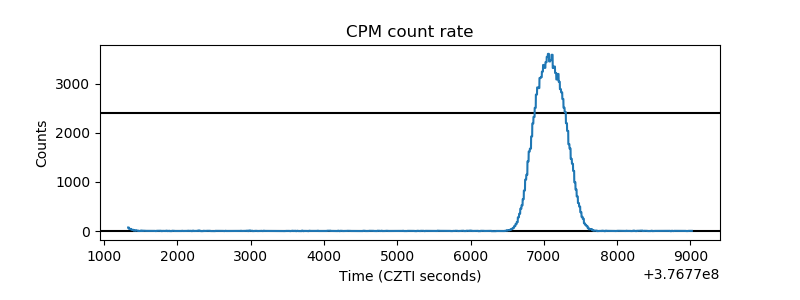 |
| CZT Counter | 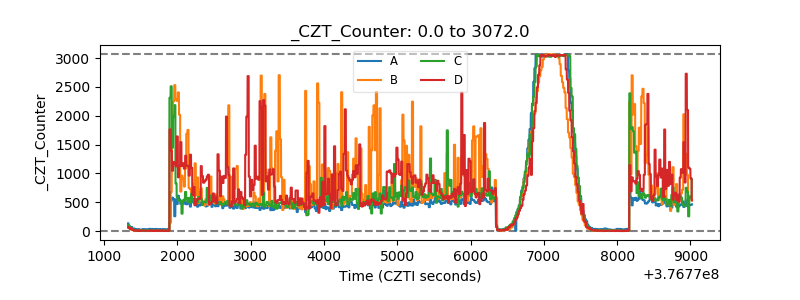 |
| +2.5 Volts monitor |  |
| +5 Volts monitor |  |
| _ROLL_ROT | 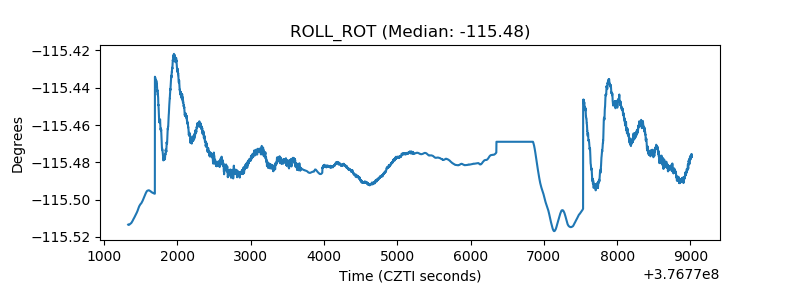 |
| _Roll_DEC | 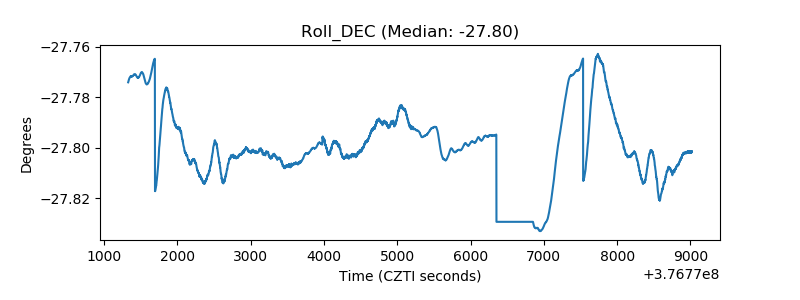 |
| _Roll_RA | 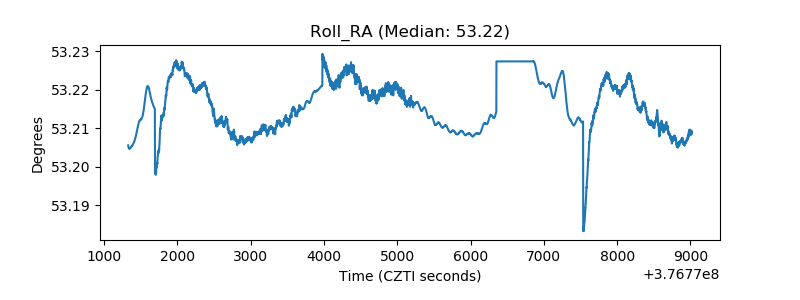 |
| Veto Counter | 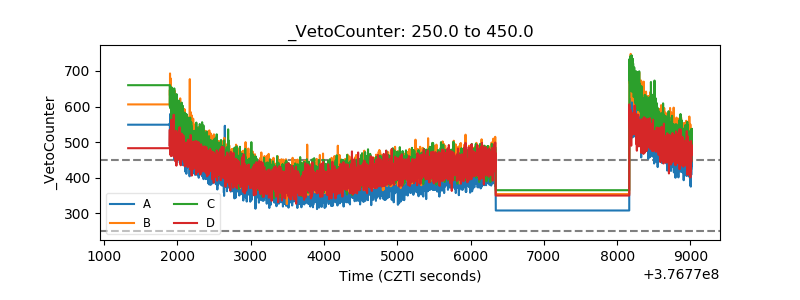 |