| Param | Original file | Final file |
|---|---|---|
| Filename | modeM0/AS1A11_037T01_9000004806cztM0_level2.fits | modeM0/AS1A11_037T01_9000004806cztM0_level2_quad_clean.evt |
| Size (bytes) | 241,752,960 | 282,625,920 |
| Size | 230.6 MB | 269.5 MB |
| Events in quadrant A | 1,491,940 | 1,833,774 |
| Events in quadrant B | 1,403,638 | 1,800,060 |
| Events in quadrant C | 1,468,590 | 1,747,626 |
| Events in quadrant D | 1,202,066 | 1,423,508 |
| Mode M9 | |||
|---|---|---|---|
| Quadrant | BADHDUFLAG | Total packets | Discarded packets |
| A | 0 | 107 | 0 |
| B | 0 | 107 | 0 |
| C | 0 | 107 | 0 |
| D | 0 | 108 | 0 |
| Mode M0 | |||
|---|---|---|---|
| Quadrant | BADHDUFLAG | Total packets | Discarded packets |
| A | 0 | 51351 | 0 |
| B | 0 | 71137 | 0 |
| C | 0 | 62809 | 0 |
| D | 0 | 99858 | 0 |
| Mode SS | |||
|---|---|---|---|
| Quadrant | BADHDUFLAG | Total packets | Discarded packets |
| A | 0 | 520 | 0 |
| B | 0 | 520 | 0 |
| C | 0 | 520 | 0 |
| D | 0 | 520 | 0 |
| Quadrant | Total seconds | Saturated seconds | Saturation percentage |
|---|---|---|---|
| A | 25498 | 24 | 0.094125% |
| B | 25498 | 1275 | 5.000392% |
| C | 25498 | 550 | 2.157032% |
| D | 25498 | 2752 | 10.793003% |
Noise dominated data is calculated using 1-second bins in cleaned event files. If a bin has >2000 counts, and if more than 50% of those come from <1% of pixels, then it is considered to be noise-dominated and hence unusable.
| Quadrant | # 1 sec bins | Bins with >0 counts | Bins with >2000 counts | High rate bins dominated by noise | Noise dominated (total time) | Noise dominated (detector-on time) | Marked lightcurve |
|---|---|---|---|---|---|---|---|
| A | 34825 | 25496 | 0 | 0 | 0.00% | 0.00% |  |
| B | 34825 | 25487 | 0 | 0 | 0.00% | 0.00% |  |
| C | 34825 | 25486 | 0 | 0 | 0.00% | 0.00% |  |
| D | 34825 | 25472 | 0 | 0 | 0.00% | 0.00% |  |
Top three noisy pixels from each quadrant. If the there are fewer than three noisy pixels in the level2.evt file, extra rows are filled as -1
| Pixel properties | Quadrant properties | ||||||
|---|---|---|---|---|---|---|---|
| Quadrant | DetID | PixID | Counts | Sigma | Mean | Median | Sigma |
| A | 0 | 29 | 1232 | 8.91 | 389 | 368 | 96.9 |
| A | 9 | 19 | 1216 | 8.75 | 389 | 368 | 96.9 |
| A | 7 | 110 | 1203 | 8.61 | 389 | 368 | 96.9 |
| B | 2 | 9 | 1242 | 11.85 | 373 | 357 | 74.7 |
| B | 3 | 80 | 1102 | 9.97 | 373 | 357 | 74.7 |
| B | 2 | 8 | 1040 | 9.14 | 373 | 357 | 74.7 |
| C | 1 | 81 | 1298 | 9.38 | 388 | 368 | 99.2 |
| C | 1 | 80 | 1261 | 9.01 | 388 | 368 | 99.2 |
| C | 3 | 187 | 1045 | 6.83 | 388 | 368 | 99.2 |
| D | 4 | 160 | 952 | 6.77 | 344 | 315 | 94.0 |
| D | 10 | 113 | 934 | 6.58 | 344 | 315 | 94.0 |
| D | 6 | 62 | 906 | 6.29 | 344 | 315 | 94.0 |
Histogram calculated using DETX and DETY for each event in the final _common_clean file
| Quadrant A |  |
 |
Quadrant B |
|---|---|---|---|
| Quadrant D | 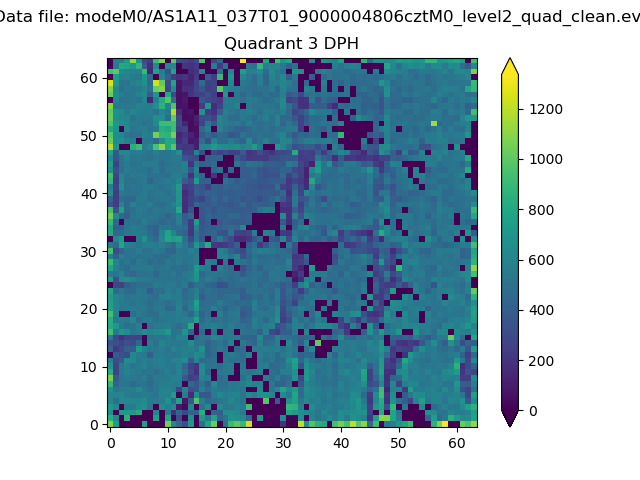 |
 |
Quadrant C |
| Plot type | Count rate plots | Images |
|---|---|---|
| Comparison with Poisson distribution Blue bars denote a histogram of data divided into 1 sec bins. Red curve is a Poisson curve with rate = median count rate of data. |
 |
 |
| Quadrant-wise count rates Data is divided into 100 sec bins |
 |
|
| Module-wise count rates for Quadrant A Data is divided into 100 sec bins |
 |
 |
| Module-wise count rates for Quadrant B Data is divided into 100 sec bins |
 |
 |
| Module-wise count rates for Quadrant C Data is divided into 100 sec bins |
 |
 |
| Module-wise count rates for Quadrant D Data is divided into 100 sec bins |
 |
 |
| Parameter | Plot |
|---|---|
| CZT HV Monitor |  |
| D_VDD |  |
| Temperature 1 |  |
| Veto HV Monitor |  |
| Veto LLD |  |
| Alpha Counter |  |
| _CPM_Rate |  |
| CZT Counter |  |
| +2.5 Volts monitor |  |
| +5 Volts monitor |  |
| _ROLL_ROT |  |
| _Roll_DEC |  |
| _Roll_RA |  |
| Veto Counter |  |