| Param | Original file | Final file |
|---|---|---|
| Filename | modeM0/AS1A11_037T01_9000004806_33525cztM0_level2.evt | modeM0/AS1A11_037T01_9000004806_33525cztM0_level2_quad_clean.evt |
| Size (bytes) | 486,538,560 | 97,392,960 |
| Size | 464.0 MB | 92.9 MB |
| Events in quadrant A | 2,439,767 | 654,408 |
| Events in quadrant B | 3,916,717 | 665,247 |
| Events in quadrant C | 3,396,350 | 655,197 |
| Events in quadrant D | 4,628,495 | 609,100 |
| Mode M9 | |||
|---|---|---|---|
| Quadrant | BADHDUFLAG | Total packets | Discarded packets |
| A | 0 | 34 | 0 |
| B | 0 | 34 | 0 |
| C | 0 | 34 | 0 |
| D | 0 | 35 | 0 |
| Mode M0 | |||
|---|---|---|---|
| Quadrant | BADHDUFLAG | Total packets | Discarded packets |
| A | 0 | 10526 | 3 |
| B | 0 | 15001 | 2 |
| C | 0 | 13340 | 2 |
| D | 0 | 17448 | 2 |
| Mode SS | |||
|---|---|---|---|
| Quadrant | BADHDUFLAG | Total packets | Discarded packets |
| A | 0 | 108 | 0 |
| B | 0 | 108 | 0 |
| C | 0 | 108 | 0 |
| D | 0 | 108 | 0 |
| Quadrant | Total seconds | Saturated seconds | Saturation percentage |
|---|---|---|---|
| A | 5212 | 5 | 0.095932% |
| B | 5212 | 319 | 6.120491% |
| C | 5212 | 118 | 2.264006% |
| D | 5212 | 157 | 3.012279% |
Noise dominated data is calculated using 1-second bins in cleaned event files. If a bin has >2000 counts, and if more than 50% of those come from <1% of pixels, then it is considered to be noise-dominated and hence unusable.
| Quadrant | # 1 sec bins | Bins with >0 counts | Bins with >2000 counts | High rate bins dominated by noise | Noise dominated (total time) | Noise dominated (detector-on time) | Marked lightcurve |
|---|---|---|---|---|---|---|---|
| A | 7336 | 5213 | 0 | 0 | 0.00% | 0.00% | 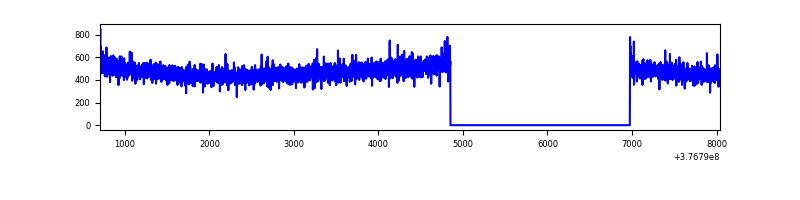 |
| B | 7336 | 5213 | 230 | 230 | 3.14% | 4.41% | 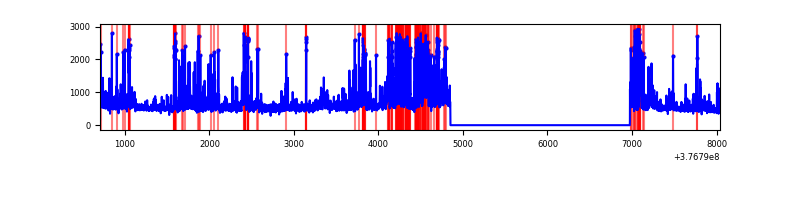 |
| C | 7336 | 5213 | 102 | 102 | 1.39% | 1.96% |  |
| D | 7336 | 5213 | 149 | 149 | 2.03% | 2.86% | 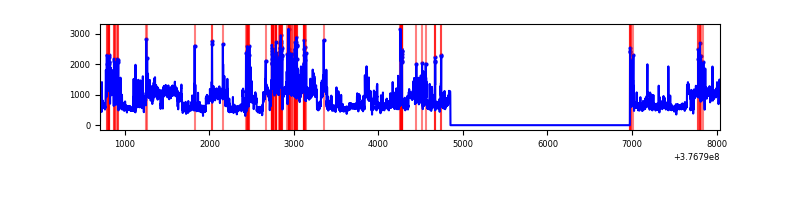 |
Top three noisy pixels from each quadrant. If the there are fewer than three noisy pixels in the level2.evt file, extra rows are filled as -1
| Pixel properties | Quadrant properties | ||||||
|---|---|---|---|---|---|---|---|
| Quadrant | DetID | PixID | Counts | Sigma | Mean | Median | Sigma |
| A | 13 | 254 | 9655 | 72.8 | 628 | 618 | 124.1 |
| A | 13 | 6 | 5782 | 41.6 | 628 | 618 | 124.1 |
| A | 10 | 83 | 5710 | 41.02 | 628 | 618 | 124.1 |
| B | 5 | 172 | 660611 | 5681.7 | 625 | 610 | 116.2 |
| B | 4 | 170 | 258302 | 2218.37 | 625 | 610 | 116.2 |
| B | 5 | 255 | 220541 | 1893.3 | 625 | 610 | 116.2 |
| C | 15 | 214 | 241305 | 1697.9 | 627 | 633 | 141.7 |
| C | 0 | 10 | 220286 | 1549.61 | 627 | 633 | 141.7 |
| C | 1 | 23 | 142372 | 999.94 | 627 | 633 | 141.7 |
| D | 8 | 195 | 1485555 | 9047.82 | 609 | 598 | 164.1 |
| D | 13 | 249 | 290657 | 1767.32 | 609 | 598 | 164.1 |
| D | 14 | 52 | 207856 | 1262.82 | 609 | 598 | 164.1 |
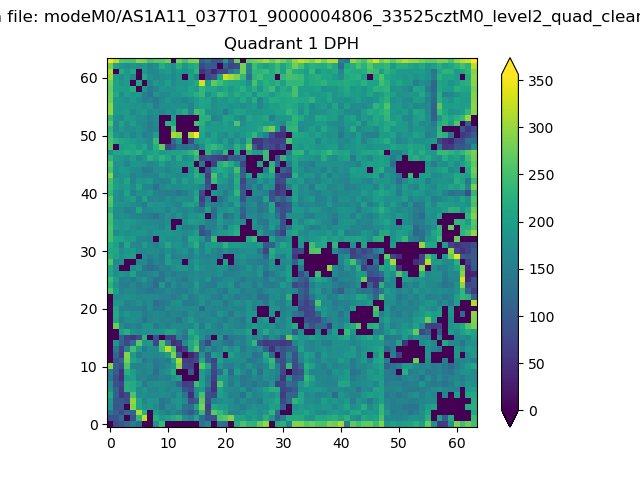
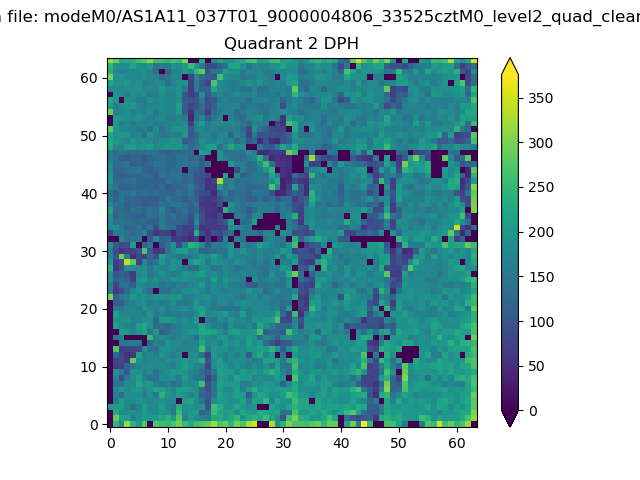
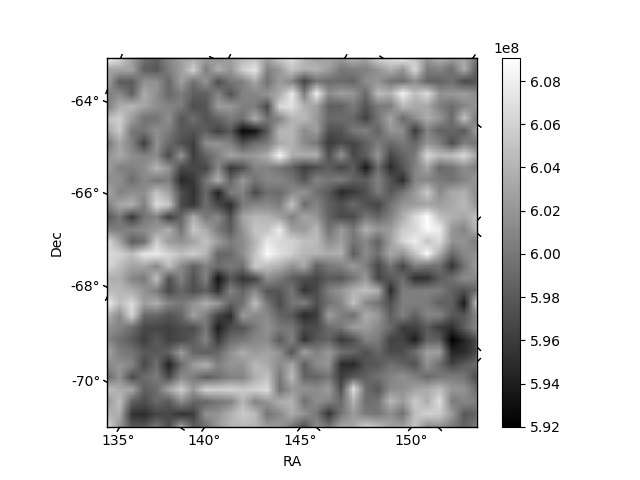
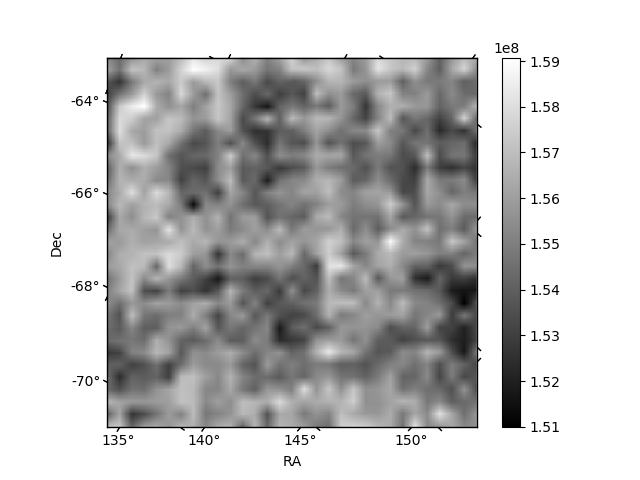
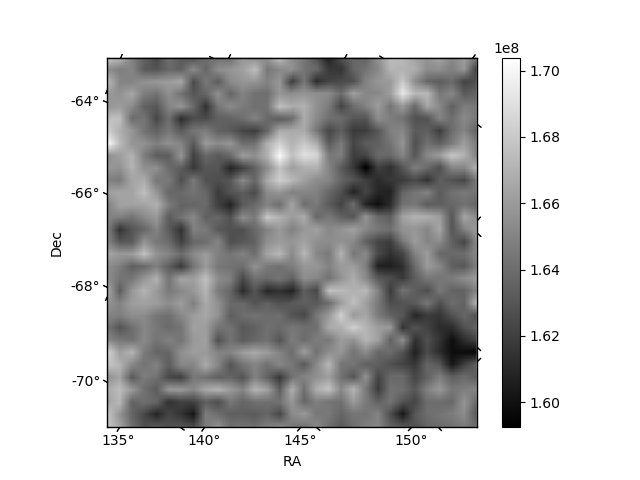
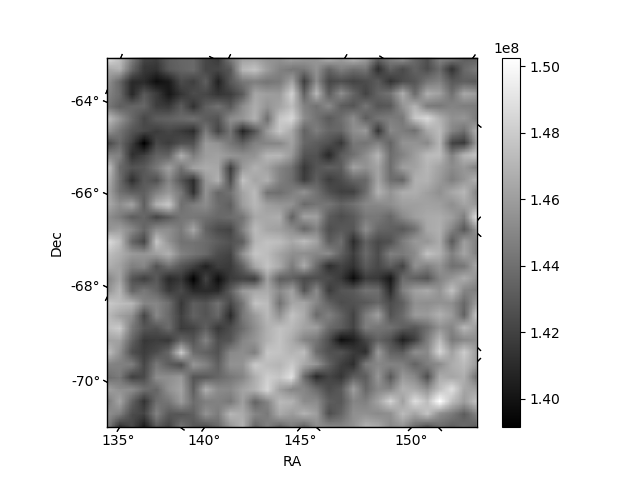
Histogram calculated using DETX and DETY for each event in the final _common_clean file
| Quadrant A | 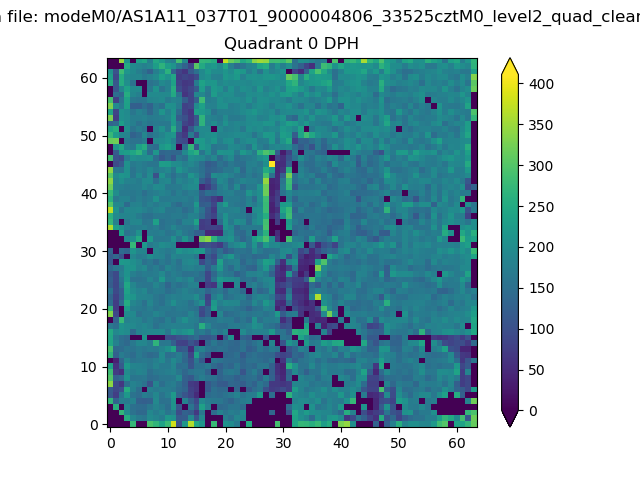 |
 |
Quadrant B |
|---|---|---|---|
| Quadrant D | 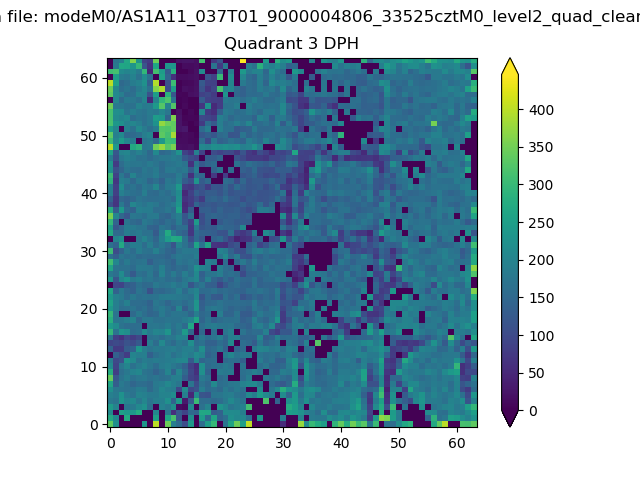 |
 |
Quadrant C |
| Plot type | Count rate plots | Images |
|---|---|---|
| Comparison with Poisson distribution Blue bars denote a histogram of data divided into 1 sec bins. Red curve is a Poisson curve with rate = median count rate of data. |
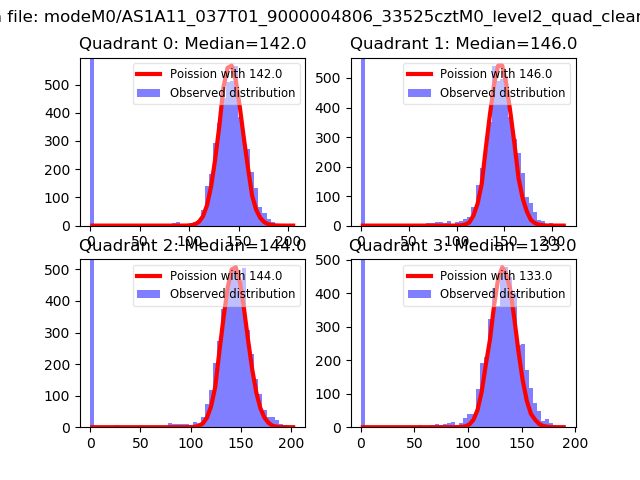 |
 |
| Quadrant-wise count rates Data is divided into 100 sec bins |
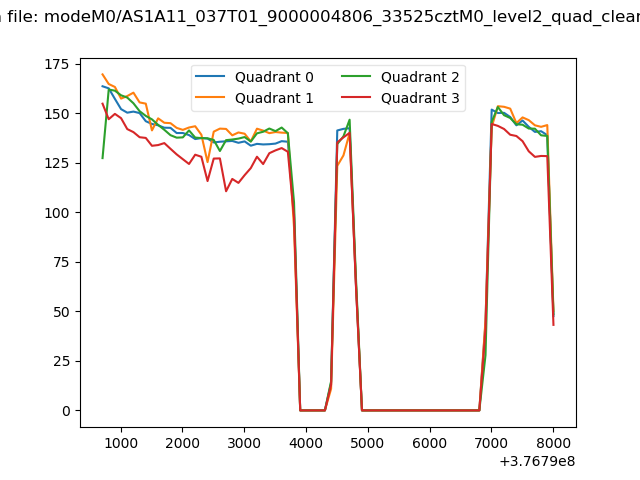 |
|
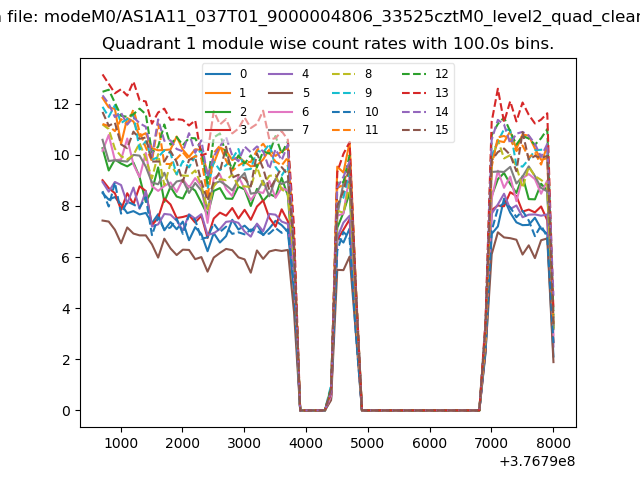
| Module-wise count rates for Quadrant A Data is divided into 100 sec bins |
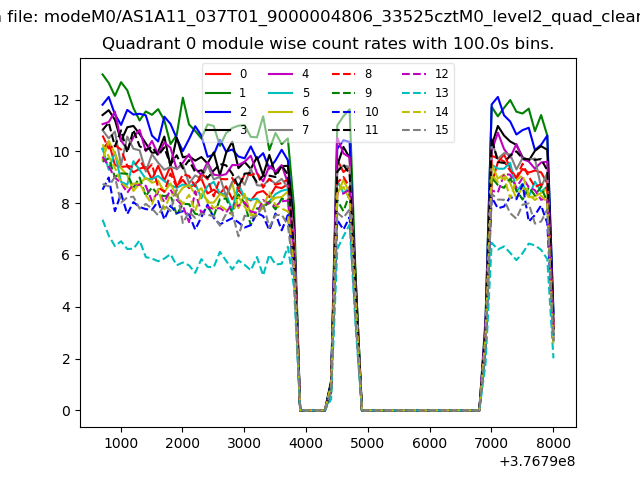 |
 |
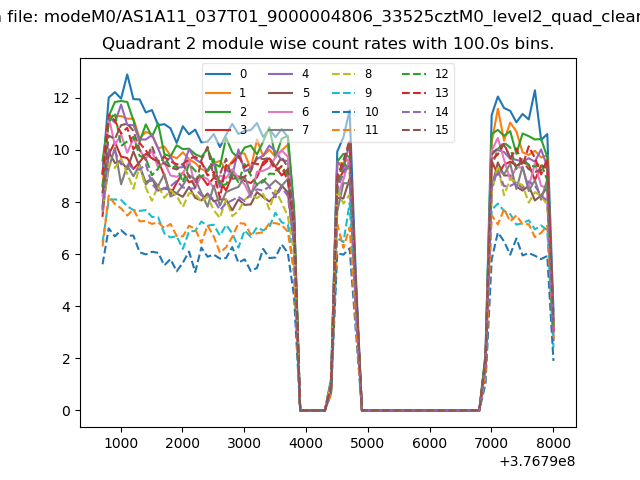
| Module-wise count rates for Quadrant B Data is divided into 100 sec bins |
 |
 |
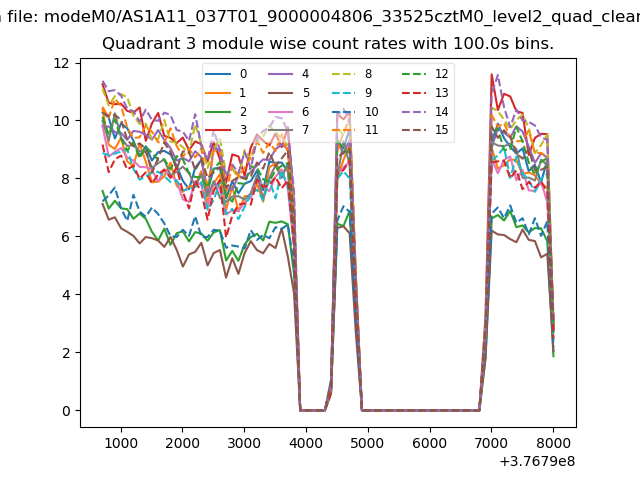
| Module-wise count rates for Quadrant C Data is divided into 100 sec bins |
 |
 |
| Module-wise count rates for Quadrant D Data is divided into 100 sec bins |
 |
 |
| Parameter | Plot |
|---|---|
| CZT HV Monitor | 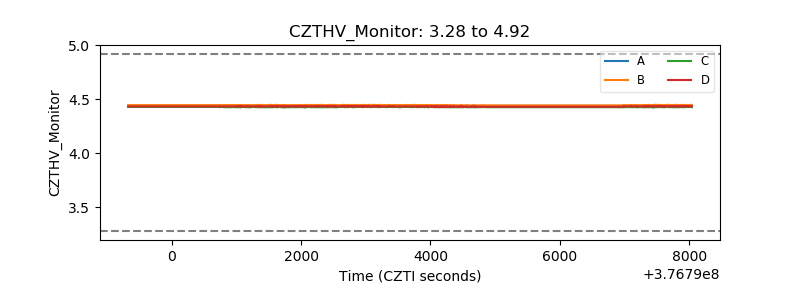 |
| D_VDD | 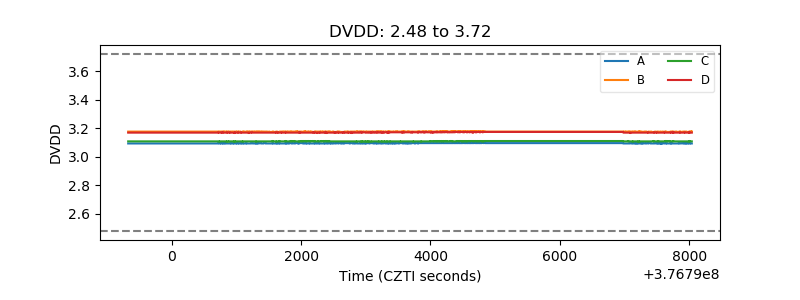 |
| Temperature 1 |  |
| Veto HV Monitor |  |
| Veto LLD | 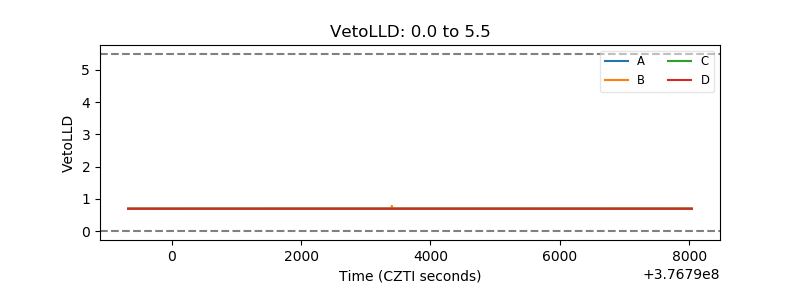 |
| Alpha Counter | 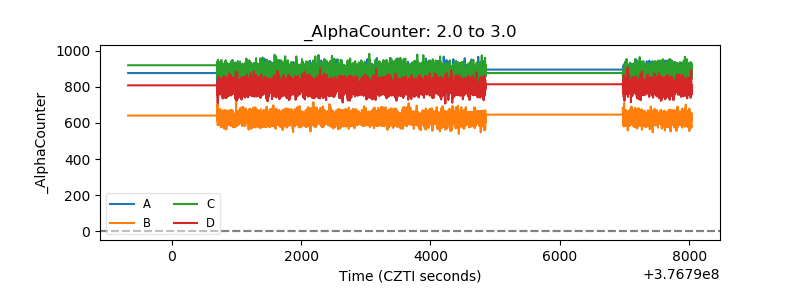 |
| _CPM_Rate | 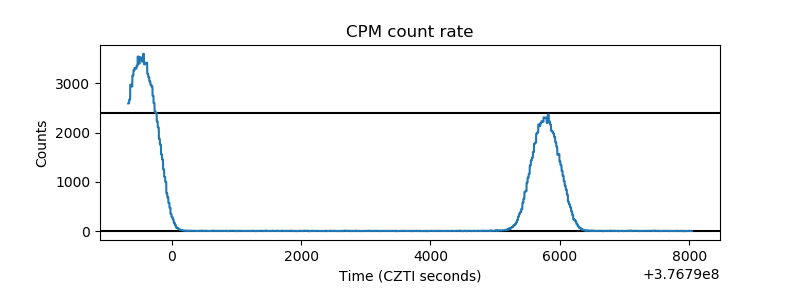 |
| CZT Counter | 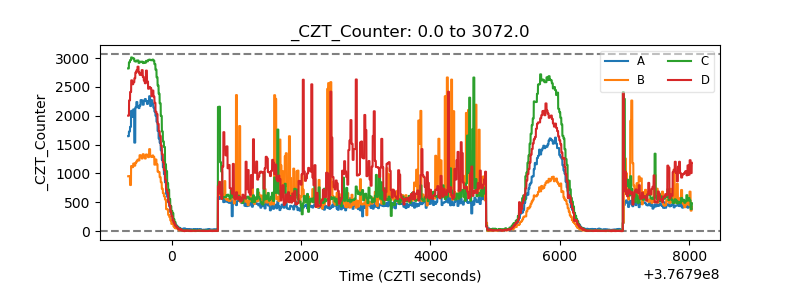 |
| +2.5 Volts monitor |  |
| +5 Volts monitor |  |
| _ROLL_ROT | 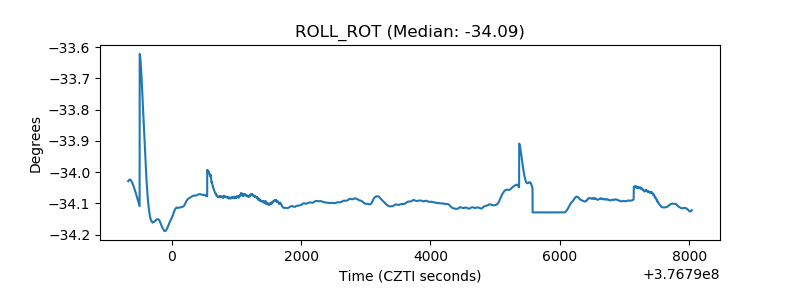 |
| _Roll_DEC | 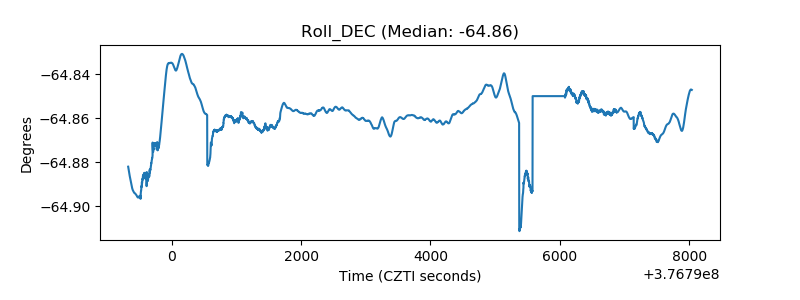 |
| _Roll_RA | 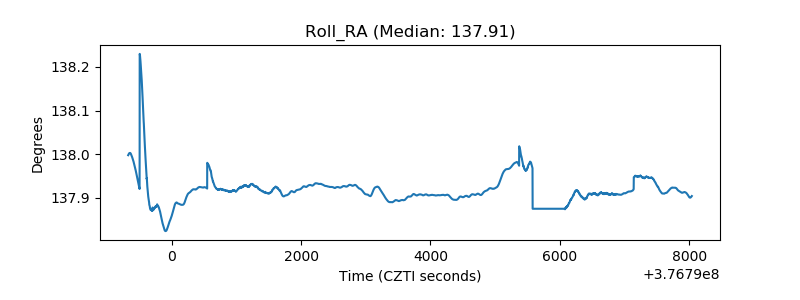 |
| Veto Counter | 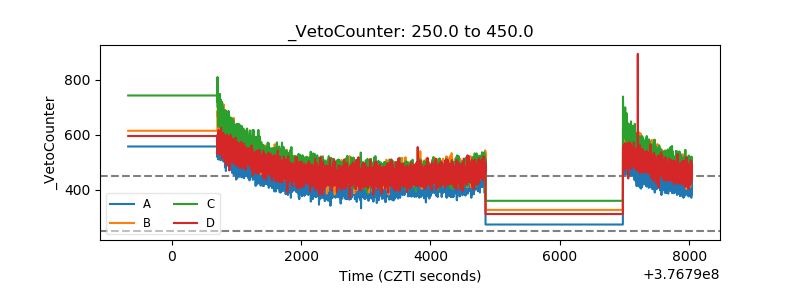 |