| Param | Original file | Final file |
|---|---|---|
| Filename | modeM0/AS1A11_037T01_9000004806_33527cztM0_level2.evt | modeM0/AS1A11_037T01_9000004806_33527cztM0_level2_quad_clean.evt |
| Size (bytes) | 476,861,760 | 83,355,840 |
| Size | 454.8 MB | 79.5 MB |
| Events in quadrant A | 2,203,746 | 557,139 |
| Events in quadrant B | 3,239,542 | 564,523 |
| Events in quadrant C | 3,037,171 | 556,852 |
| Events in quadrant D | 5,629,632 | 502,582 |
| Mode M9 | |||
|---|---|---|---|
| Quadrant | BADHDUFLAG | Total packets | Discarded packets |
| A | 0 | 20 | 0 |
| B | 0 | 20 | 0 |
| C | 0 | 20 | 0 |
| D | 0 | 20 | 0 |
| Mode M0 | |||
|---|---|---|---|
| Quadrant | BADHDUFLAG | Total packets | Discarded packets |
| A | 0 | 9820 | 2 |
| B | 0 | 12782 | 1 |
| C | 0 | 11935 | 1 |
| D | 0 | 20010 | 1 |
| Mode SS | |||
|---|---|---|---|
| Quadrant | BADHDUFLAG | Total packets | Discarded packets |
| A | 0 | 100 | 0 |
| B | 0 | 100 | 0 |
| C | 0 | 100 | 0 |
| D | 0 | 100 | 0 |
| Quadrant | Total seconds | Saturated seconds | Saturation percentage |
|---|---|---|---|
| A | 4889 | 4 | 0.081816% |
| B | 4889 | 161 | 3.293107% |
| C | 4889 | 88 | 1.799959% |
| D | 4889 | 845 | 17.283698% |
Noise dominated data is calculated using 1-second bins in cleaned event files. If a bin has >2000 counts, and if more than 50% of those come from <1% of pixels, then it is considered to be noise-dominated and hence unusable.
| Quadrant | # 1 sec bins | Bins with >0 counts | Bins with >2000 counts | High rate bins dominated by noise | Noise dominated (total time) | Noise dominated (detector-on time) | Marked lightcurve |
|---|---|---|---|---|---|---|---|
| A | 6893 | 4890 | 0 | 0 | 0.00% | 0.00% | 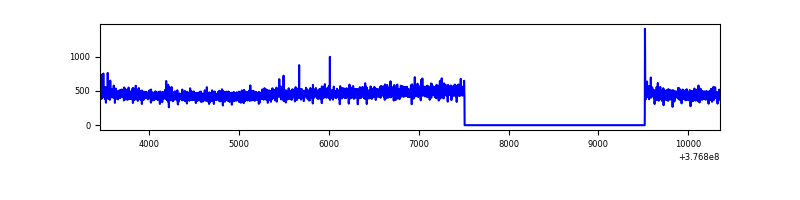 |
| B | 6893 | 4890 | 129 | 129 | 1.87% | 2.64% | 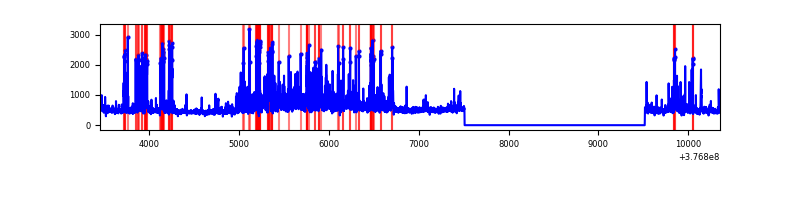 |
| C | 6893 | 4890 | 72 | 72 | 1.04% | 1.47% | 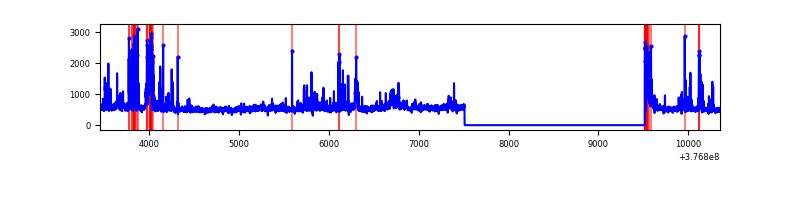 |
| D | 6893 | 4890 | 813 | 813 | 11.79% | 16.63% | 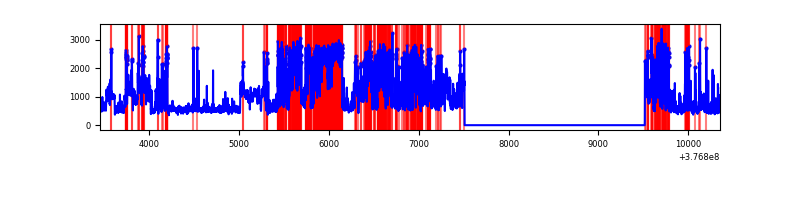 |
Top three noisy pixels from each quadrant. If the there are fewer than three noisy pixels in the level2.evt file, extra rows are filled as -1
| Pixel properties | Quadrant properties | ||||||
|---|---|---|---|---|---|---|---|
| Quadrant | DetID | PixID | Counts | Sigma | Mean | Median | Sigma |
| A | 13 | 254 | 9849 | 82.15 | 567 | 555 | 113.1 |
| A | 7 | 191 | 5809 | 46.44 | 567 | 555 | 113.1 |
| A | 3 | 137 | 5121 | 40.36 | 567 | 555 | 113.1 |
| B | 5 | 172 | 489684 | 4587.97 | 563 | 548 | 106.6 |
| B | 5 | 255 | 180773 | 1690.46 | 563 | 548 | 106.6 |
| B | 0 | 213 | 178259 | 1666.88 | 563 | 548 | 106.6 |
| C | 1 | 23 | 238012 | 1855.08 | 558 | 561 | 128.0 |
| C | 15 | 214 | 225470 | 1757.09 | 558 | 561 | 128.0 |
| C | 3 | 233 | 154452 | 1202.27 | 558 | 561 | 128.0 |
| D | 2 | 250 | 1567716 | 11653.3 | 514 | 503 | 134.5 |
| D | 8 | 195 | 1203597 | 8945.83 | 514 | 503 | 134.5 |
| D | 13 | 249 | 347667 | 2581.4 | 514 | 503 | 134.5 |
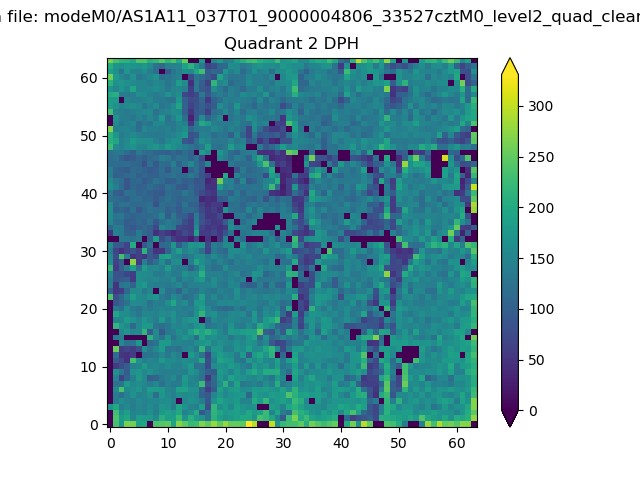
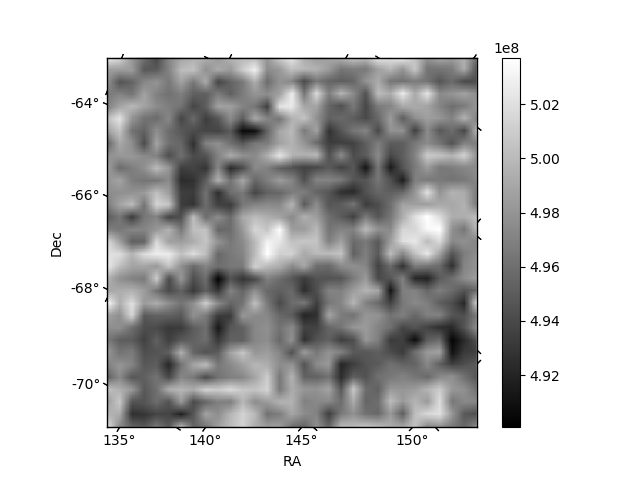
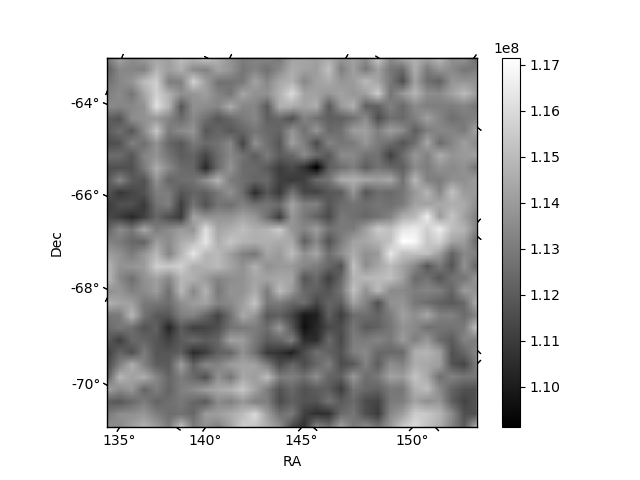
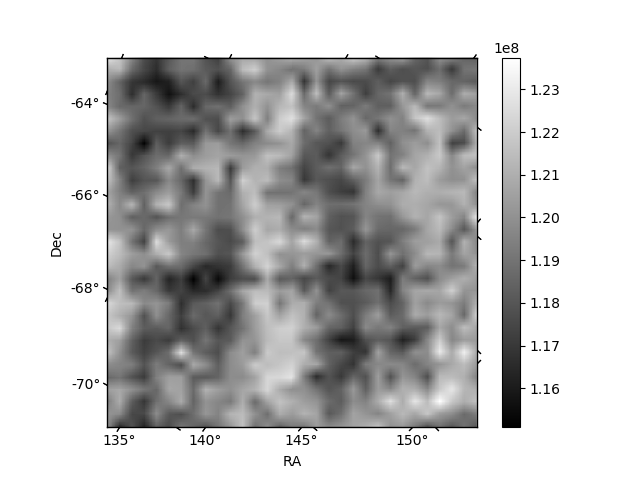
Histogram calculated using DETX and DETY for each event in the final _common_clean file
| Quadrant A | 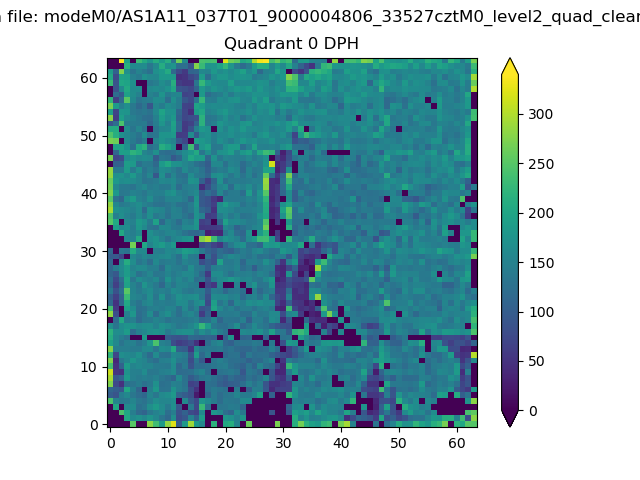 |
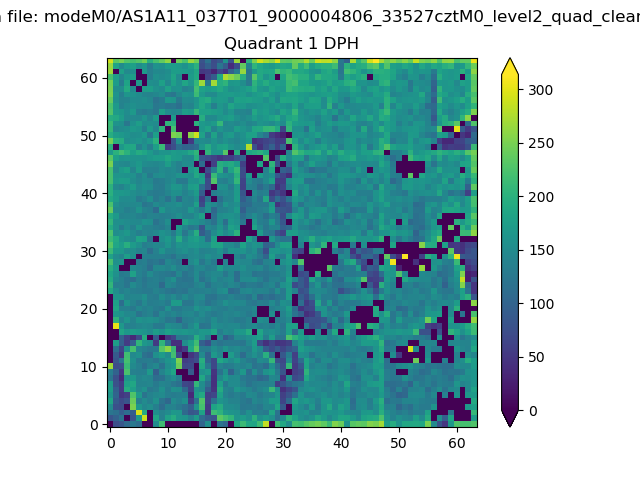 |
Quadrant B |
|---|---|---|---|
| Quadrant D | 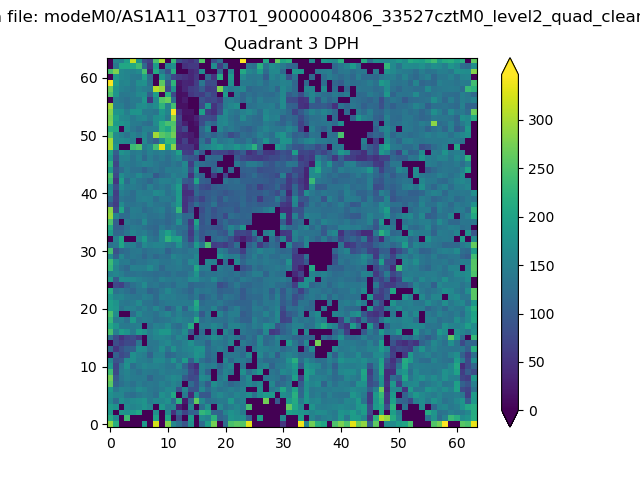 |
 |
Quadrant C |
| Plot type | Count rate plots | Images |
|---|---|---|
| Comparison with Poisson distribution Blue bars denote a histogram of data divided into 1 sec bins. Red curve is a Poisson curve with rate = median count rate of data. |
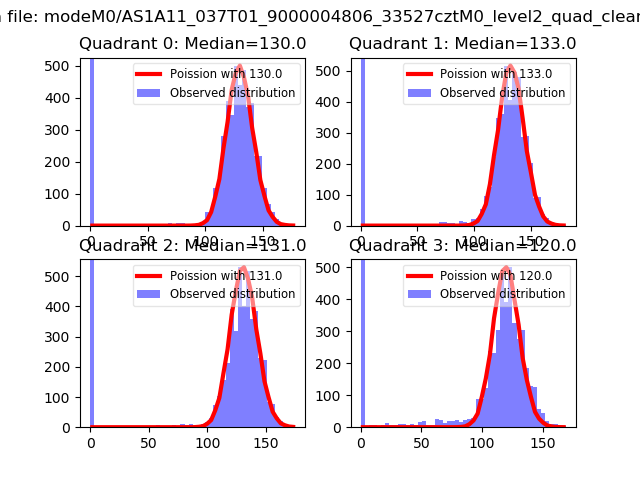 |
 |
| Quadrant-wise count rates Data is divided into 100 sec bins |
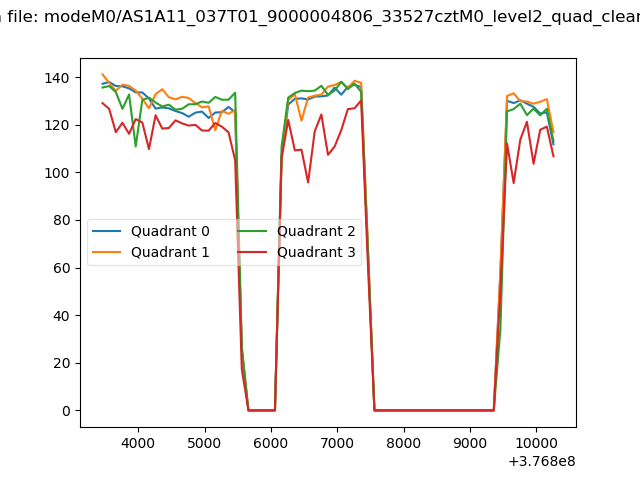 |
|
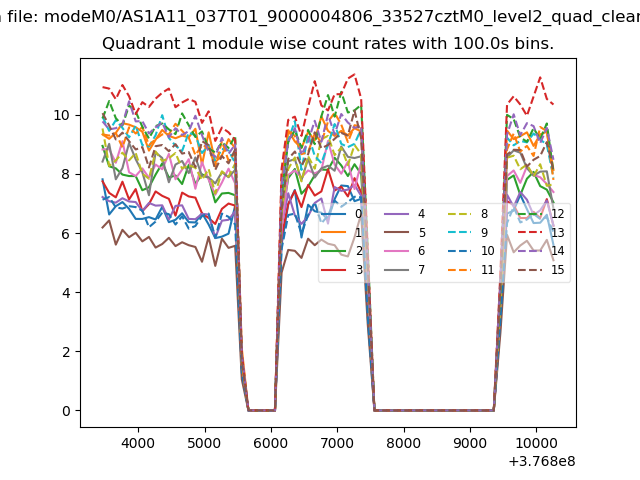
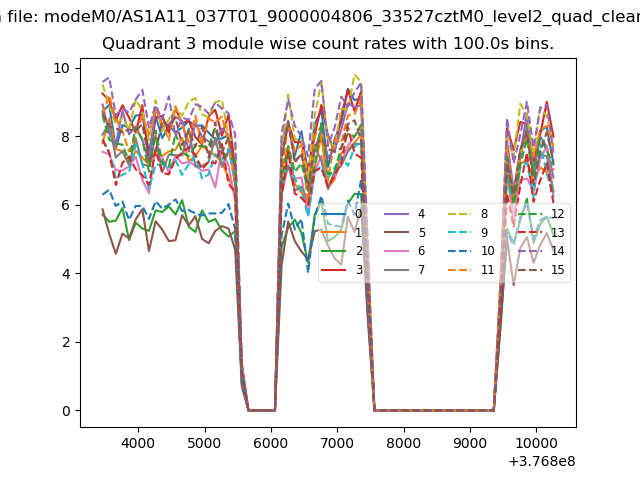
| Module-wise count rates for Quadrant A Data is divided into 100 sec bins |
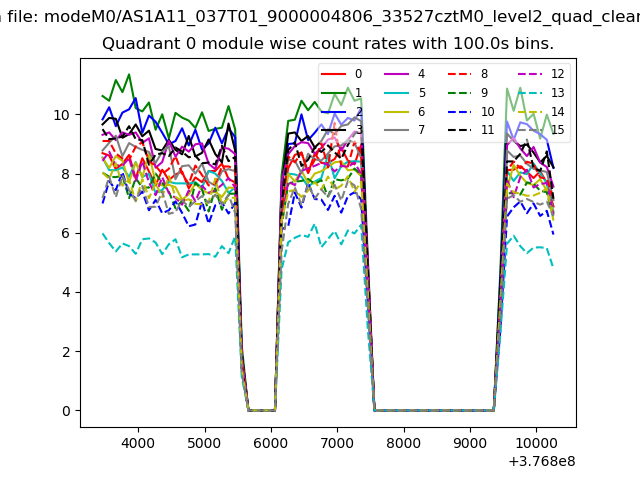 |
 |
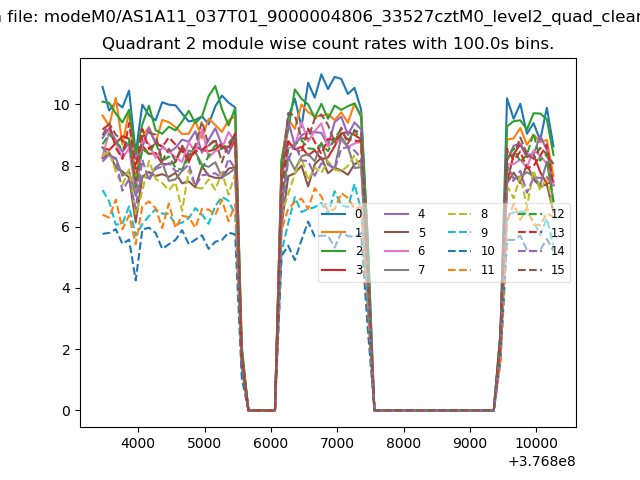
| Module-wise count rates for Quadrant B Data is divided into 100 sec bins |
 |
 |
| Module-wise count rates for Quadrant C Data is divided into 100 sec bins |
 |
 |
| Module-wise count rates for Quadrant D Data is divided into 100 sec bins |
 |
 |
| Parameter | Plot |
|---|---|
| CZT HV Monitor | 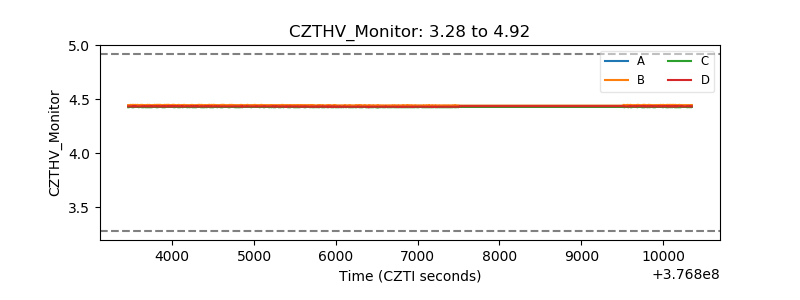 |
| D_VDD | 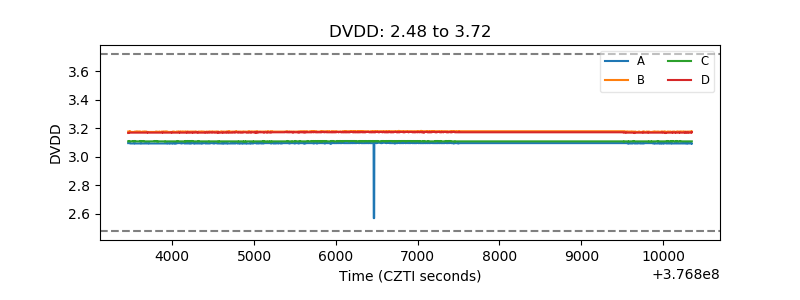 |
| Temperature 1 | 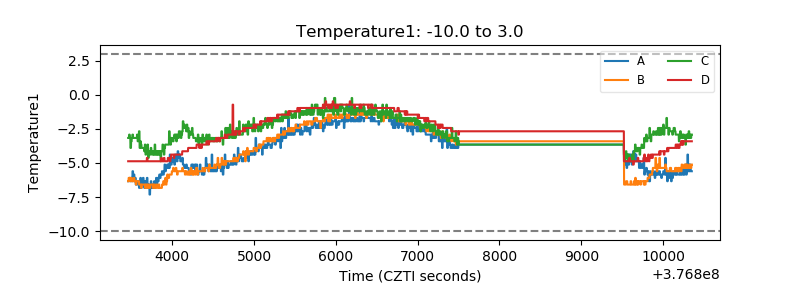 |
| Veto HV Monitor | 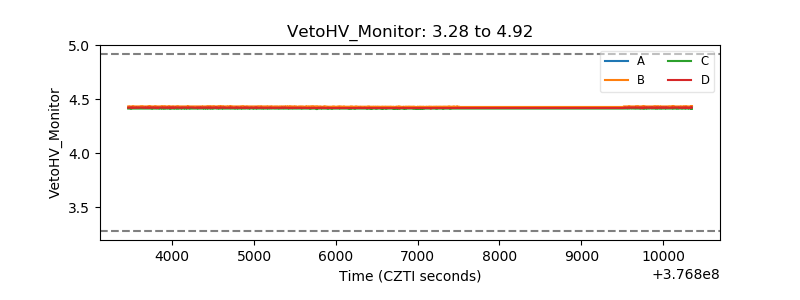 |
| Veto LLD | 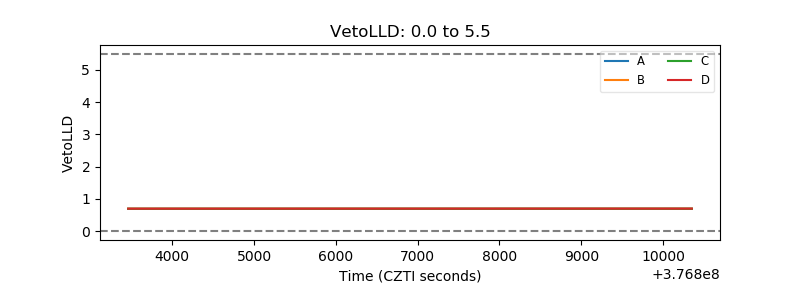 |
| Alpha Counter | 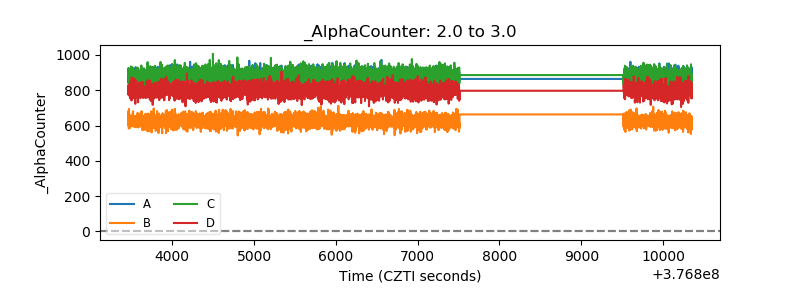 |
| _CPM_Rate | 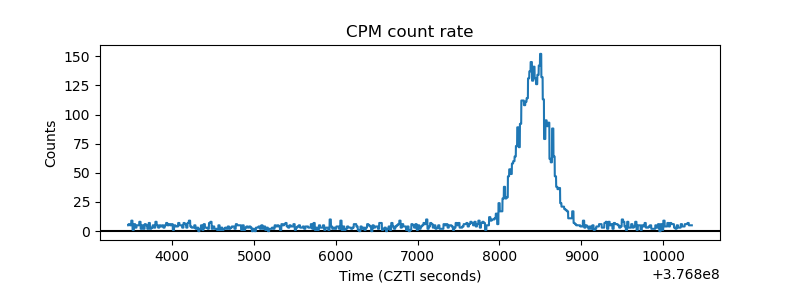 |
| CZT Counter | 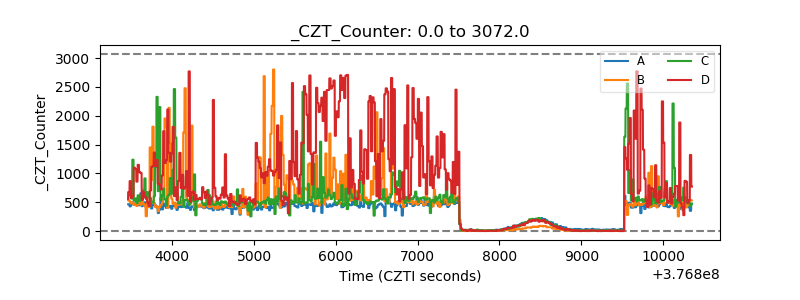 |
| +2.5 Volts monitor | 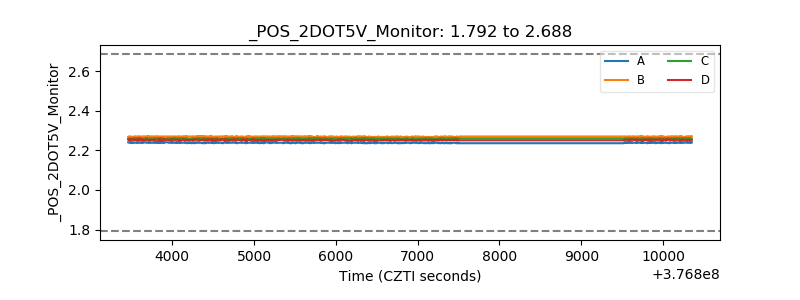 |
| +5 Volts monitor |  |
| _ROLL_ROT | 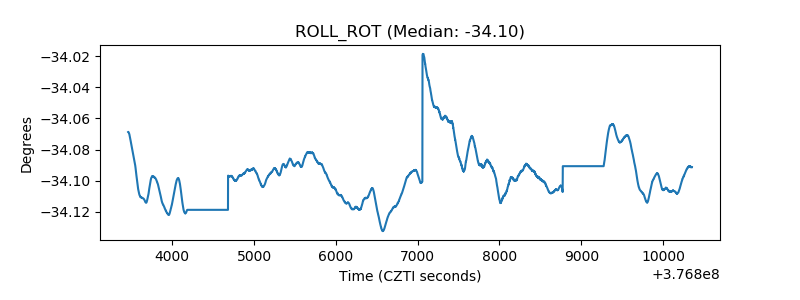 |
| _Roll_DEC | 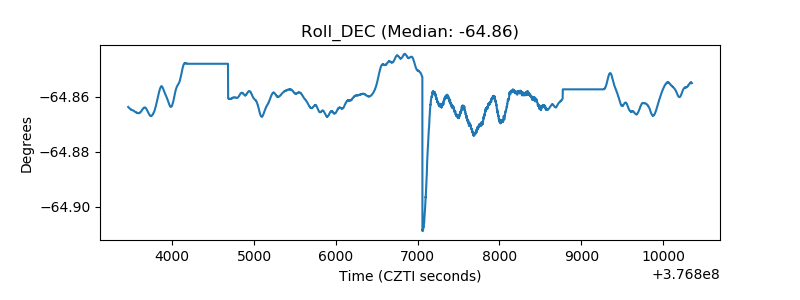 |
| _Roll_RA | 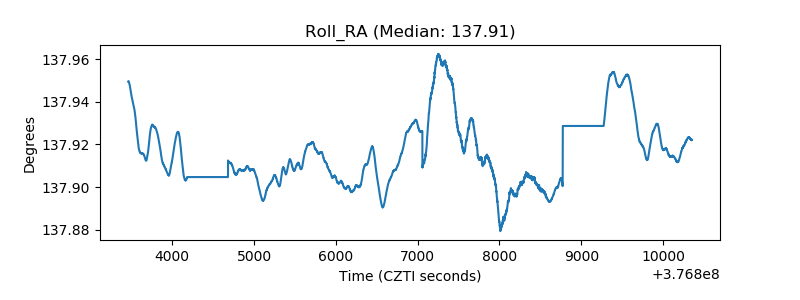 |
| Veto Counter | 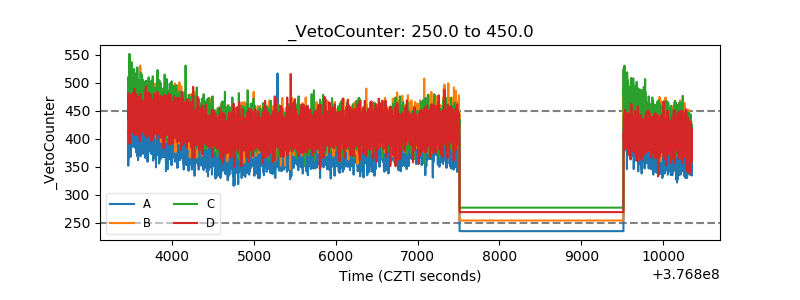 |