| Param | Original file | Final file |
|---|---|---|
| Filename | modeM0/AS1A11_037T01_9000004806_33528cztM0_level2.evt | modeM0/AS1A11_037T01_9000004806_33528cztM0_level2_quad_clean.evt |
| Size (bytes) | 554,892,480 | 90,884,160 |
| Size | 529.2 MB | 86.7 MB |
| Events in quadrant A | 2,447,738 | 613,330 |
| Events in quadrant B | 3,592,432 | 620,004 |
| Events in quadrant C | 3,242,292 | 610,410 |
| Events in quadrant D | 7,151,426 | 524,653 |
| Mode M9 | |||
|---|---|---|---|
| Quadrant | BADHDUFLAG | Total packets | Discarded packets |
| A | 0 | 18 | 0 |
| B | 0 | 18 | 0 |
| C | 0 | 18 | 0 |
| D | 0 | 19 | 0 |
| Mode M0 | |||
|---|---|---|---|
| Quadrant | BADHDUFLAG | Total packets | Discarded packets |
| A | 0 | 11004 | 3 |
| B | 0 | 14193 | 2 |
| C | 0 | 12708 | 2 |
| D | 0 | 25015 | 2 |
| Mode SS | |||
|---|---|---|---|
| Quadrant | BADHDUFLAG | Total packets | Discarded packets |
| A | 0 | 112 | 0 |
| B | 0 | 112 | 0 |
| C | 0 | 112 | 0 |
| D | 0 | 112 | 0 |
| Quadrant | Total seconds | Saturated seconds | Saturation percentage |
|---|---|---|---|
| A | 5473 | 6 | 0.109629% |
| B | 5473 | 233 | 4.257263% |
| C | 5473 | 139 | 2.539741% |
| D | 5473 | 1323 | 24.173214% |
Noise dominated data is calculated using 1-second bins in cleaned event files. If a bin has >2000 counts, and if more than 50% of those come from <1% of pixels, then it is considered to be noise-dominated and hence unusable.
| Quadrant | # 1 sec bins | Bins with >0 counts | Bins with >2000 counts | High rate bins dominated by noise | Noise dominated (total time) | Noise dominated (detector-on time) | Marked lightcurve |
|---|---|---|---|---|---|---|---|
| A | 7146 | 5474 | 2 | 2 | 0.03% | 0.04% | 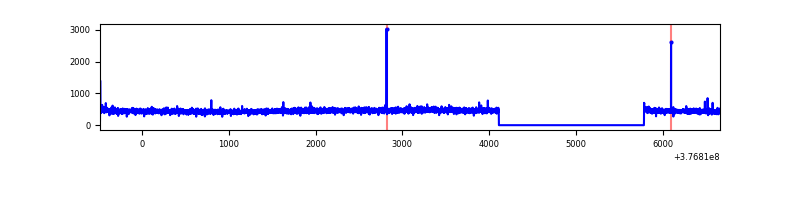 |
| B | 7146 | 5474 | 173 | 173 | 2.42% | 3.16% | 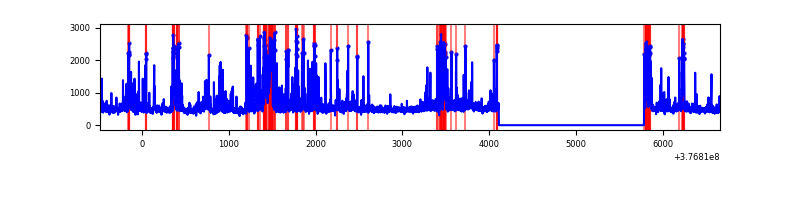 |
| C | 7146 | 5474 | 112 | 112 | 1.57% | 2.05% | 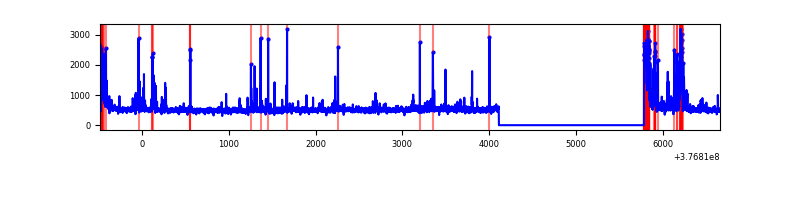 |
| D | 7146 | 5474 | 1298 | 1298 | 18.16% | 23.71% | 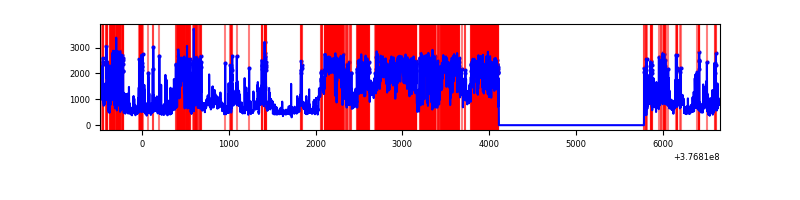 |
Top three noisy pixels from each quadrant. If the there are fewer than three noisy pixels in the level2.evt file, extra rows are filled as -1
| Pixel properties | Quadrant properties | ||||||
|---|---|---|---|---|---|---|---|
| Quadrant | DetID | PixID | Counts | Sigma | Mean | Median | Sigma |
| A | 13 | 254 | 10747 | 79.71 | 628 | 616 | 127.1 |
| A | 10 | 83 | 6056 | 42.8 | 628 | 616 | 127.1 |
| A | 3 | 137 | 5888 | 41.48 | 628 | 616 | 127.1 |
| B | 5 | 172 | 512204 | 4308.08 | 621 | 605 | 118.8 |
| B | 5 | 255 | 380088 | 3195.56 | 621 | 605 | 118.8 |
| B | 4 | 170 | 63289 | 527.85 | 621 | 605 | 118.8 |
| C | 0 | 10 | 334214 | 2361.65 | 612 | 615 | 141.3 |
| C | 15 | 214 | 259711 | 1834.22 | 612 | 615 | 141.3 |
| C | 14 | 254 | 102843 | 723.7 | 612 | 615 | 141.3 |
| D | 2 | 120 | 2178604 | 14778.14 | 571 | 557 | 147.4 |
| D | 8 | 195 | 1313952 | 8911.44 | 571 | 557 | 147.4 |
| D | 13 | 249 | 494524 | 3351.59 | 571 | 557 | 147.4 |
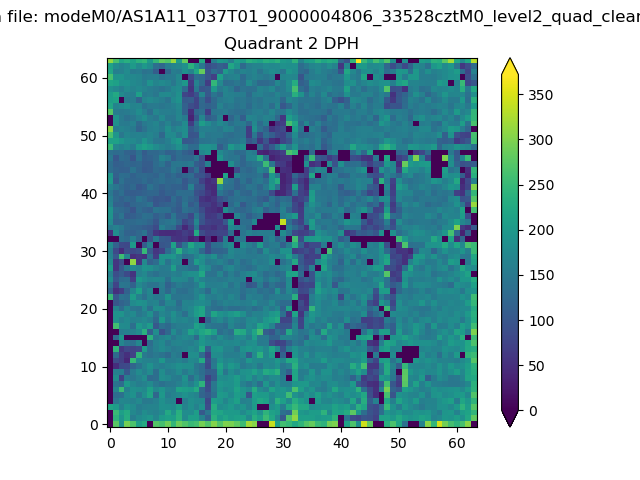
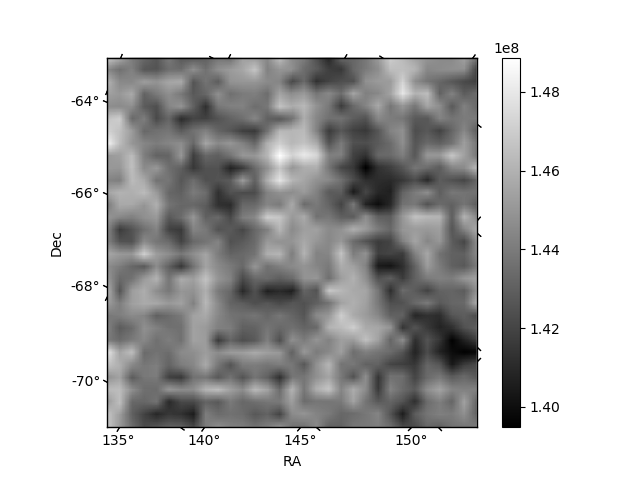
Histogram calculated using DETX and DETY for each event in the final _common_clean file
| Quadrant A | 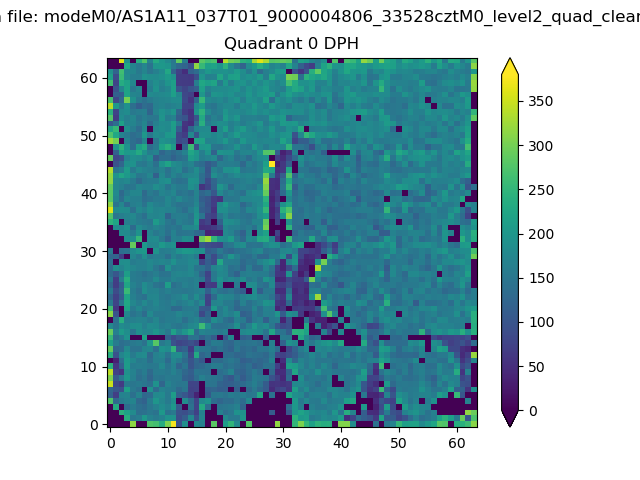 |
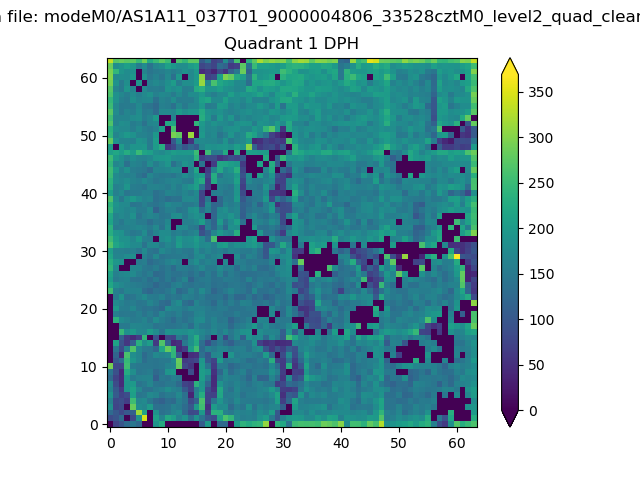 |
Quadrant B |
|---|---|---|---|
| Quadrant D | 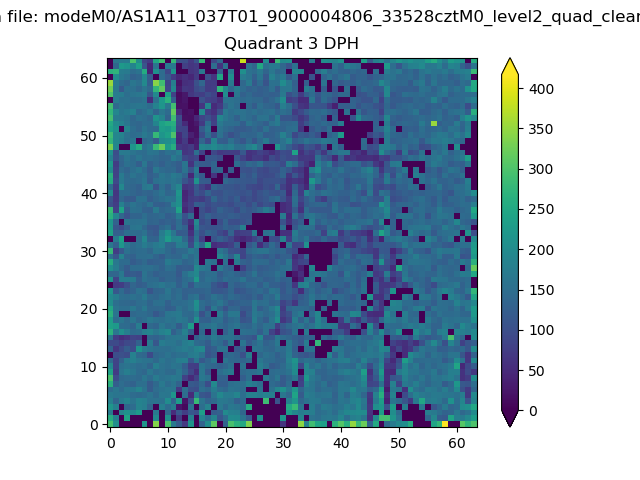 |
 |
Quadrant C |
| Plot type | Count rate plots | Images |
|---|---|---|
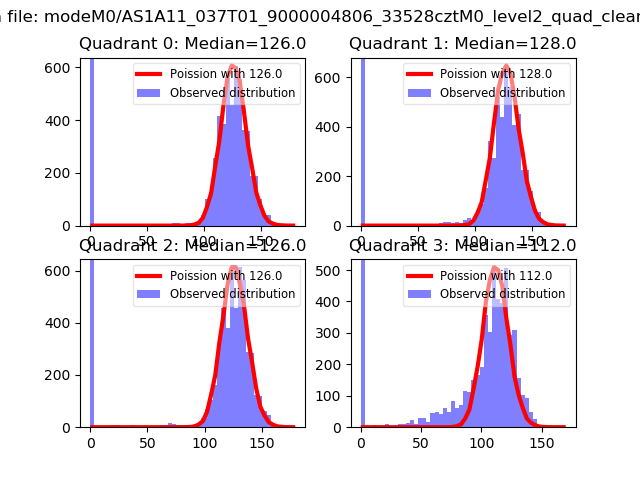
| Comparison with Poisson distribution Blue bars denote a histogram of data divided into 1 sec bins. Red curve is a Poisson curve with rate = median count rate of data. |
 |
 |
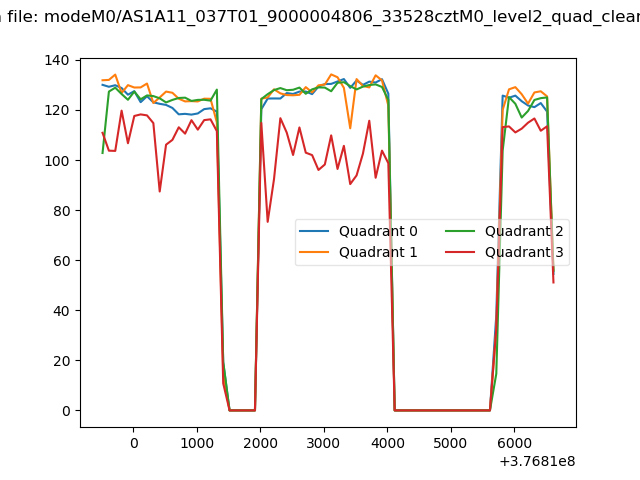
| Quadrant-wise count rates Data is divided into 100 sec bins |
 |
|
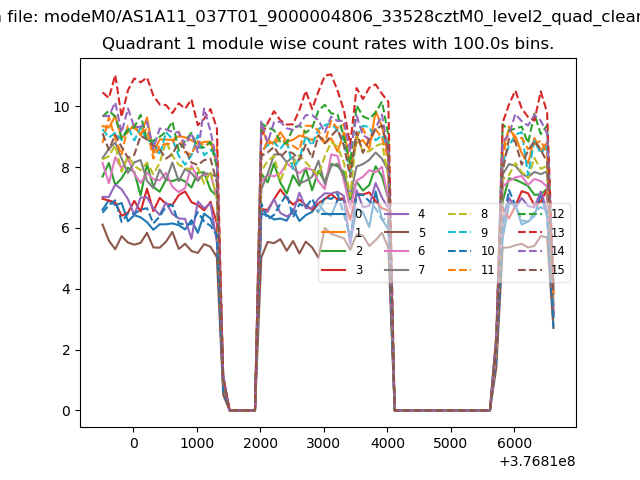
| Module-wise count rates for Quadrant A Data is divided into 100 sec bins |
 |
 |
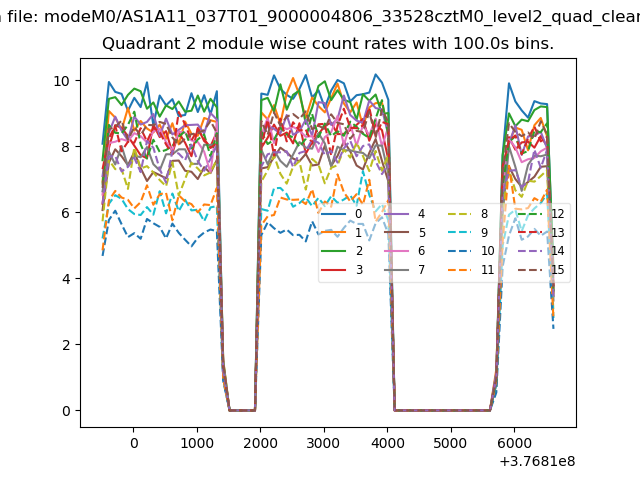
| Module-wise count rates for Quadrant B Data is divided into 100 sec bins |
 |
 |
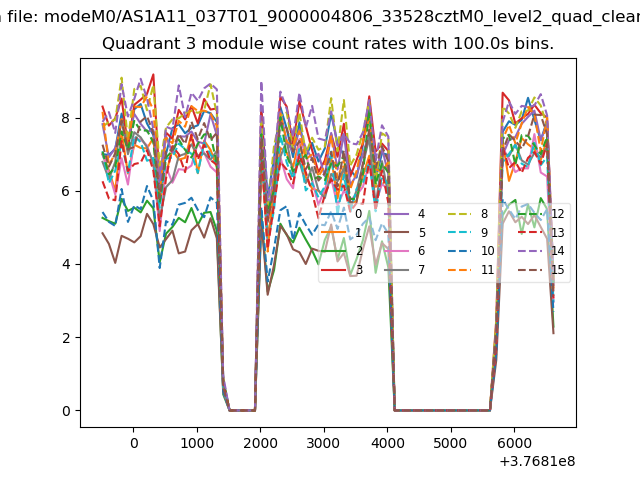
| Module-wise count rates for Quadrant C Data is divided into 100 sec bins |
 |
 |
| Module-wise count rates for Quadrant D Data is divided into 100 sec bins |
 |
 |
| Parameter | Plot |
|---|---|
| CZT HV Monitor | 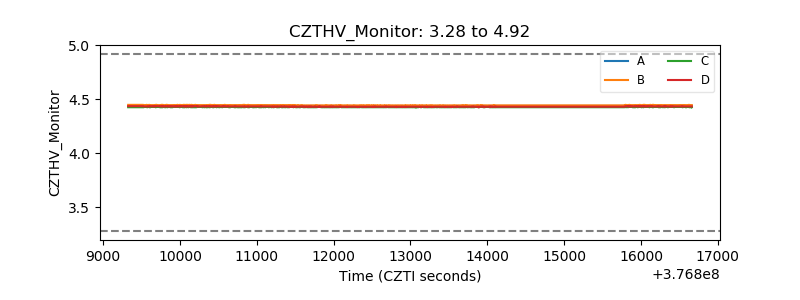 |
| D_VDD | 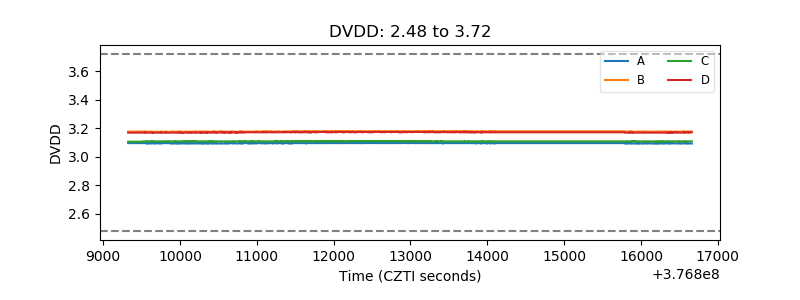 |
| Temperature 1 | 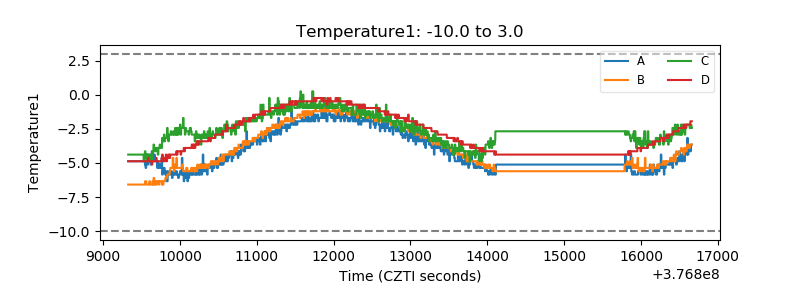 |
| Veto HV Monitor | 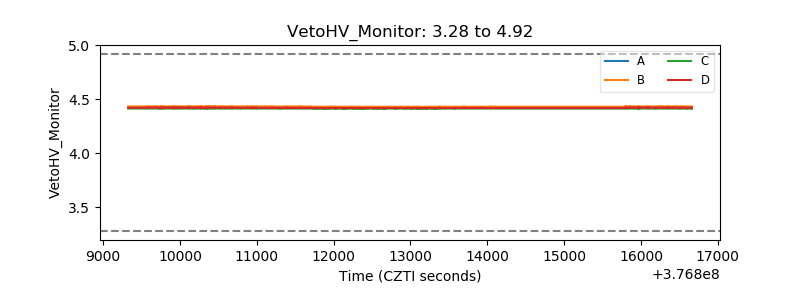 |
| Veto LLD | 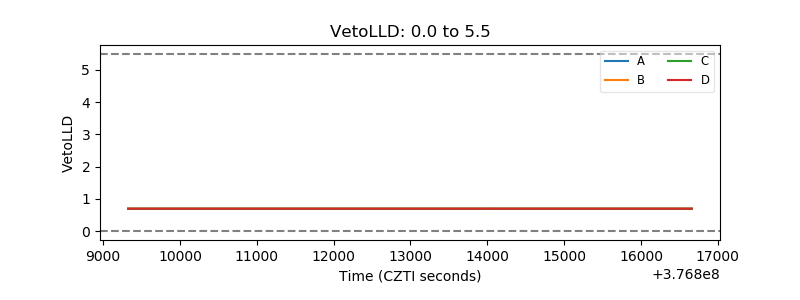 |
| Alpha Counter | 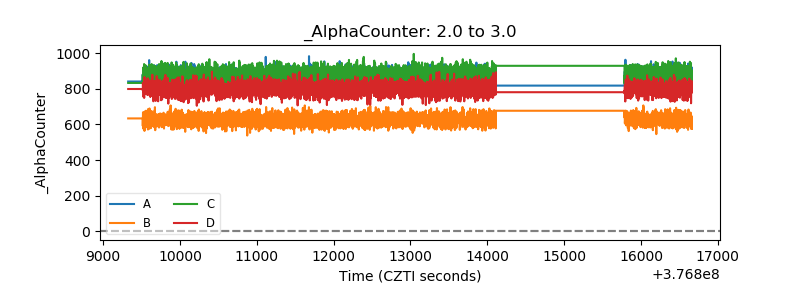 |
| _CPM_Rate | 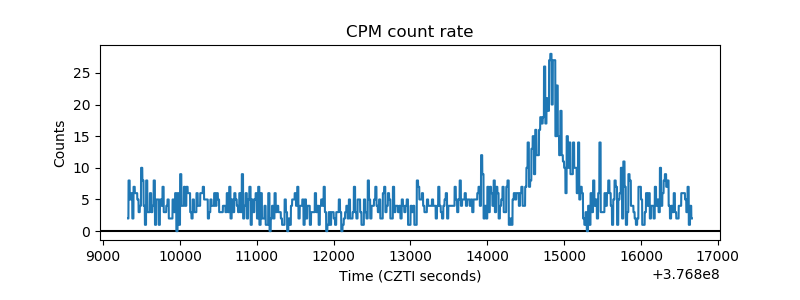 |
| CZT Counter | 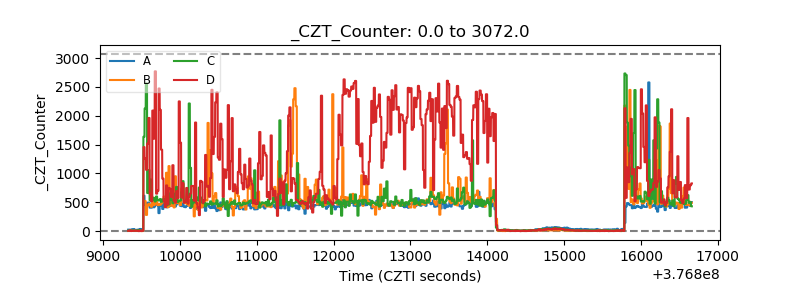 |
| +2.5 Volts monitor |  |
| +5 Volts monitor |  |
| _ROLL_ROT |  |
| _Roll_DEC | 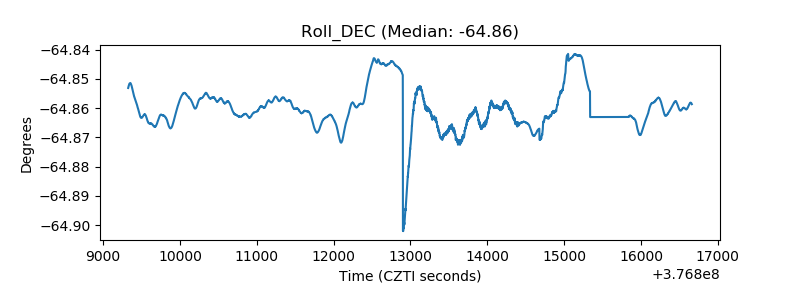 |
| _Roll_RA | 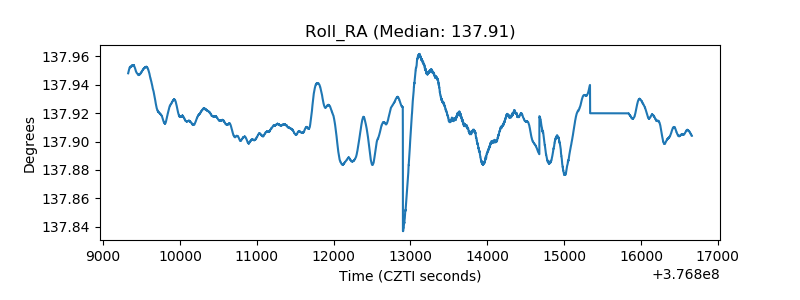 |
| Veto Counter |  |