| Param | Original file | Final file |
|---|---|---|
| Filename | modeM0/AS1A11_037T01_9000004806_33529cztM0_level2.evt | modeM0/AS1A11_037T01_9000004806_33529cztM0_level2_quad_clean.evt |
| Size (bytes) | 544,576,320 | 95,653,440 |
| Size | 519.3 MB | 91.2 MB |
| Events in quadrant A | 2,542,882 | 637,759 |
| Events in quadrant B | 4,336,813 | 633,748 |
| Events in quadrant C | 3,816,151 | 631,597 |
| Events in quadrant D | 5,409,244 | 593,209 |
| Mode M9 | |||
|---|---|---|---|
| Quadrant | BADHDUFLAG | Total packets | Discarded packets |
| A | 0 | 14 | 0 |
| B | 0 | 14 | 0 |
| C | 0 | 14 | 0 |
| D | 0 | 14 | 0 |
| Mode M0 | |||
|---|---|---|---|
| Quadrant | BADHDUFLAG | Total packets | Discarded packets |
| A | 0 | 11489 | 2 |
| B | 0 | 16690 | 1 |
| C | 0 | 14775 | 1 |
| D | 0 | 20092 | 1 |
| Mode SS | |||
|---|---|---|---|
| Quadrant | BADHDUFLAG | Total packets | Discarded packets |
| A | 0 | 116 | 0 |
| B | 0 | 116 | 0 |
| C | 0 | 116 | 0 |
| D | 0 | 116 | 0 |
| Quadrant | Total seconds | Saturated seconds | Saturation percentage |
|---|---|---|---|
| A | 5727 | 5 | 0.087306% |
| B | 5727 | 322 | 5.622490% |
| C | 5727 | 170 | 2.968395% |
| D | 5727 | 215 | 3.754147% |
Noise dominated data is calculated using 1-second bins in cleaned event files. If a bin has >2000 counts, and if more than 50% of those come from <1% of pixels, then it is considered to be noise-dominated and hence unusable.
| Quadrant | # 1 sec bins | Bins with >0 counts | Bins with >2000 counts | High rate bins dominated by noise | Noise dominated (total time) | Noise dominated (detector-on time) | Marked lightcurve |
|---|---|---|---|---|---|---|---|
| A | 7131 | 5728 | 1 | 1 | 0.01% | 0.02% |  |
| B | 7131 | 5728 | 247 | 247 | 3.46% | 4.31% |  |
| C | 7131 | 5728 | 142 | 142 | 1.99% | 2.48% |  |
| D | 7131 | 5728 | 189 | 189 | 2.65% | 3.30% |  |
Top three noisy pixels from each quadrant. If the there are fewer than three noisy pixels in the level2.evt file, extra rows are filled as -1
| Pixel properties | Quadrant properties | ||||||
|---|---|---|---|---|---|---|---|
| Quadrant | DetID | PixID | Counts | Sigma | Mean | Median | Sigma |
| A | 13 | 254 | 11016 | 78.4 | 653 | 638 | 132.4 |
| A | 13 | 6 | 6404 | 43.56 | 653 | 638 | 132.4 |
| A | 3 | 137 | 6232 | 42.26 | 653 | 638 | 132.4 |
| B | 5 | 172 | 735494 | 5978.63 | 644 | 629 | 122.9 |
| B | 5 | 255 | 379220 | 3080.1 | 644 | 629 | 122.9 |
| B | 0 | 229 | 148277 | 1201.22 | 644 | 629 | 122.9 |
| C | 1 | 23 | 283096 | 1924.72 | 634 | 637 | 146.8 |
| C | 15 | 214 | 270681 | 1840.13 | 634 | 637 | 146.8 |
| C | 0 | 10 | 256964 | 1746.66 | 634 | 637 | 146.8 |
| D | 8 | 195 | 1745067 | 11106.6 | 627 | 611 | 157.1 |
| D | 2 | 250 | 204658 | 1299.13 | 627 | 611 | 157.1 |
| D | 13 | 249 | 196170 | 1245.08 | 627 | 611 | 157.1 |
Histogram calculated using DETX and DETY for each event in the final _common_clean file
| Quadrant A |  |
 |
Quadrant B |
|---|---|---|---|
| Quadrant D |  |
 |
Quadrant C |
| Plot type | Count rate plots | Images |
|---|---|---|
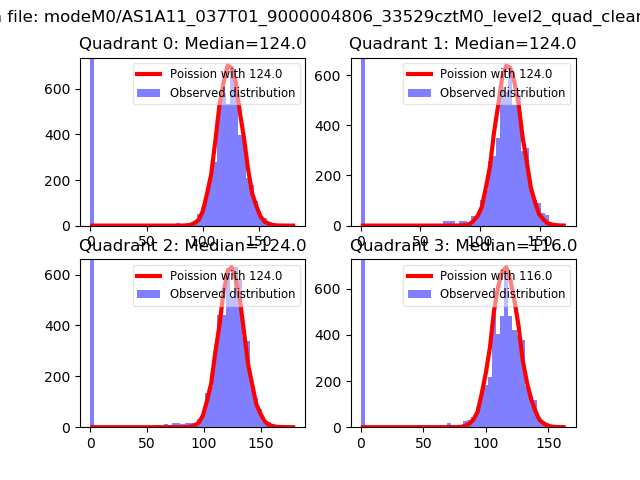
| Comparison with Poisson distribution Blue bars denote a histogram of data divided into 1 sec bins. Red curve is a Poisson curve with rate = median count rate of data. |
 |
 |
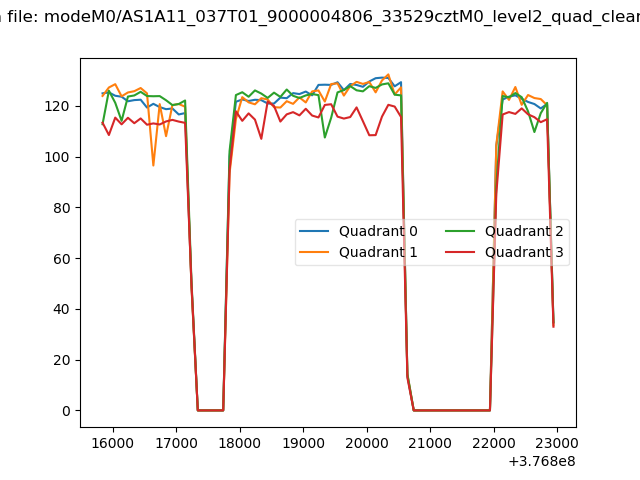
| Quadrant-wise count rates Data is divided into 100 sec bins |
 |
|
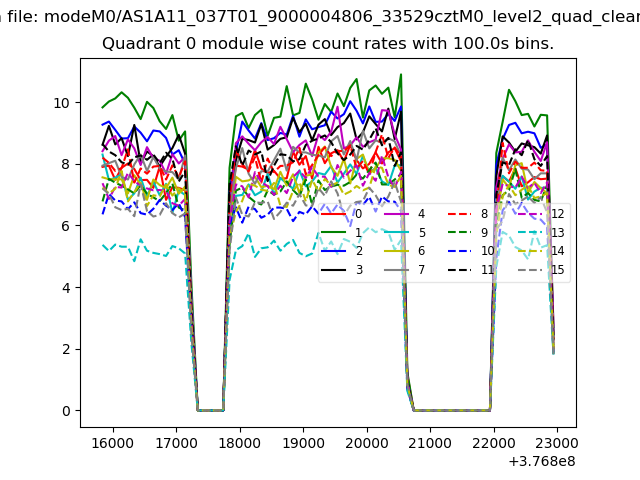
| Module-wise count rates for Quadrant A Data is divided into 100 sec bins |
 |
 |
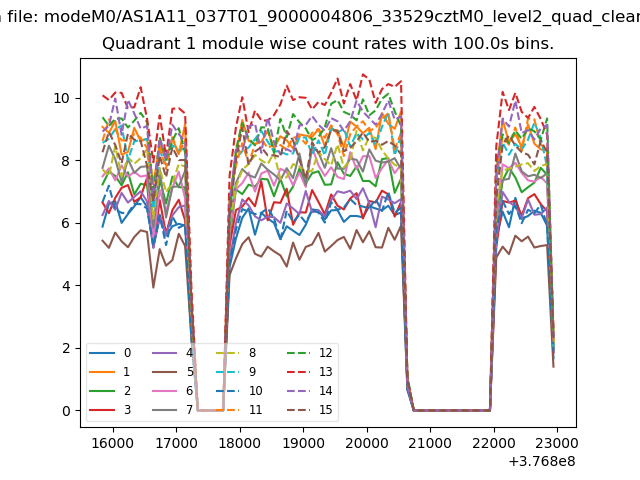
| Module-wise count rates for Quadrant B Data is divided into 100 sec bins |
 |
 |
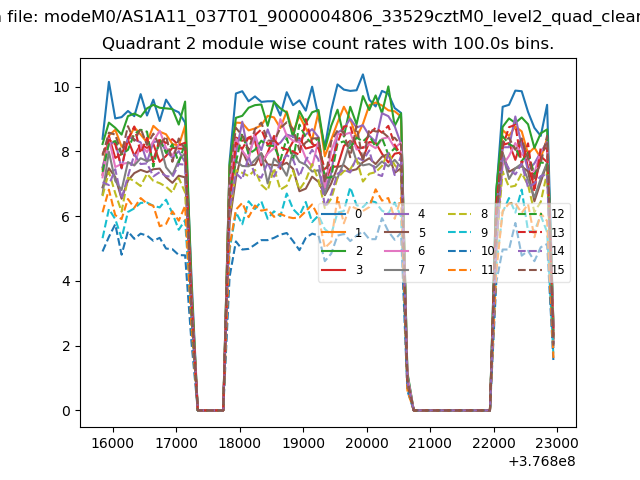
| Module-wise count rates for Quadrant C Data is divided into 100 sec bins |
 |
 |
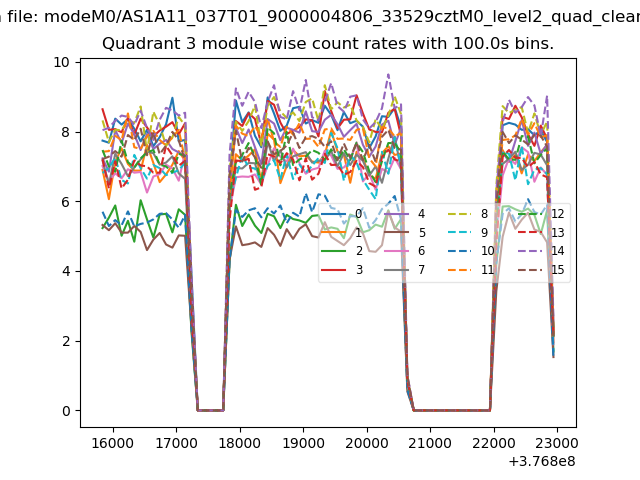
| Module-wise count rates for Quadrant D Data is divided into 100 sec bins |
 |
 |
| Parameter | Plot |
|---|---|
| CZT HV Monitor | 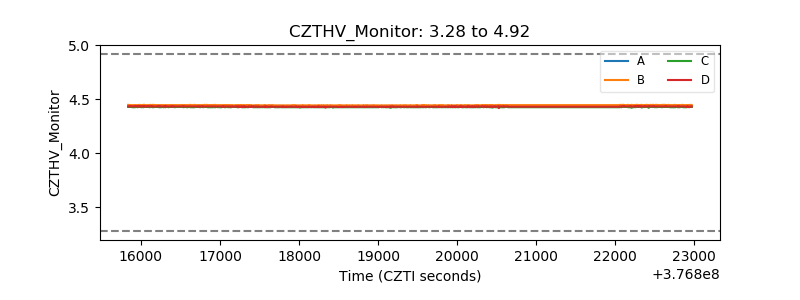 |
| D_VDD |  |
| Temperature 1 |  |
| Veto HV Monitor |  |
| Veto LLD |  |
| Alpha Counter | 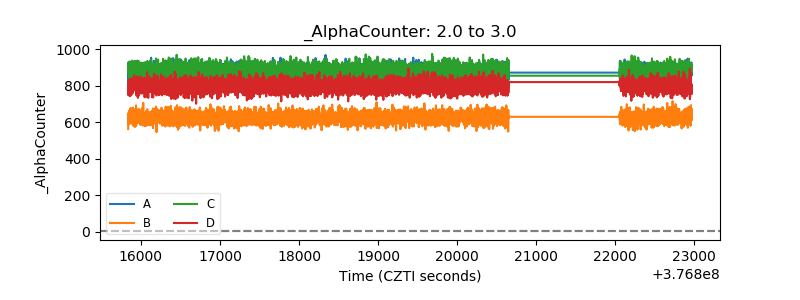 |
| _CPM_Rate | 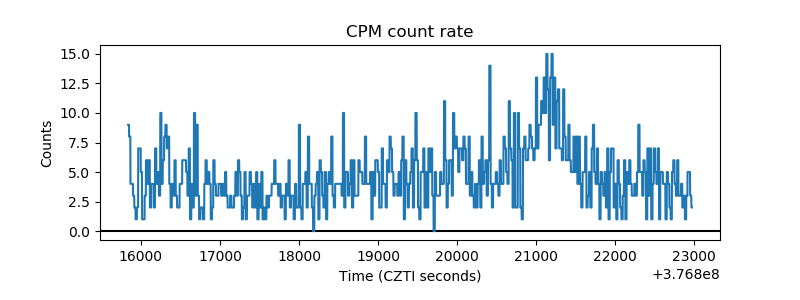 |
| CZT Counter |  |
| +2.5 Volts monitor |  |
| +5 Volts monitor |  |
| _ROLL_ROT | 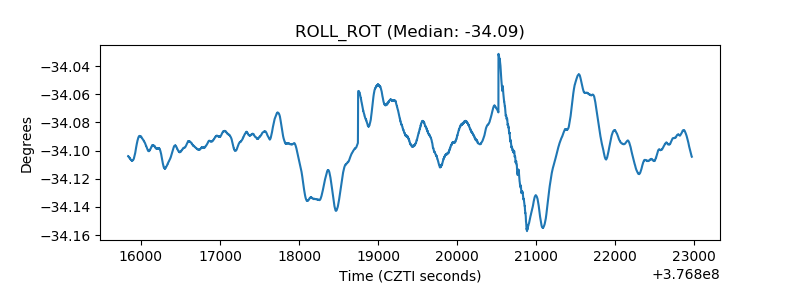 |
| _Roll_DEC |  |
| _Roll_RA |  |
| Veto Counter | 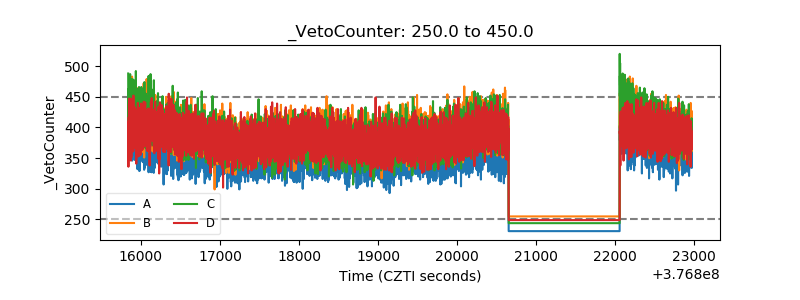 |