| Param | Original file | Final file |
|---|---|---|
| Filename | modeM0/AS1A11_037T01_9000004806_33530cztM0_level2.evt | modeM0/AS1A11_037T01_9000004806_33530cztM0_level2_quad_clean.evt |
| Size (bytes) | 327,375,360 | 53,904,960 |
| Size | 312.2 MB | 51.4 MB |
| Events in quadrant A | 1,559,208 | 353,820 |
| Events in quadrant B | 2,478,824 | 352,126 |
| Events in quadrant C | 2,335,568 | 349,116 |
| Events in quadrant D | 3,304,210 | 330,513 |
| Mode M9 | |||
|---|---|---|---|
| Quadrant | BADHDUFLAG | Total packets | Discarded packets |
| A | 0 | 5 | 0 |
| B | 0 | 5 | 0 |
| C | 0 | 5 | 0 |
| D | 0 | 6 | 0 |
| Mode M0 | |||
|---|---|---|---|
| Quadrant | BADHDUFLAG | Total packets | Discarded packets |
| A | 0 | 7051 | 1 |
| B | 0 | 9627 | 1 |
| C | 0 | 9007 | 1 |
| D | 0 | 12225 | 1 |
| Mode SS | |||
|---|---|---|---|
| Quadrant | BADHDUFLAG | Total packets | Discarded packets |
| A | 0 | 70 | 0 |
| B | 0 | 70 | 0 |
| C | 0 | 70 | 0 |
| D | 0 | 70 | 0 |
| Quadrant | Total seconds | Saturated seconds | Saturation percentage |
|---|---|---|---|
| A | 3476 | 5 | 0.143843% |
| B | 3476 | 152 | 4.372842% |
| C | 3476 | 103 | 2.963176% |
| D | 3476 | 200 | 5.753740% |
Noise dominated data is calculated using 1-second bins in cleaned event files. If a bin has >2000 counts, and if more than 50% of those come from <1% of pixels, then it is considered to be noise-dominated and hence unusable.
| Quadrant | # 1 sec bins | Bins with >0 counts | Bins with >2000 counts | High rate bins dominated by noise | Noise dominated (total time) | Noise dominated (detector-on time) | Marked lightcurve |
|---|---|---|---|---|---|---|---|
| A | 3476 | 3476 | 0 | 0 | 0.00% | 0.00% | 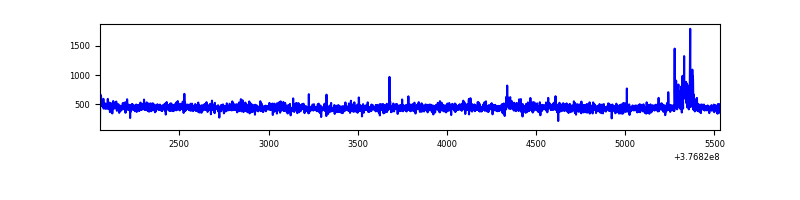 |
| B | 3476 | 3476 | 114 | 114 | 3.28% | 3.28% | 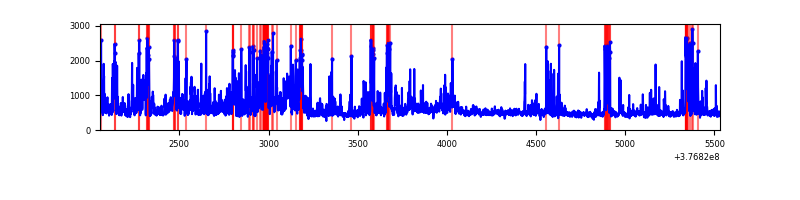 |
| C | 3476 | 3476 | 93 | 93 | 2.68% | 2.68% | 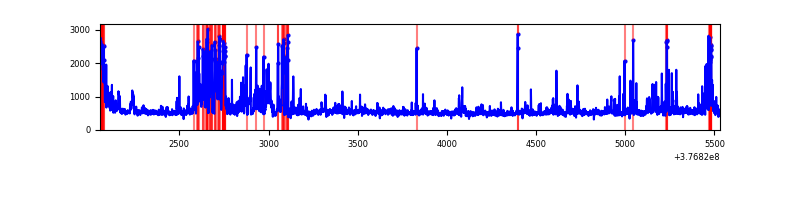 |
| D | 3476 | 3476 | 191 | 191 | 5.49% | 5.49% | 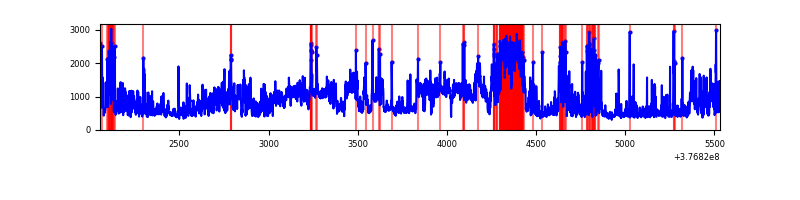 |
Top three noisy pixels from each quadrant. If the there are fewer than three noisy pixels in the level2.evt file, extra rows are filled as -1
| Pixel properties | Quadrant properties | ||||||
|---|---|---|---|---|---|---|---|
| Quadrant | DetID | PixID | Counts | Sigma | Mean | Median | Sigma |
| A | 12 | 227 | 28726 | 354.05 | 392 | 383 | 80.1 |
| A | 13 | 254 | 6852 | 80.81 | 392 | 383 | 80.1 |
| A | 13 | 6 | 6633 | 78.07 | 392 | 383 | 80.1 |
| B | 5 | 172 | 396155 | 5279.58 | 385 | 374 | 75.0 |
| B | 5 | 255 | 209211 | 2785.81 | 385 | 374 | 75.0 |
| B | 4 | 170 | 87649 | 1164.22 | 385 | 374 | 75.0 |
| C | 1 | 23 | 310808 | 3510.53 | 376 | 378 | 88.4 |
| C | 15 | 214 | 166799 | 1881.99 | 376 | 378 | 88.4 |
| C | 0 | 10 | 128369 | 1447.4 | 376 | 378 | 88.4 |
| D | 8 | 195 | 987348 | 10565.55 | 374 | 365 | 93.4 |
| D | 12 | 233 | 218588 | 2336.06 | 374 | 365 | 93.4 |
| D | 12 | 235 | 199989 | 2136.96 | 374 | 365 | 93.4 |
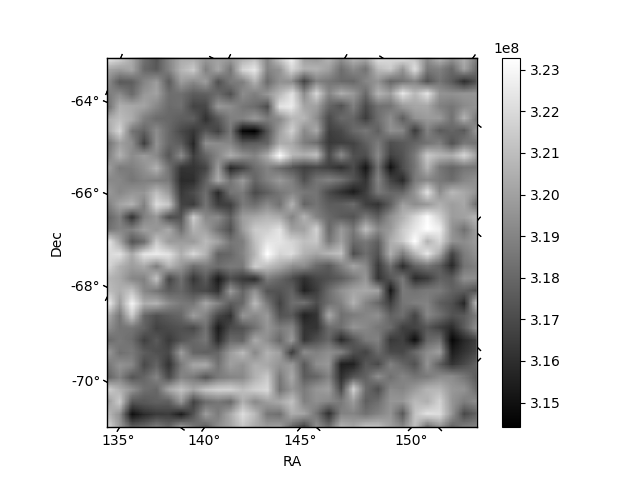
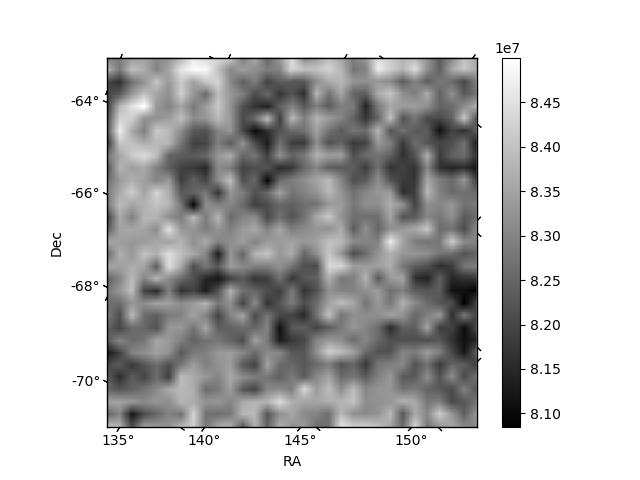
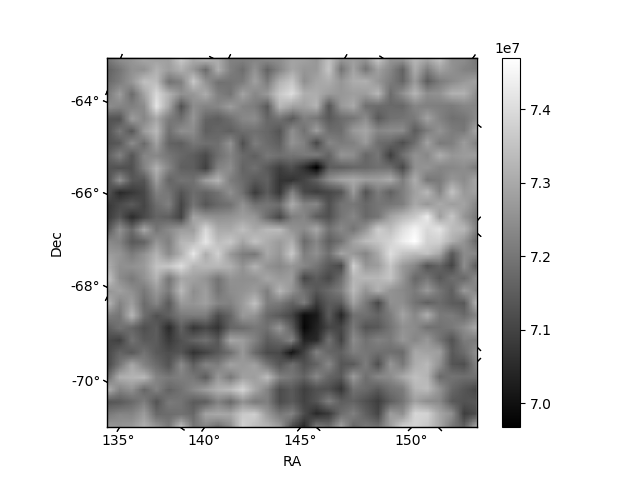
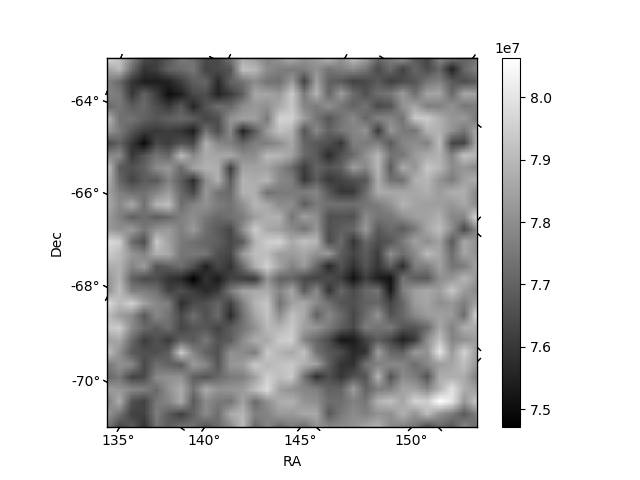
Histogram calculated using DETX and DETY for each event in the final _common_clean file
| Quadrant A | 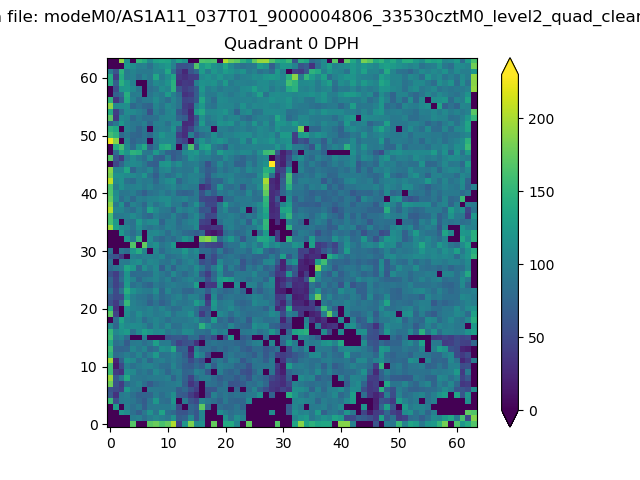 |
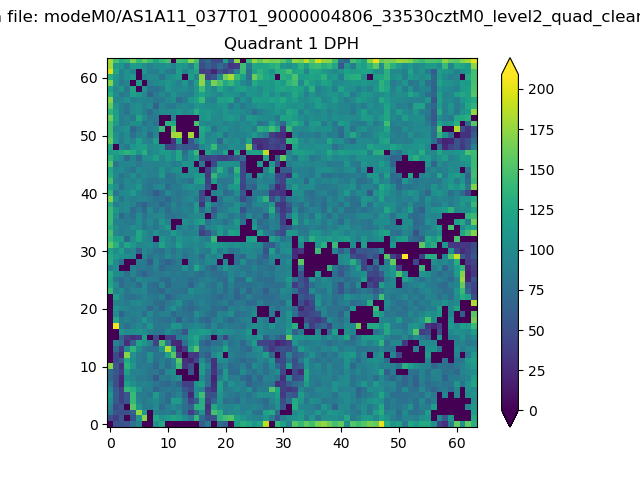 |
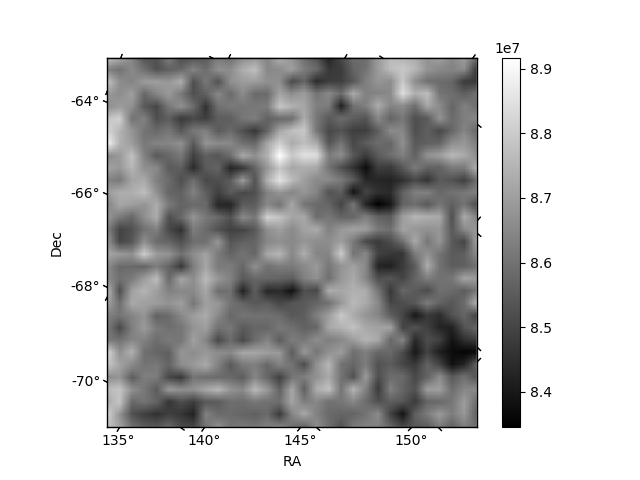
Quadrant B |
|---|---|---|---|
| Quadrant D | 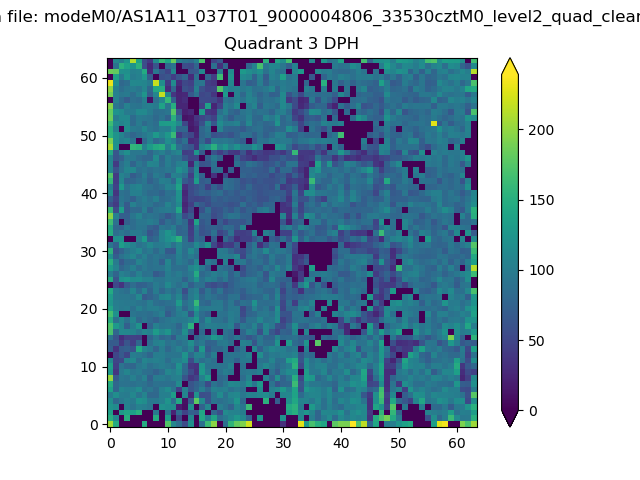 |
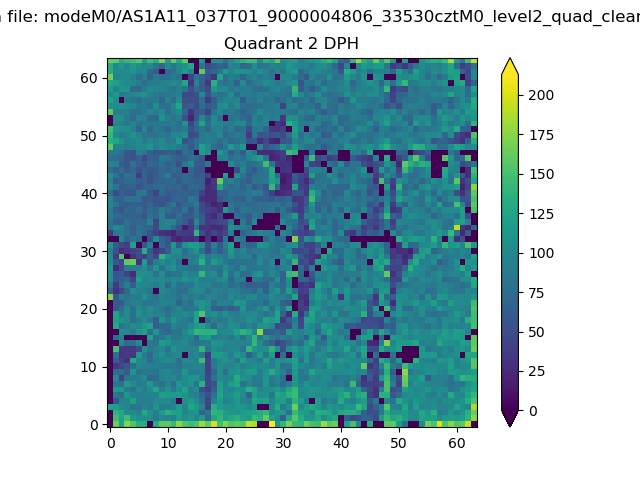 |
Quadrant C |
| Plot type | Count rate plots | Images |
|---|---|---|
| Comparison with Poisson distribution Blue bars denote a histogram of data divided into 1 sec bins. Red curve is a Poisson curve with rate = median count rate of data. |
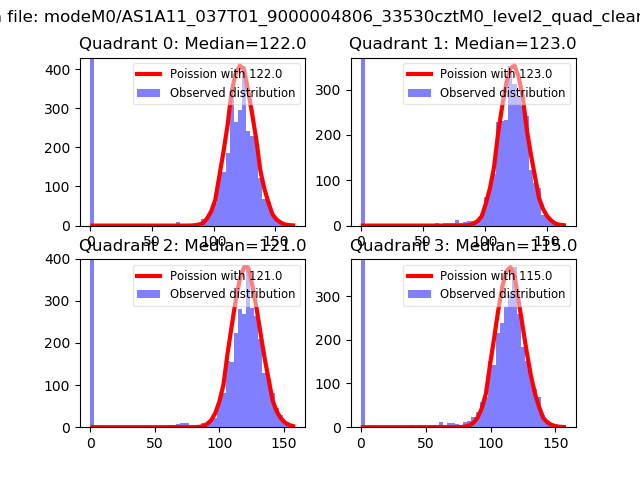 |
 |
| Quadrant-wise count rates Data is divided into 100 sec bins |
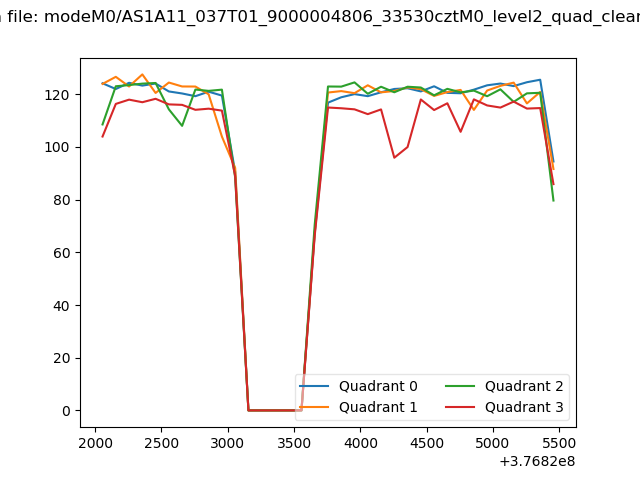 |
|
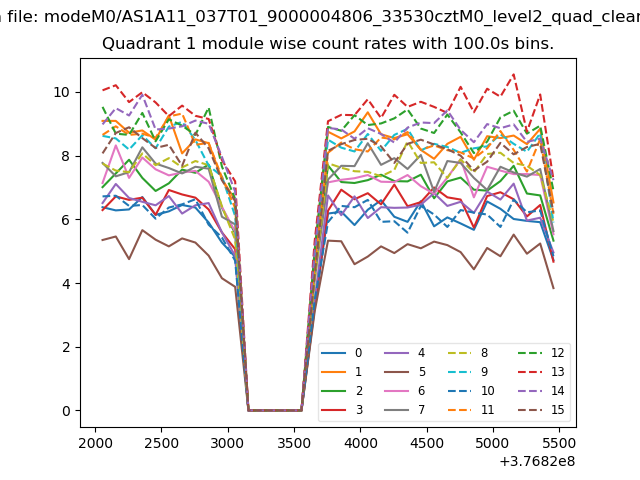
| Module-wise count rates for Quadrant A Data is divided into 100 sec bins |
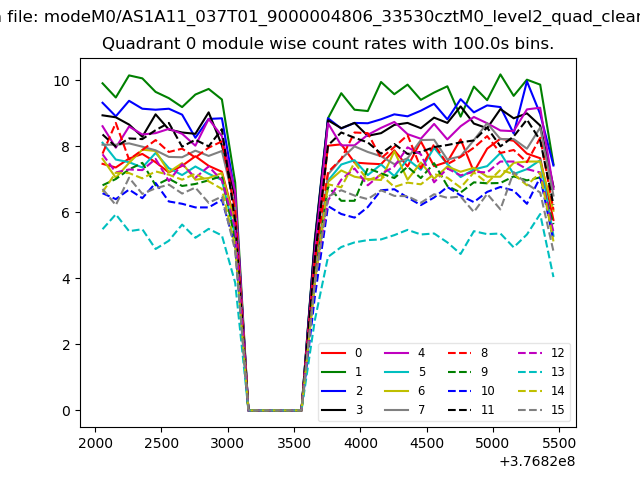 |
 |
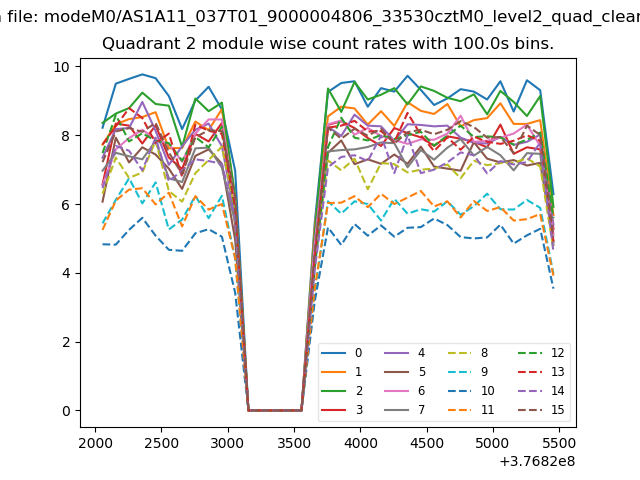
| Module-wise count rates for Quadrant B Data is divided into 100 sec bins |
 |
 |
| Module-wise count rates for Quadrant C Data is divided into 100 sec bins |
 |
 |
| Module-wise count rates for Quadrant D Data is divided into 100 sec bins |
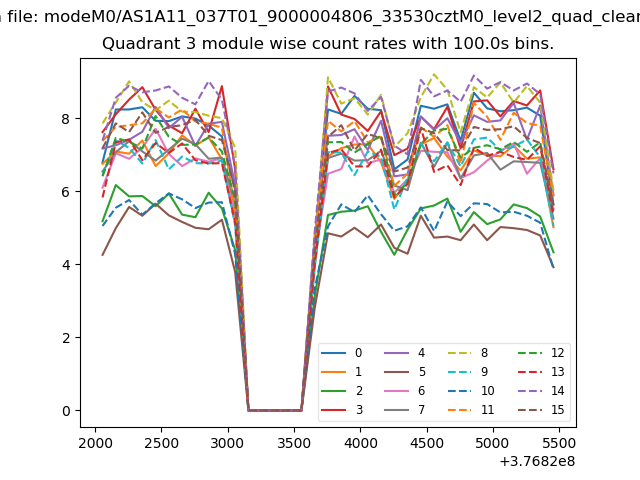 |
 |
| Parameter | Plot |
|---|---|
| CZT HV Monitor | 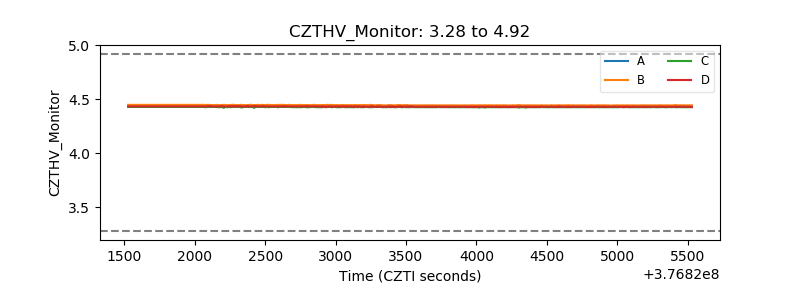 |
| D_VDD |  |
| Temperature 1 | 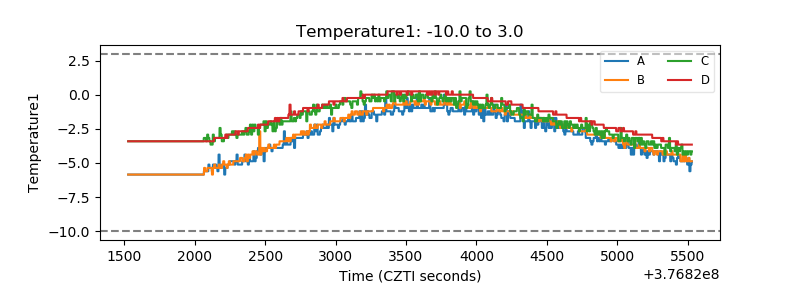 |
| Veto HV Monitor | 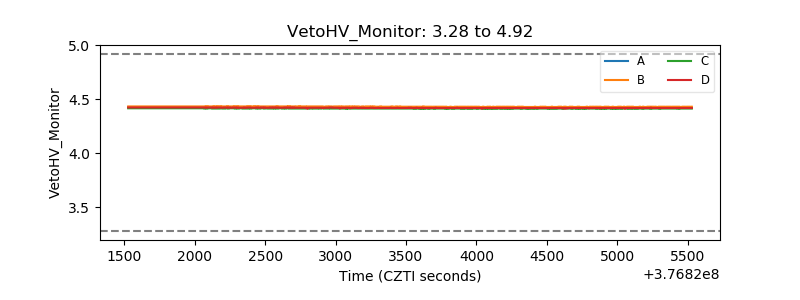 |
| Veto LLD | 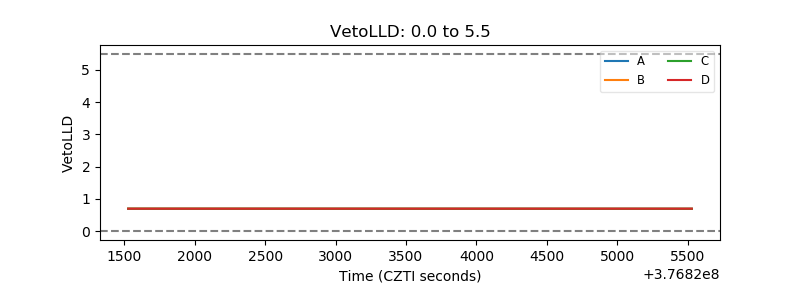 |
| Alpha Counter | 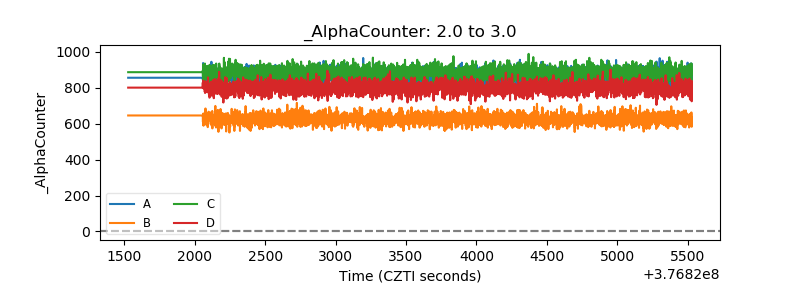 |
| _CPM_Rate | 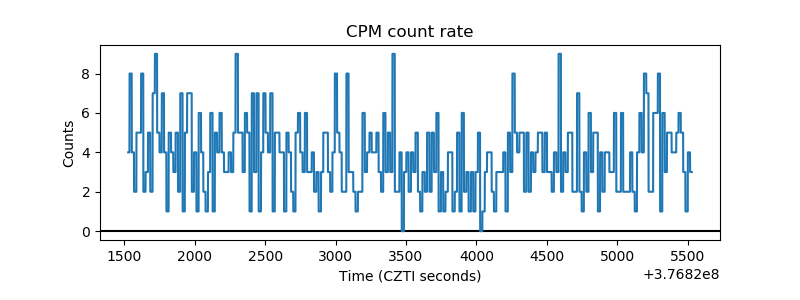 |
| CZT Counter | 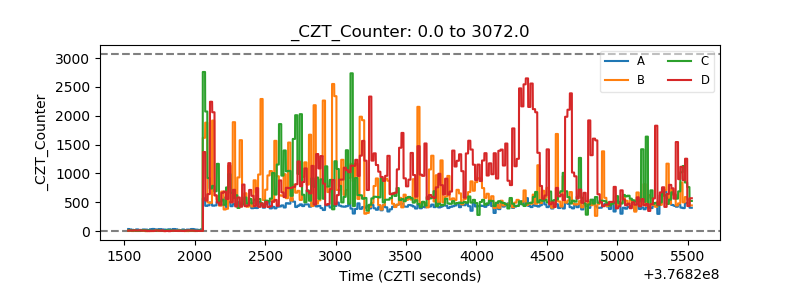 |
| +2.5 Volts monitor |  |
| +5 Volts monitor |  |
| _ROLL_ROT | 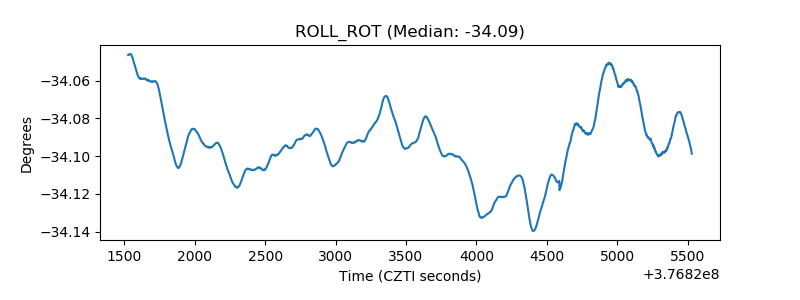 |
| _Roll_DEC | 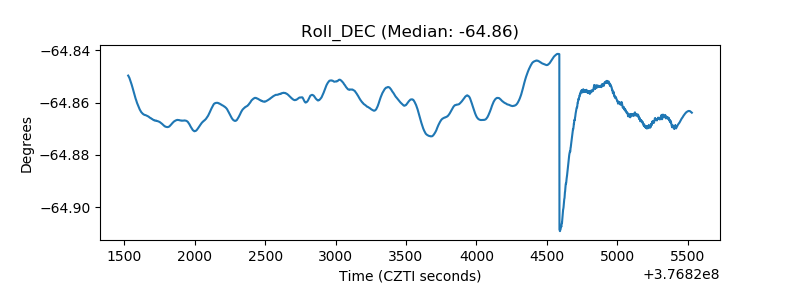 |
| _Roll_RA | 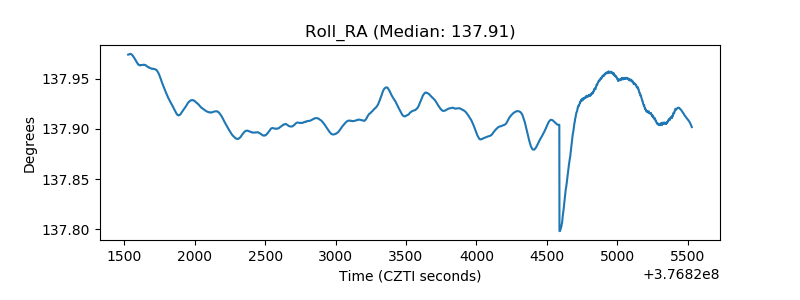 |
| Veto Counter | 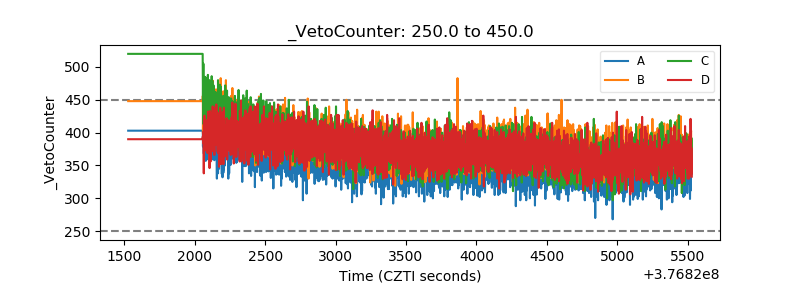 |