| Param | Original file | Final file |
|---|---|---|
| Filename | modeM0/AS1A11_060T01_9000004808_33530cztM0_level2.evt | modeM0/AS1A11_060T01_9000004808_33530cztM0_level2_quad_clean.evt |
| Size (bytes) | 153,956,160 | 16,444,800 |
| Size | 146.8 MB | 15.7 MB |
| Events in quadrant A | 790,795 | 95,450 |
| Events in quadrant B | 985,520 | 96,012 |
| Events in quadrant C | 1,031,944 | 95,025 |
| Events in quadrant D | 1,740,242 | 89,743 |
| Mode M0 | |||
|---|---|---|---|
| Quadrant | BADHDUFLAG | Total packets | Discarded packets |
| A | 0 | 3321 | 1 |
| B | 0 | 3898 | 0 |
| C | 0 | 3985 | 0 |
| D | 0 | 6352 | 0 |
| Mode M9 | |||
|---|---|---|---|
| Quadrant | BADHDUFLAG | Total packets | Discarded packets |
| A | 0 | 14 | 0 |
| B | 0 | 14 | 0 |
| C | 0 | 14 | 0 |
| D | 0 | 14 | 0 |
| Mode SS | |||
|---|---|---|---|
| Quadrant | BADHDUFLAG | Total packets | Discarded packets |
| A | 0 | 34 | 0 |
| B | 0 | 34 | 0 |
| C | 0 | 34 | 0 |
| D | 0 | 34 | 0 |
| Quadrant | Total seconds | Saturated seconds | Saturation percentage |
|---|---|---|---|
| A | 1647 | 5 | 0.303582% |
| B | 1647 | 28 | 1.700061% |
| C | 1647 | 47 | 2.853673% |
| D | 1647 | 114 | 6.921676% |
Noise dominated data is calculated using 1-second bins in cleaned event files. If a bin has >2000 counts, and if more than 50% of those come from <1% of pixels, then it is considered to be noise-dominated and hence unusable.
| Quadrant | # 1 sec bins | Bins with >0 counts | Bins with >2000 counts | High rate bins dominated by noise | Noise dominated (total time) | Noise dominated (detector-on time) | Marked lightcurve |
|---|---|---|---|---|---|---|---|
| A | 2959 | 1648 | 0 | 0 | 0.00% | 0.00% | 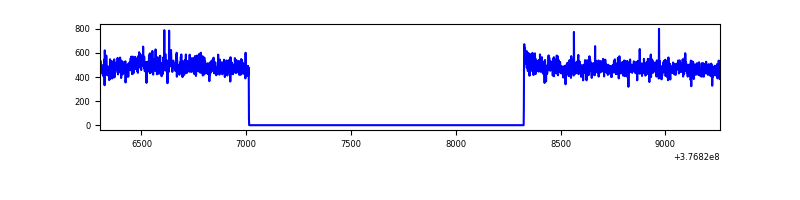 |
| B | 2959 | 1648 | 17 | 17 | 0.57% | 1.03% | 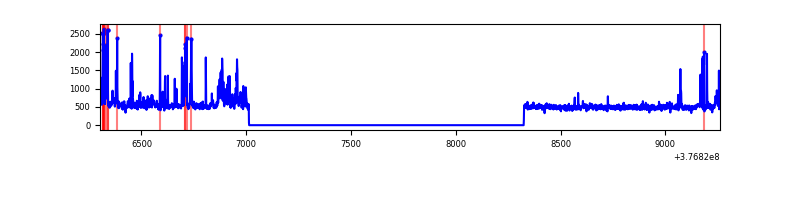 |
| C | 2959 | 1648 | 32 | 32 | 1.08% | 1.94% |  |
| D | 2959 | 1648 | 78 | 78 | 2.64% | 4.73% | 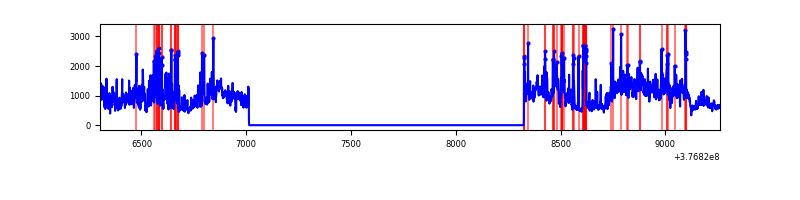 |
Top three noisy pixels from each quadrant. If the there are fewer than three noisy pixels in the level2.evt file, extra rows are filled as -1
| Pixel properties | Quadrant properties | ||||||
|---|---|---|---|---|---|---|---|
| Quadrant | DetID | PixID | Counts | Sigma | Mean | Median | Sigma |
| A | 13 | 254 | 2964 | 64.39 | 203 | 198 | 43.0 |
| A | 10 | 83 | 2573 | 55.29 | 203 | 198 | 43.0 |
| A | 15 | 169 | 2309 | 49.14 | 203 | 198 | 43.0 |
| B | 5 | 172 | 107859 | 2556.97 | 202 | 196 | 42.1 |
| B | 0 | 213 | 39906 | 943.1 | 202 | 196 | 42.1 |
| B | 5 | 255 | 18572 | 436.42 | 202 | 196 | 42.1 |
| C | 0 | 10 | 129221 | 2678.73 | 200 | 201 | 48.2 |
| C | 15 | 214 | 78488 | 1625.41 | 200 | 201 | 48.2 |
| C | 3 | 233 | 21556 | 443.38 | 200 | 201 | 48.2 |
| D | 8 | 195 | 544171 | 10291.11 | 195 | 190 | 52.9 |
| D | 13 | 249 | 123262 | 2328.29 | 195 | 190 | 52.9 |
| D | 2 | 249 | 87088 | 1643.95 | 195 | 190 | 52.9 |
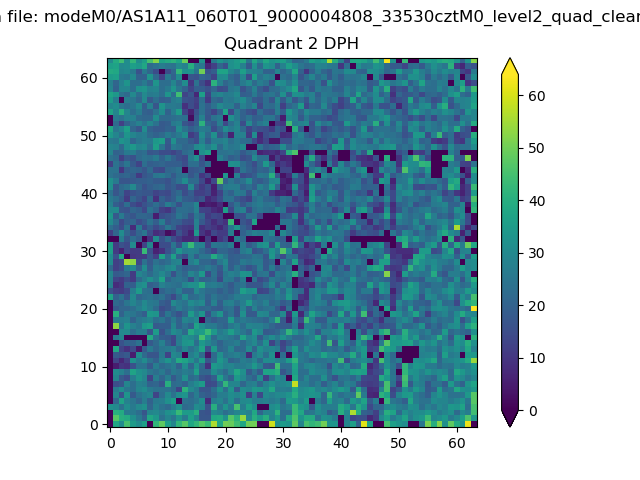
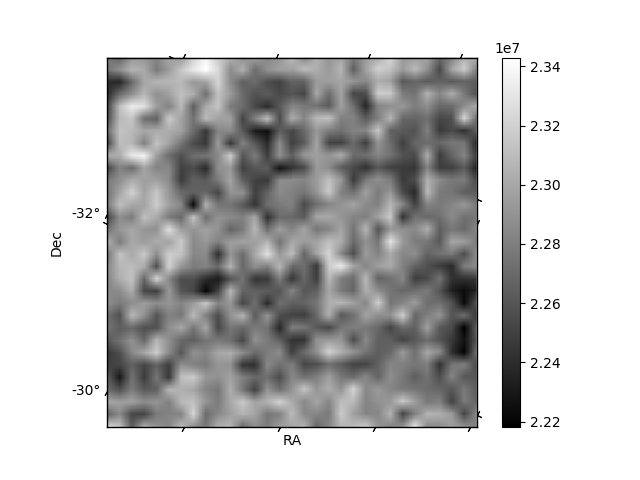
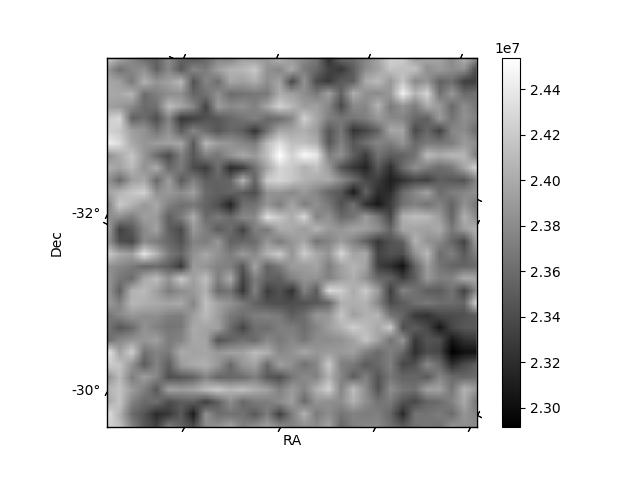
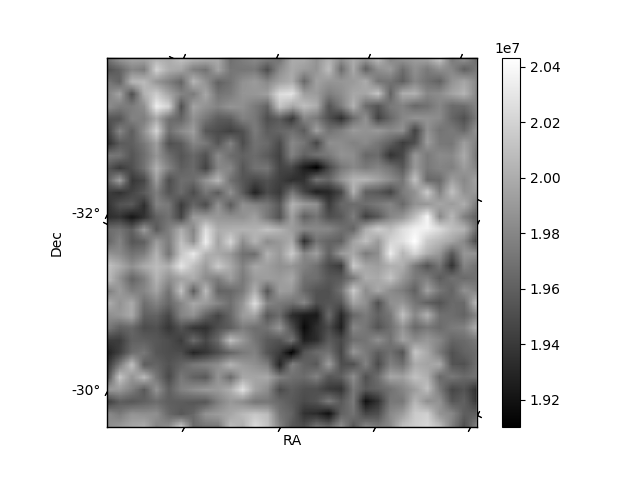
Histogram calculated using DETX and DETY for each event in the final _common_clean file
| Quadrant A | 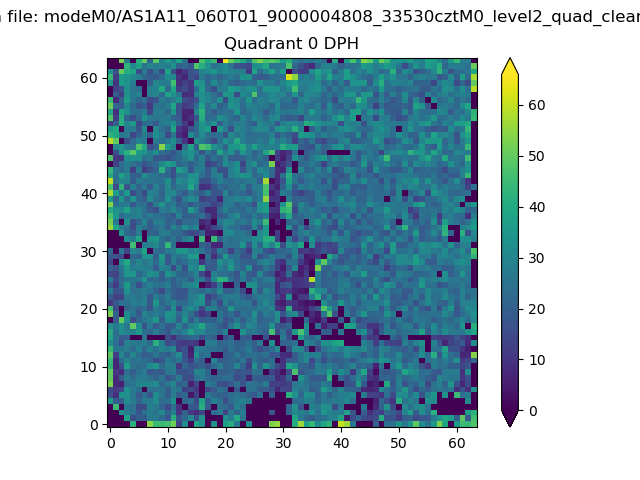 |
 |
Quadrant B |
|---|---|---|---|
| Quadrant D | 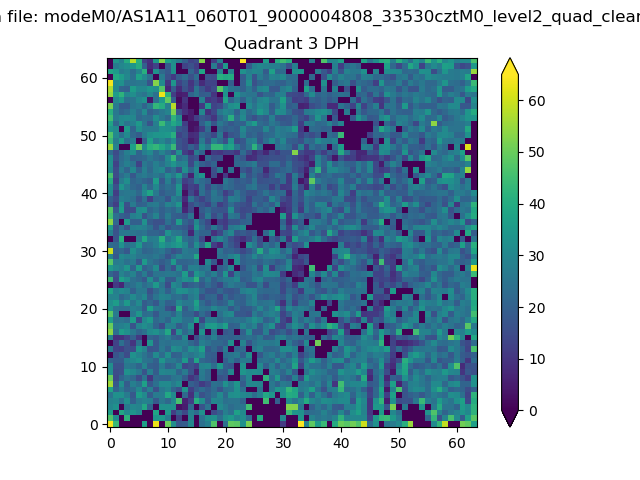 |
 |
Quadrant C |
| Plot type | Count rate plots | Images |
|---|---|---|
| Comparison with Poisson distribution Blue bars denote a histogram of data divided into 1 sec bins. Red curve is a Poisson curve with rate = median count rate of data. |
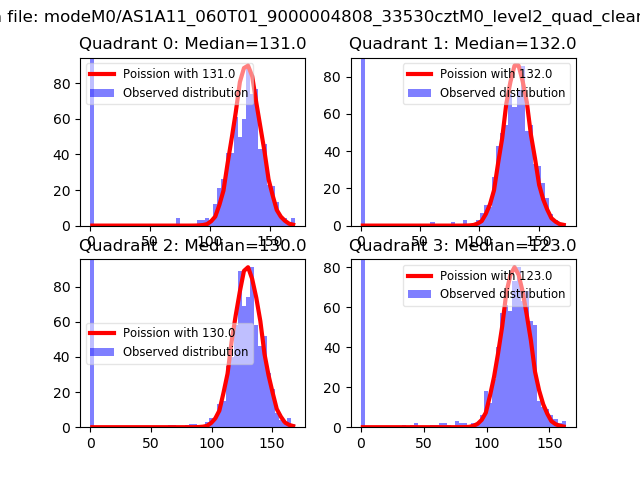 |
 |
| Quadrant-wise count rates Data is divided into 100 sec bins |
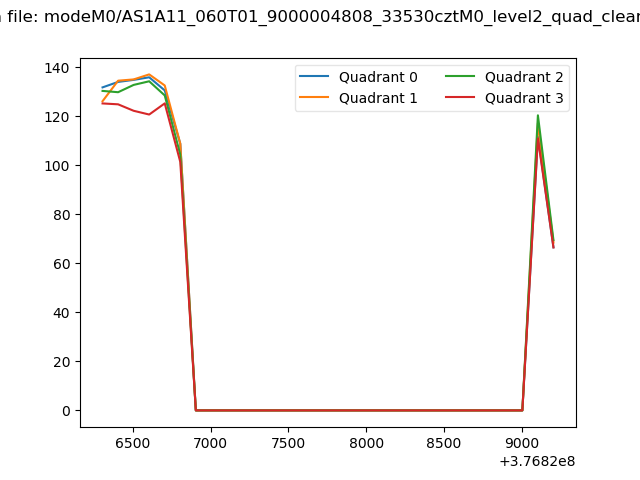 |
|
| Module-wise count rates for Quadrant A Data is divided into 100 sec bins |
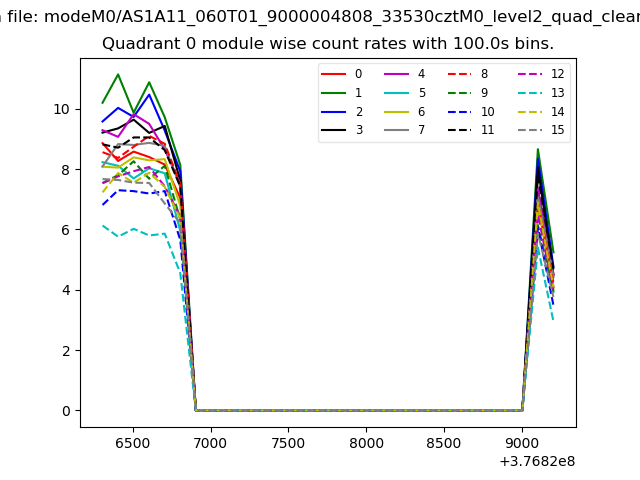 |
 |
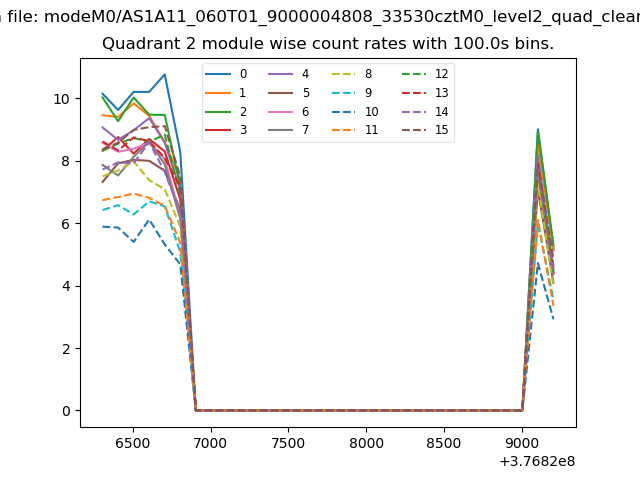
| Module-wise count rates for Quadrant B Data is divided into 100 sec bins |
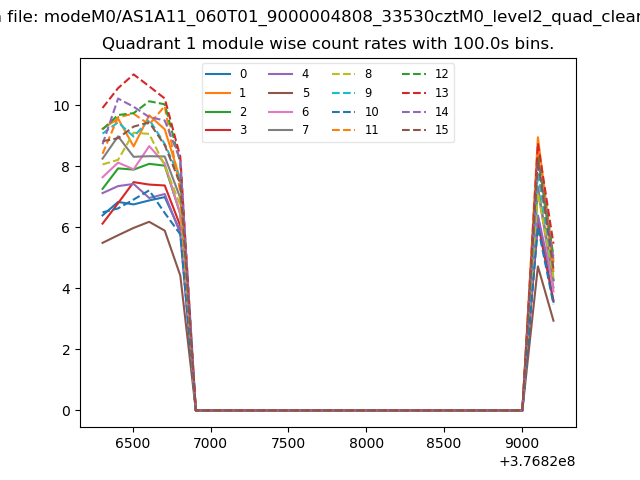 |
 |
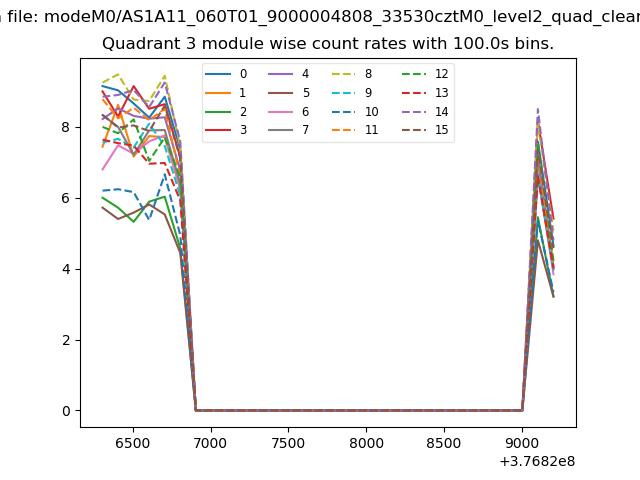
| Module-wise count rates for Quadrant C Data is divided into 100 sec bins |
 |
 |
| Module-wise count rates for Quadrant D Data is divided into 100 sec bins |
 |
 |
| Parameter | Plot |
|---|---|
| CZT HV Monitor |  |
| D_VDD | 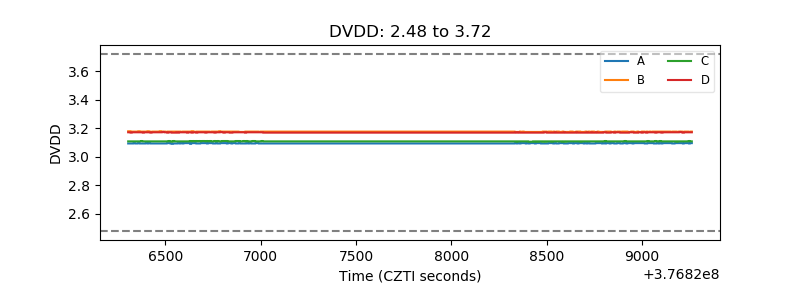 |
| Temperature 1 | 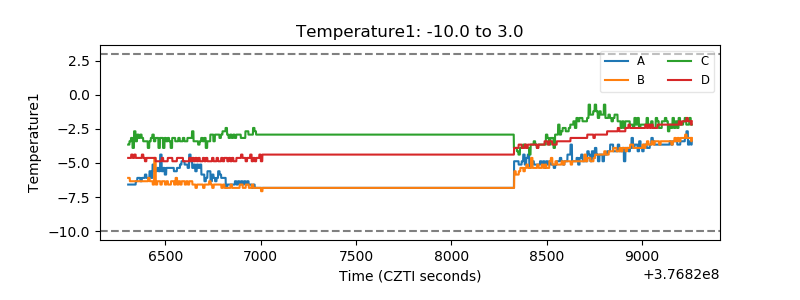 |
| Veto HV Monitor | 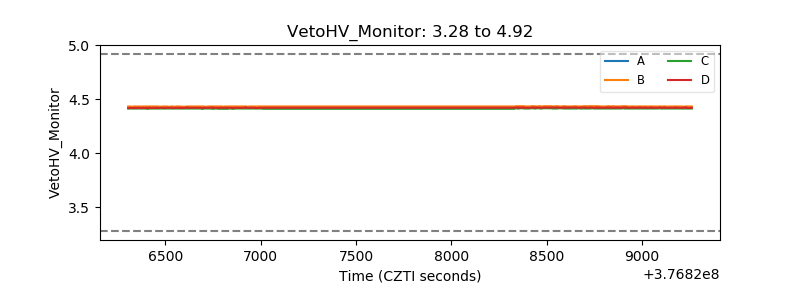 |
| Veto LLD | 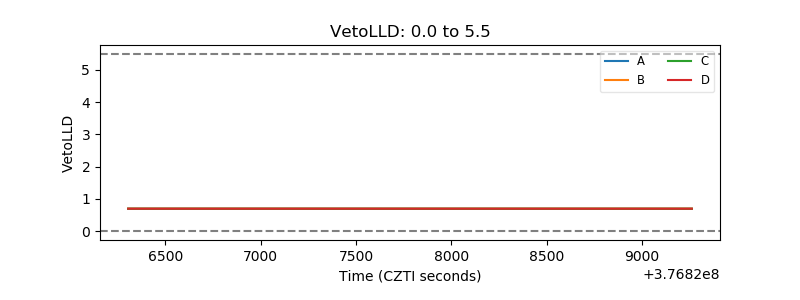 |
| Alpha Counter | 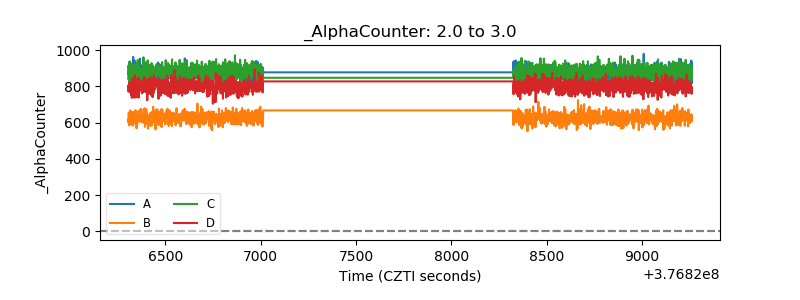 |
| _CPM_Rate | 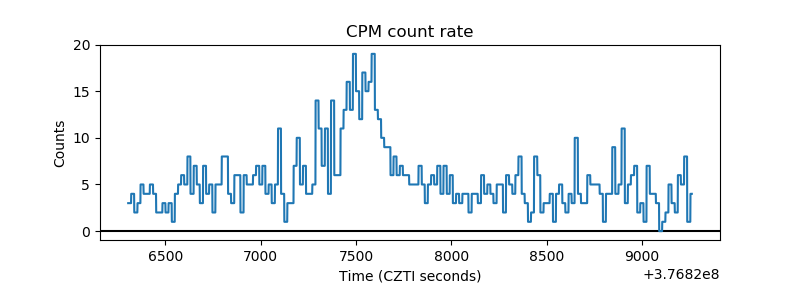 |
| CZT Counter | 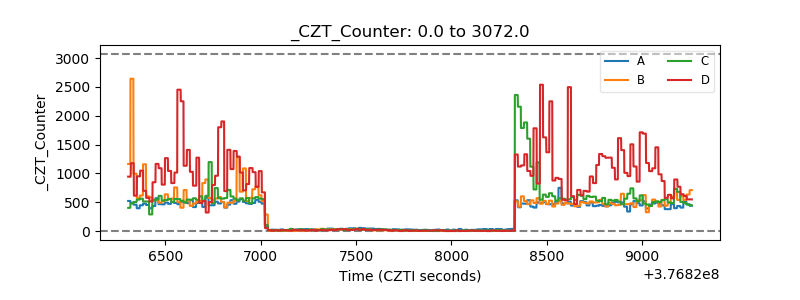 |
| +2.5 Volts monitor |  |
| +5 Volts monitor |  |
| _ROLL_ROT |  |
| _Roll_DEC | 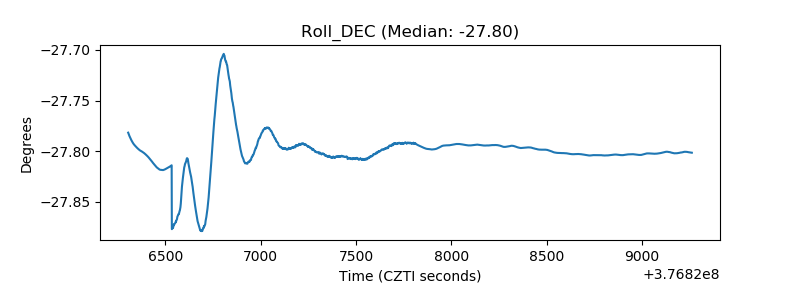 |
| _Roll_RA | 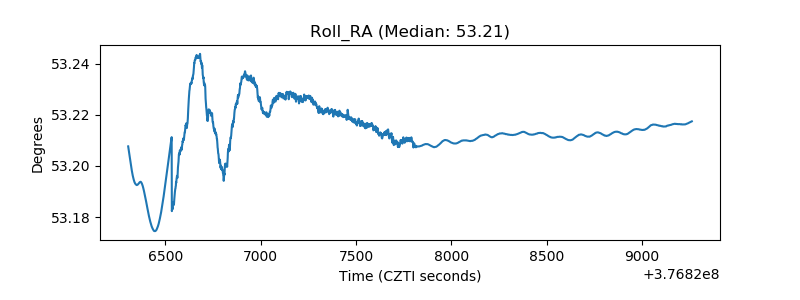 |
| Veto Counter |  |