| Param | Original file | Final file |
|---|---|---|
| Filename | modeM0/AS1A11_060T01_9000004808_33533cztM0_level2.evt | modeM0/AS1A11_060T01_9000004808_33533cztM0_level2_quad_clean.evt |
| Size (bytes) | 1,339,706,880 | 224,294,400 |
| Size | 1.2 GB | 213.9 MB |
| Events in quadrant A | 7,082,336 | 1,473,055 |
| Events in quadrant B | 10,224,304 | 1,429,067 |
| Events in quadrant C | 8,511,782 | 1,441,694 |
| Events in quadrant D | 13,705,351 | 1,375,197 |
| Mode M0 | |||
|---|---|---|---|
| Quadrant | BADHDUFLAG | Total packets | Discarded packets |
| A | 0 | 31355 | 4 |
| B | 0 | 40402 | 3 |
| C | 0 | 34708 | 3 |
| D | 0 | 51382 | 3 |
| Mode M9 | |||
|---|---|---|---|
| Quadrant | BADHDUFLAG | Total packets | Discarded packets |
| A | 0 | 53 | 0 |
| B | 0 | 53 | 0 |
| C | 0 | 53 | 0 |
| D | 0 | 54 | 0 |
| Mode SS | |||
|---|---|---|---|
| Quadrant | BADHDUFLAG | Total packets | Discarded packets |
| A | 0 | 316 | 0 |
| B | 0 | 316 | 0 |
| C | 0 | 316 | 0 |
| D | 0 | 316 | 0 |
| Quadrant | Total seconds | Saturated seconds | Saturation percentage |
|---|---|---|---|
| A | 15575 | 19 | 0.121990% |
| B | 15575 | 873 | 5.605136% |
| C | 15575 | 164 | 1.052970% |
| D | 15575 | 593 | 3.807384% |
Noise dominated data is calculated using 1-second bins in cleaned event files. If a bin has >2000 counts, and if more than 50% of those come from <1% of pixels, then it is considered to be noise-dominated and hence unusable.
| Quadrant | # 1 sec bins | Bins with >0 counts | Bins with >2000 counts | High rate bins dominated by noise | Noise dominated (total time) | Noise dominated (detector-on time) | Marked lightcurve |
|---|---|---|---|---|---|---|---|
| A | 19843 | 15578 | 0 | 0 | 0.00% | 0.00% | 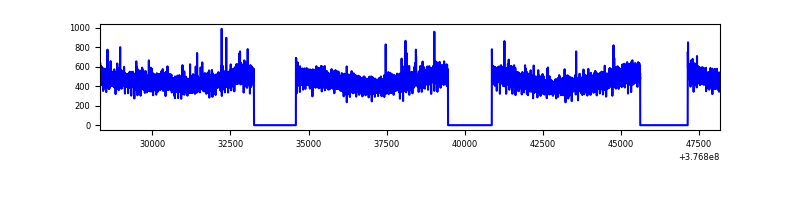 |
| B | 19843 | 15578 | 605 | 605 | 3.05% | 3.88% | 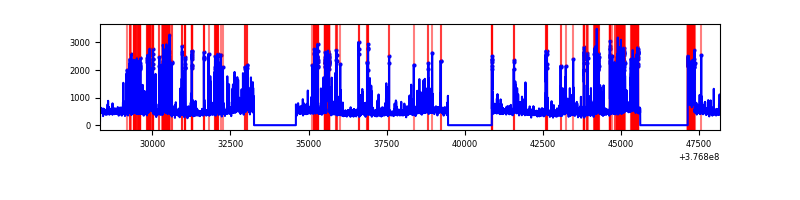 |
| C | 19843 | 15578 | 125 | 125 | 0.63% | 0.80% | 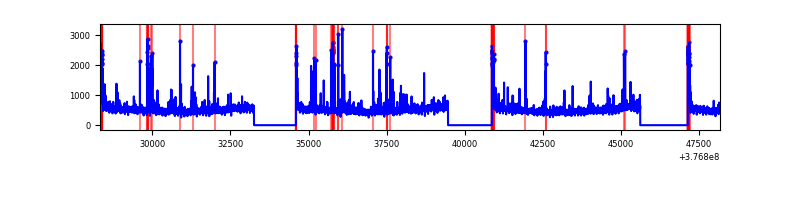 |
| D | 19843 | 15577 | 533 | 533 | 2.69% | 3.42% | 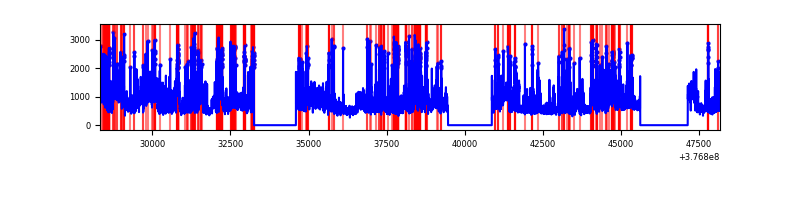 |
Top three noisy pixels from each quadrant. If the there are fewer than three noisy pixels in the level2.evt file, extra rows are filled as -1
| Pixel properties | Quadrant properties | ||||||
|---|---|---|---|---|---|---|---|
| Quadrant | DetID | PixID | Counts | Sigma | Mean | Median | Sigma |
| A | 13 | 254 | 27210 | 70.0 | 1824 | 1791 | 363.1 |
| A | 3 | 137 | 18696 | 46.56 | 1824 | 1791 | 363.1 |
| A | 15 | 169 | 16638 | 40.89 | 1824 | 1791 | 363.1 |
| B | 5 | 172 | 1641659 | 4764.39 | 1773 | 1722 | 344.2 |
| B | 5 | 255 | 1104310 | 3203.27 | 1773 | 1722 | 344.2 |
| B | 0 | 197 | 94702 | 270.13 | 1773 | 1722 | 344.2 |
| C | 15 | 214 | 688426 | 1692.88 | 1759 | 1774 | 405.6 |
| C | 0 | 10 | 461751 | 1134.03 | 1759 | 1774 | 405.6 |
| C | 14 | 254 | 196828 | 480.89 | 1759 | 1774 | 405.6 |
| D | 8 | 195 | 4185631 | 8931.22 | 1728 | 1699 | 468.5 |
| D | 13 | 249 | 826659 | 1761.0 | 1728 | 1699 | 468.5 |
| D | 2 | 250 | 599567 | 1276.24 | 1728 | 1699 | 468.5 |
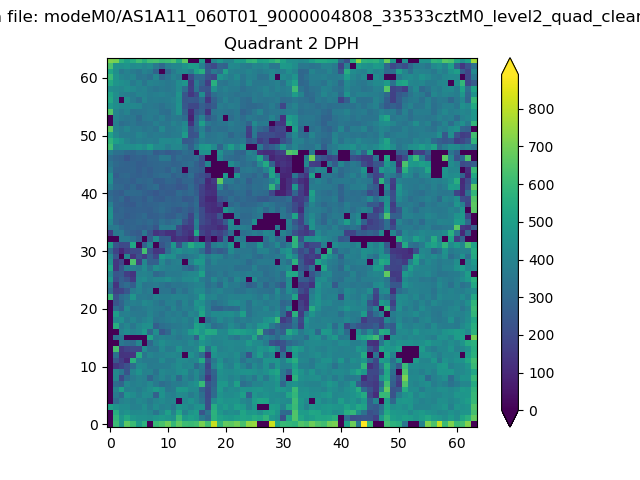
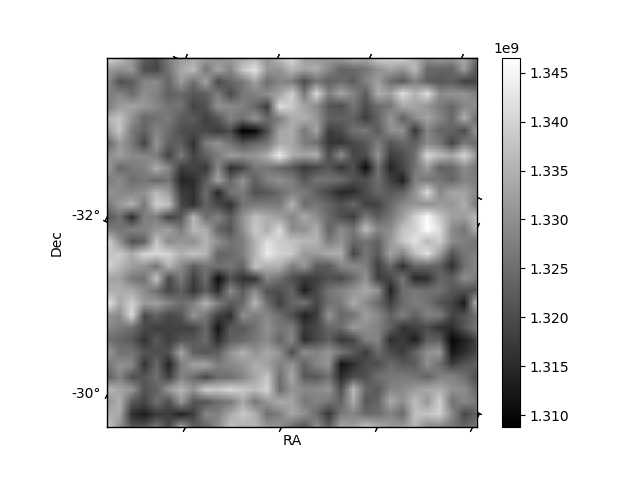
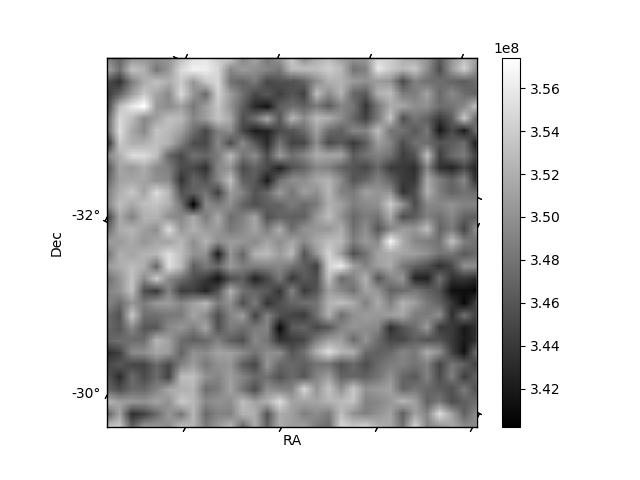
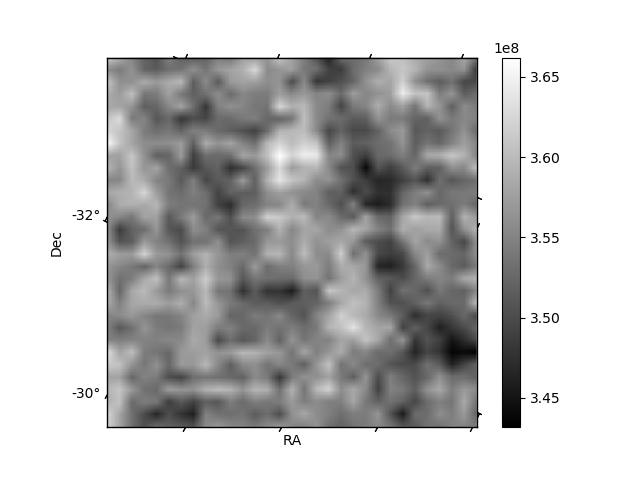
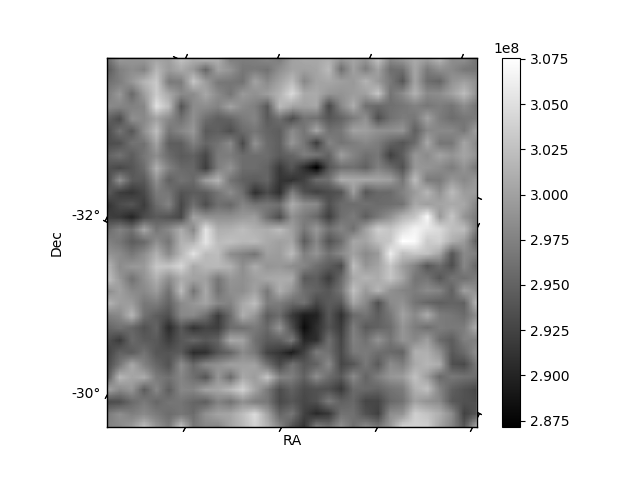
Histogram calculated using DETX and DETY for each event in the final _common_clean file
| Quadrant A | 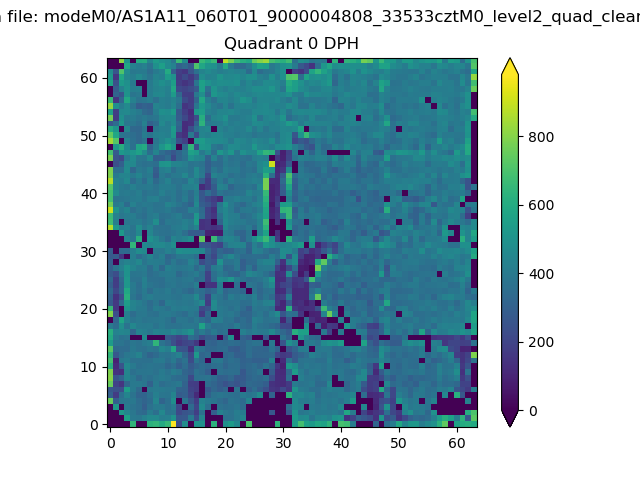 |
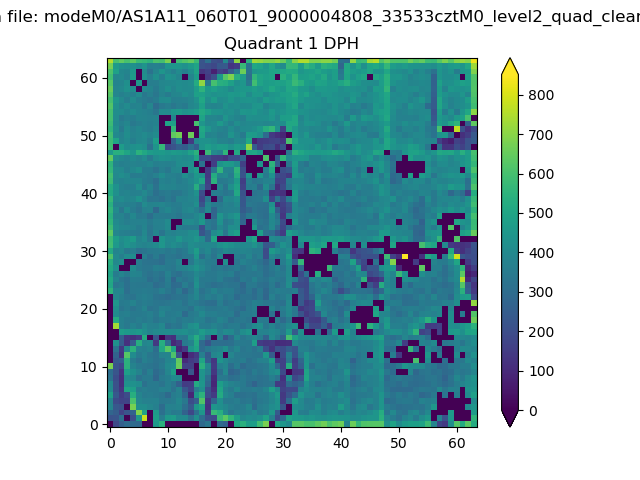 |
Quadrant B |
|---|---|---|---|
| Quadrant D | 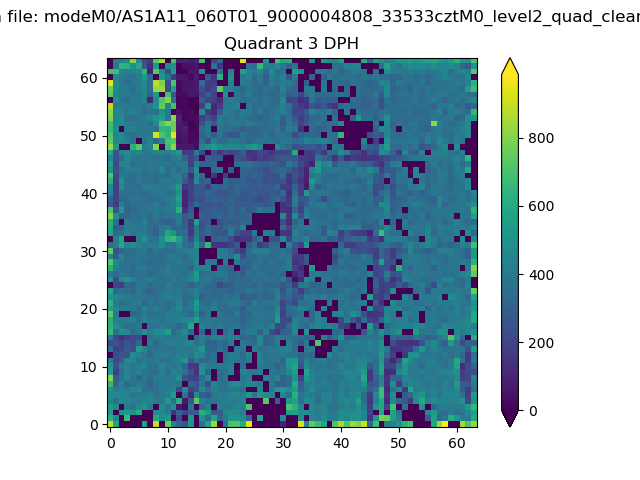 |
 |
Quadrant C |
| Plot type | Count rate plots | Images |
|---|---|---|
| Comparison with Poisson distribution Blue bars denote a histogram of data divided into 1 sec bins. Red curve is a Poisson curve with rate = median count rate of data. |
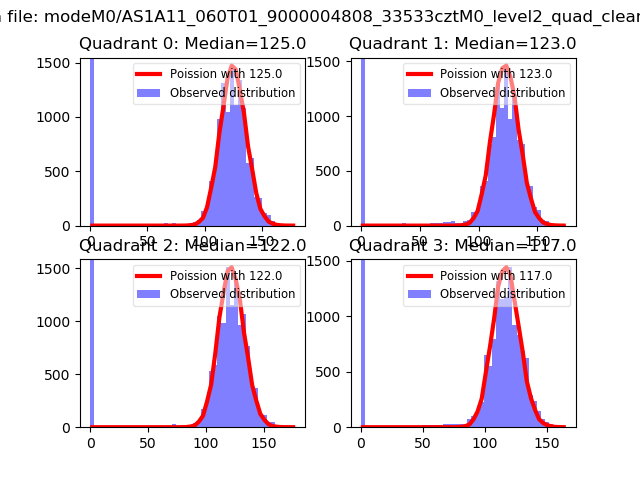 |
 |
| Quadrant-wise count rates Data is divided into 100 sec bins |
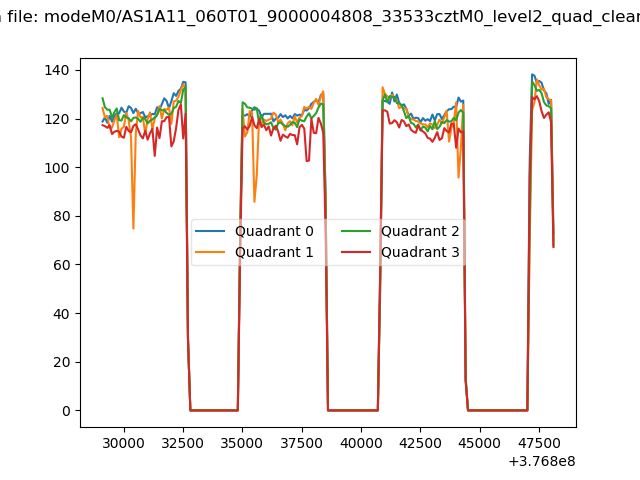 |
|
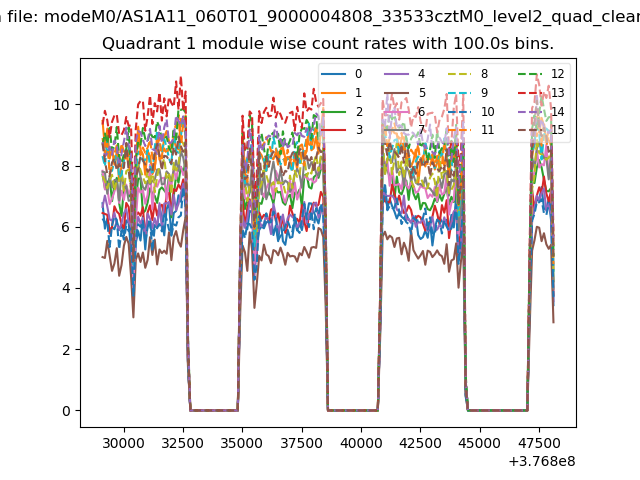
| Module-wise count rates for Quadrant A Data is divided into 100 sec bins |
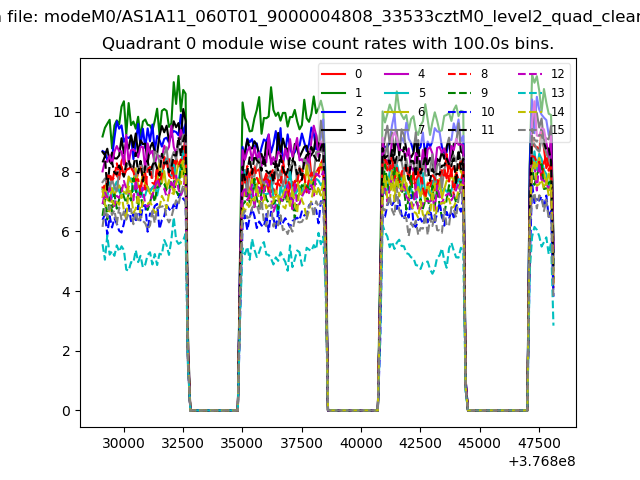 |
 |
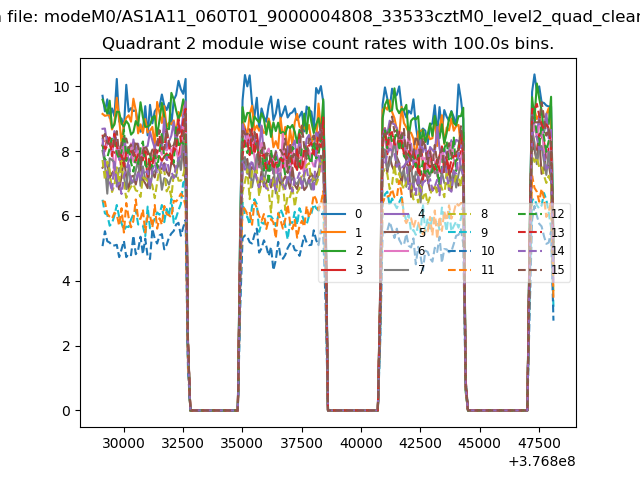
| Module-wise count rates for Quadrant B Data is divided into 100 sec bins |
 |
 |
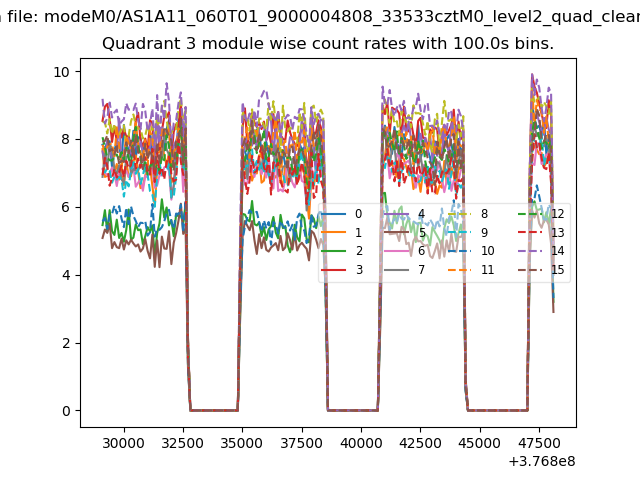
| Module-wise count rates for Quadrant C Data is divided into 100 sec bins |
 |
 |
| Module-wise count rates for Quadrant D Data is divided into 100 sec bins |
 |
 |
| Parameter | Plot |
|---|---|
| CZT HV Monitor | 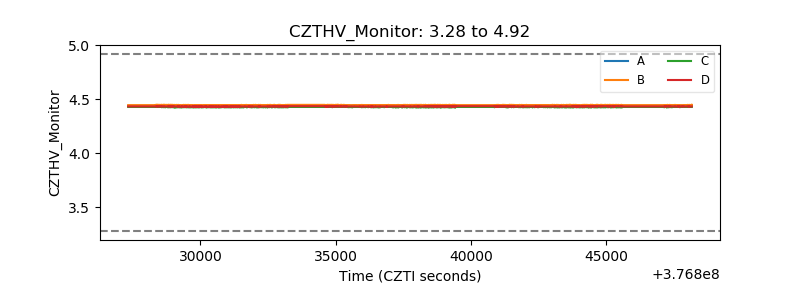 |
| D_VDD | 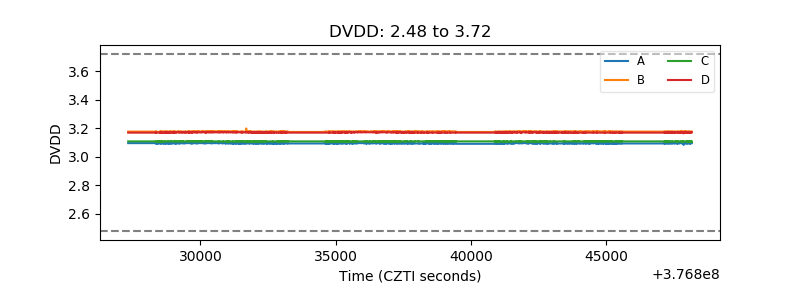 |
| Temperature 1 | 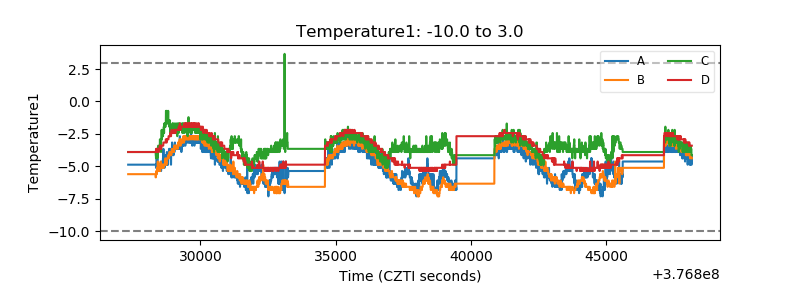 |
| Veto HV Monitor | 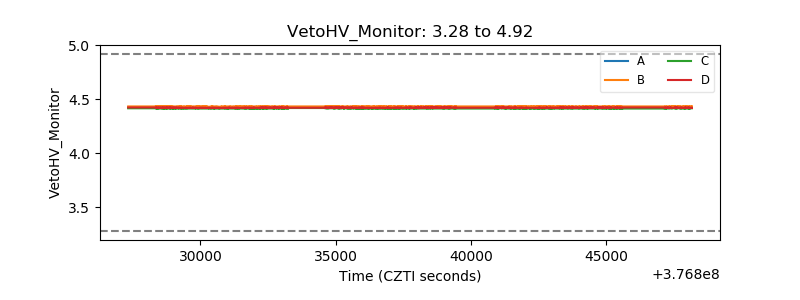 |
| Veto LLD | 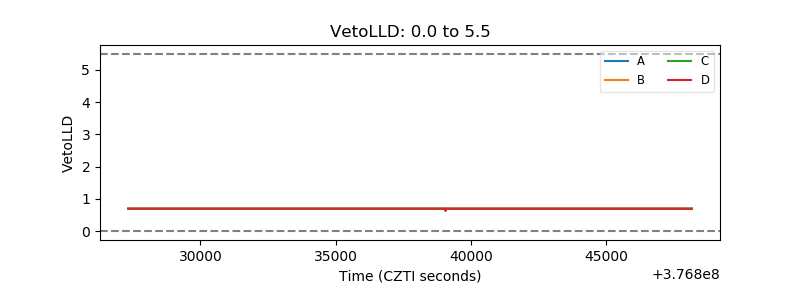 |
| Alpha Counter | 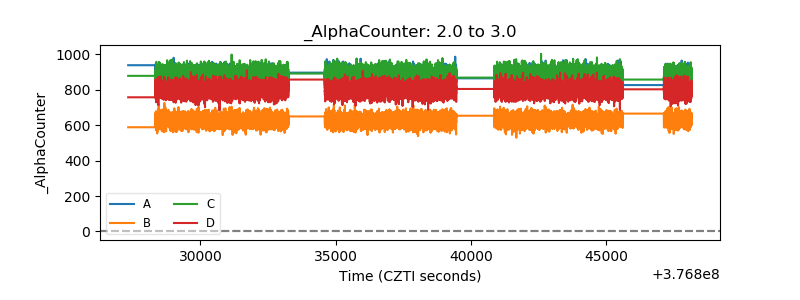 |
| _CPM_Rate | 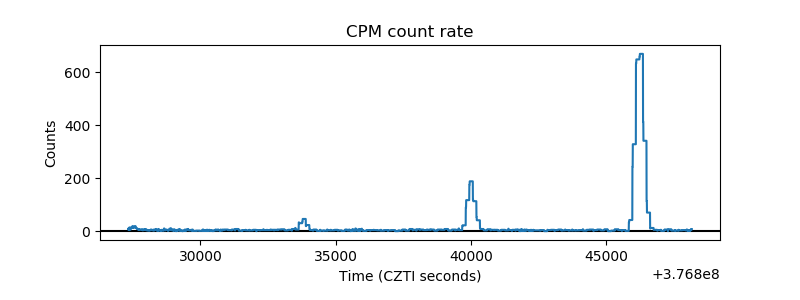 |
| CZT Counter | 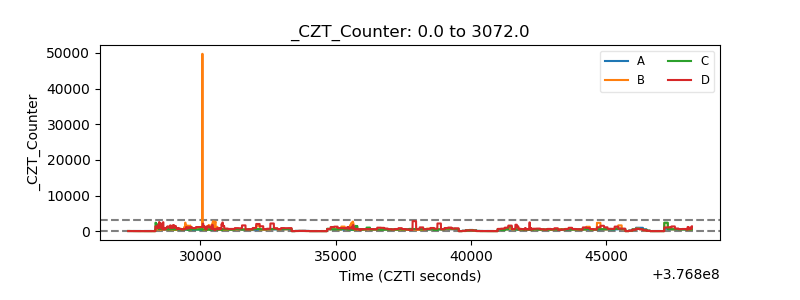 |
| +2.5 Volts monitor | 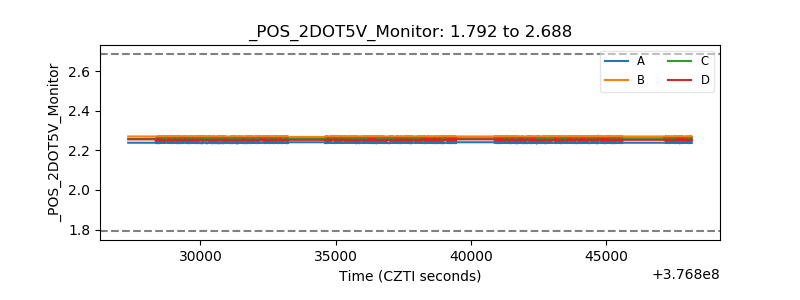 |
| +5 Volts monitor |  |
| _ROLL_ROT | 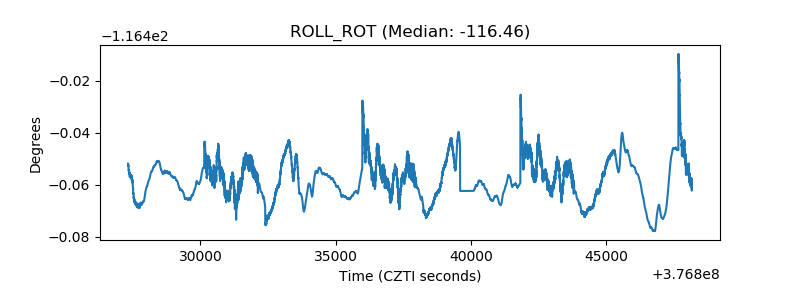 |
| _Roll_DEC | 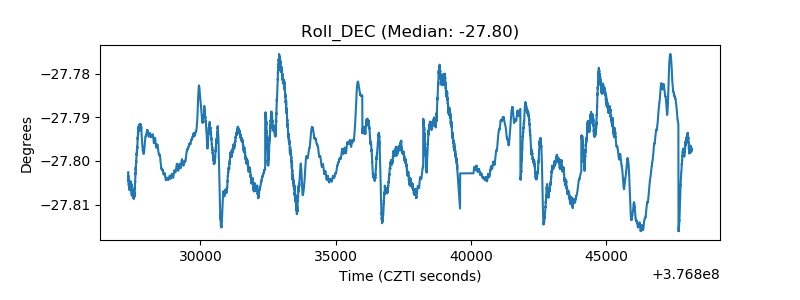 |
| _Roll_RA | 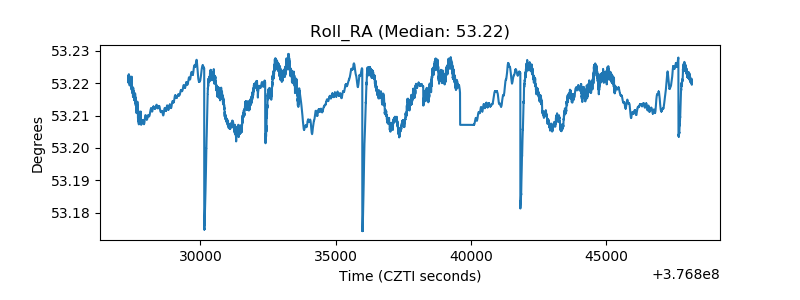 |
| Veto Counter | 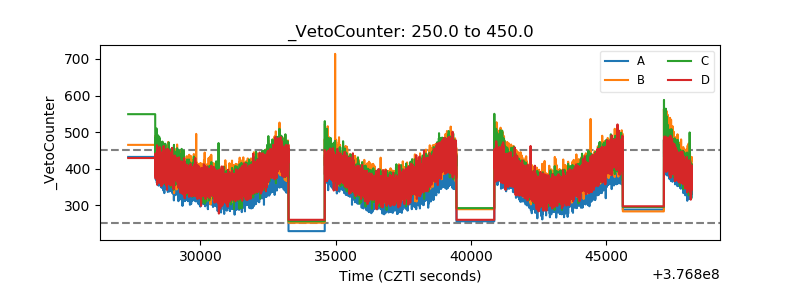 |