| Param | Original file | Final file |
|---|---|---|
| Filename | modeM0/AS1A11_060T01_9000004808_33534cztM0_level2.evt | modeM0/AS1A11_060T01_9000004808_33534cztM0_level2_quad_clean.evt |
| Size (bytes) | 507,041,280 | 81,002,880 |
| Size | 483.6 MB | 77.3 MB |
| Events in quadrant A | 2,939,942 | 533,130 |
| Events in quadrant B | 3,707,216 | 516,268 |
| Events in quadrant C | 3,346,735 | 508,867 |
| Events in quadrant D | 4,968,339 | 488,932 |
| Mode M0 | |||
|---|---|---|---|
| Quadrant | BADHDUFLAG | Total packets | Discarded packets |
| A | 0 | 12605 | 3 |
| B | 0 | 14645 | 2 |
| C | 0 | 13603 | 2 |
| D | 0 | 18710 | 2 |
| Mode M9 | |||
|---|---|---|---|
| Quadrant | BADHDUFLAG | Total packets | Discarded packets |
| A | 0 | 32 | 0 |
| B | 0 | 32 | 0 |
| C | 0 | 32 | 0 |
| D | 0 | 32 | 0 |
| Mode SS | |||
|---|---|---|---|
| Quadrant | BADHDUFLAG | Total packets | Discarded packets |
| A | 0 | 118 | 0 |
| B | 0 | 118 | 0 |
| C | 0 | 118 | 0 |
| D | 0 | 118 | 0 |
| Quadrant | Total seconds | Saturated seconds | Saturation percentage |
|---|---|---|---|
| A | 5811 | 158 | 2.718981% |
| B | 5811 | 395 | 6.797453% |
| C | 5811 | 117 | 2.013423% |
| D | 5811 | 152 | 2.615729% |
Noise dominated data is calculated using 1-second bins in cleaned event files. If a bin has >2000 counts, and if more than 50% of those come from <1% of pixels, then it is considered to be noise-dominated and hence unusable.
| Quadrant | # 1 sec bins | Bins with >0 counts | Bins with >2000 counts | High rate bins dominated by noise | Noise dominated (total time) | Noise dominated (detector-on time) | Marked lightcurve |
|---|---|---|---|---|---|---|---|
| A | 8976 | 5813 | 36 | 36 | 0.40% | 0.62% | 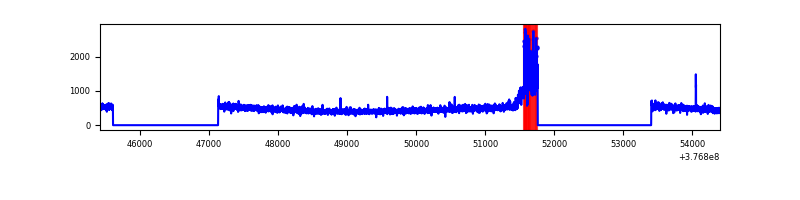 |
| B | 8976 | 5813 | 222 | 222 | 2.47% | 3.82% | 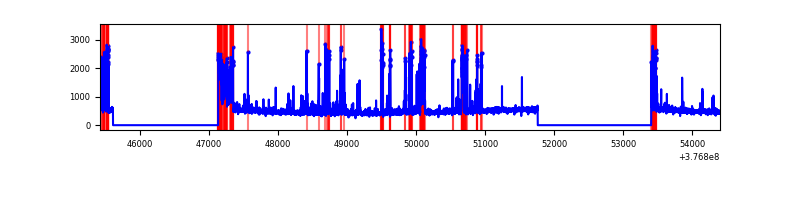 |
| C | 8976 | 5813 | 89 | 89 | 0.99% | 1.53% | 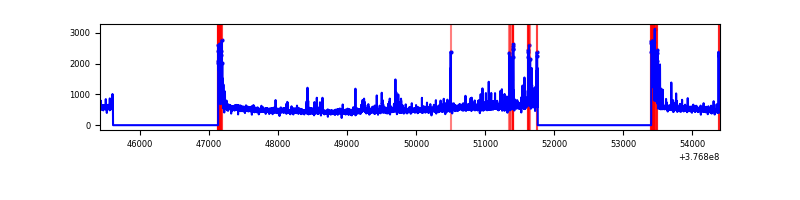 |
| D | 8976 | 5812 | 146 | 146 | 1.63% | 2.51% | 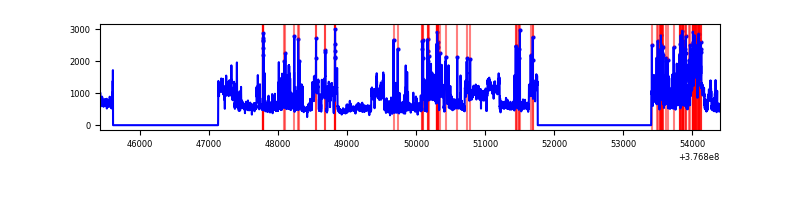 |
Top three noisy pixels from each quadrant. If the there are fewer than three noisy pixels in the level2.evt file, extra rows are filled as -1
| Pixel properties | Quadrant properties | ||||||
|---|---|---|---|---|---|---|---|
| Quadrant | DetID | PixID | Counts | Sigma | Mean | Median | Sigma |
| A | 15 | 169 | 288876 | 2099.84 | 682 | 669 | 137.3 |
| A | 13 | 254 | 10121 | 68.87 | 682 | 669 | 137.3 |
| A | 13 | 6 | 8350 | 55.96 | 682 | 669 | 137.3 |
| B | 5 | 255 | 509209 | 3912.51 | 666 | 648 | 130.0 |
| B | 5 | 172 | 475298 | 3651.62 | 666 | 648 | 130.0 |
| B | 4 | 251 | 41958 | 317.81 | 666 | 648 | 130.0 |
| C | 0 | 10 | 361588 | 2367.92 | 660 | 666 | 152.4 |
| C | 15 | 214 | 251291 | 1644.29 | 660 | 666 | 152.4 |
| C | 14 | 254 | 82025 | 533.78 | 660 | 666 | 152.4 |
| D | 8 | 195 | 1590020 | 9809.25 | 660 | 644 | 162.0 |
| D | 2 | 250 | 468182 | 2885.53 | 660 | 644 | 162.0 |
| D | 15 | 0 | 111365 | 683.34 | 660 | 644 | 162.0 |
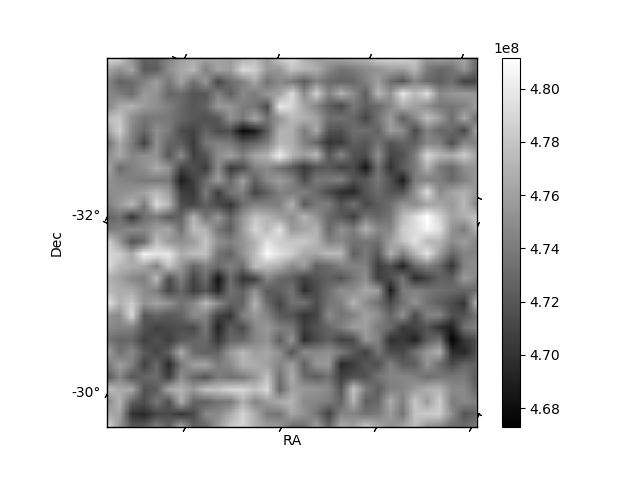
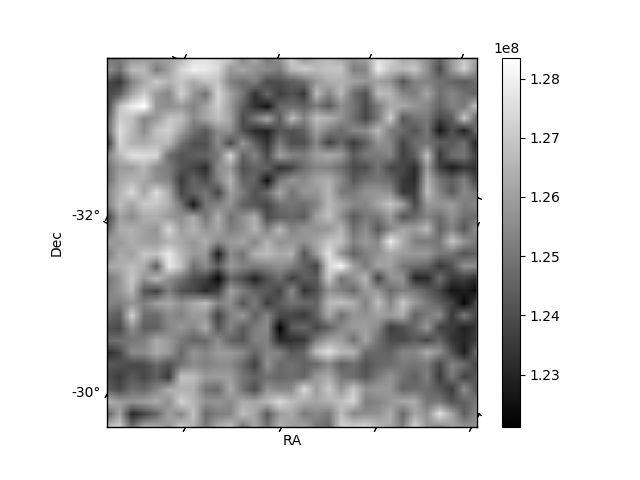
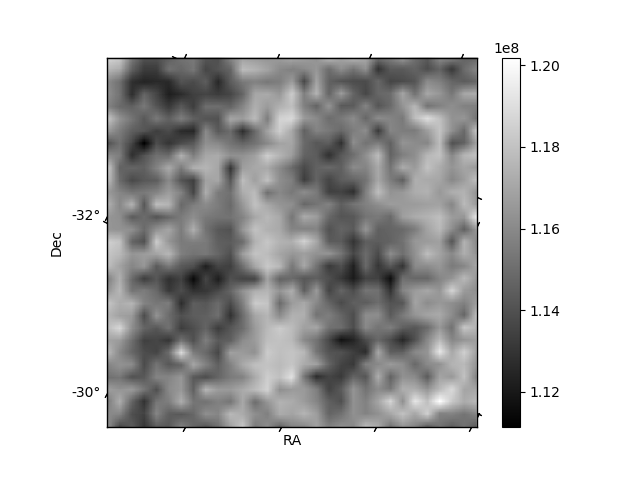
Histogram calculated using DETX and DETY for each event in the final _common_clean file
| Quadrant A | 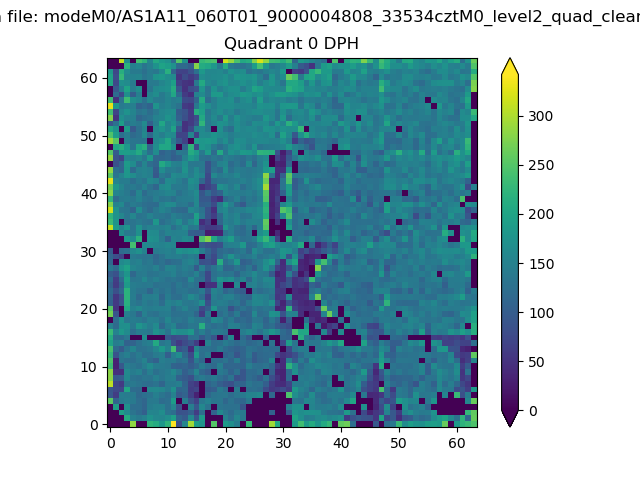 |
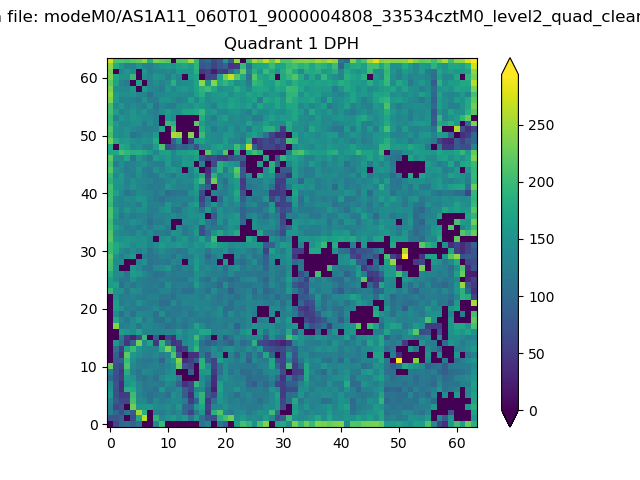 |
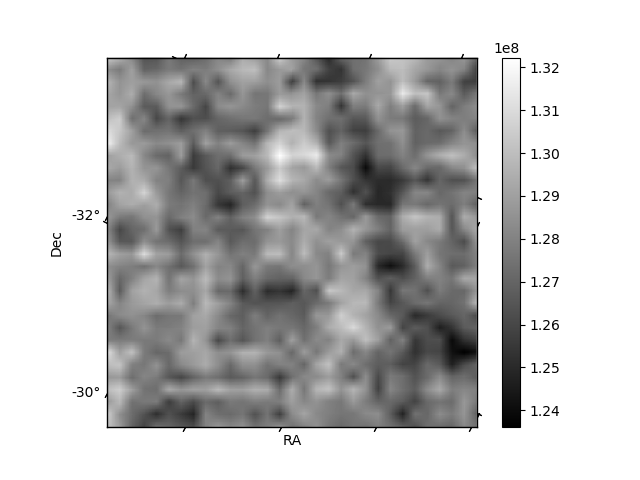
Quadrant B |
|---|---|---|---|
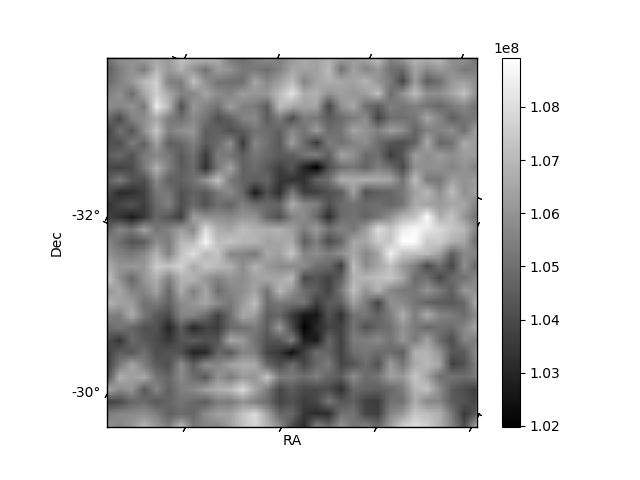
| Quadrant D | 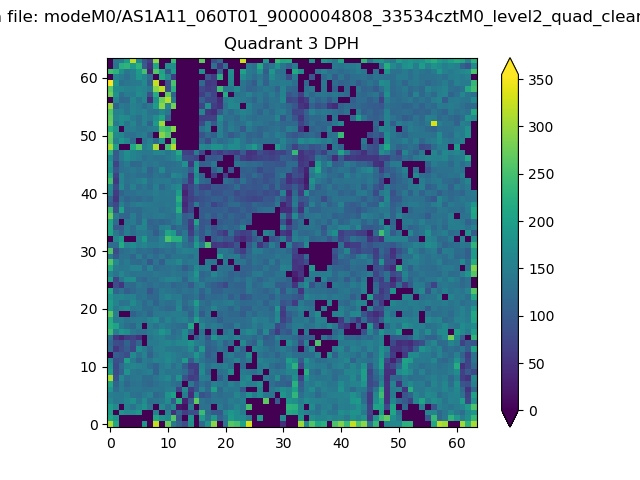 |
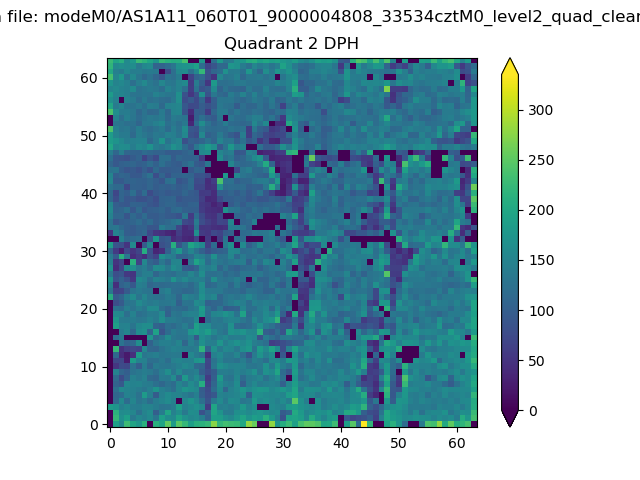 |
Quadrant C |
| Plot type | Count rate plots | Images |
|---|---|---|
| Comparison with Poisson distribution Blue bars denote a histogram of data divided into 1 sec bins. Red curve is a Poisson curve with rate = median count rate of data. |
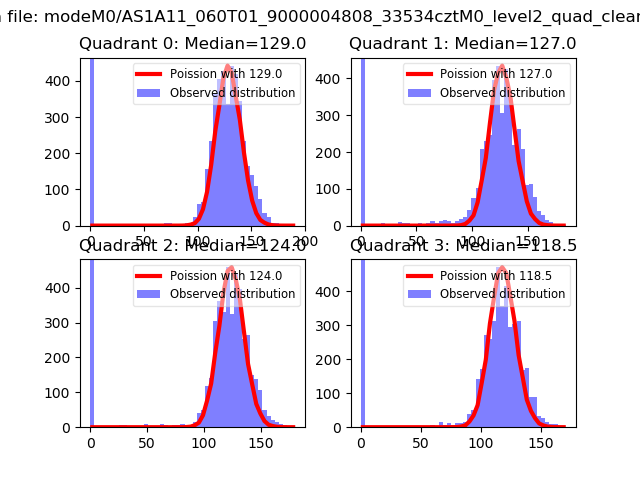 |
 |
| Quadrant-wise count rates Data is divided into 100 sec bins |
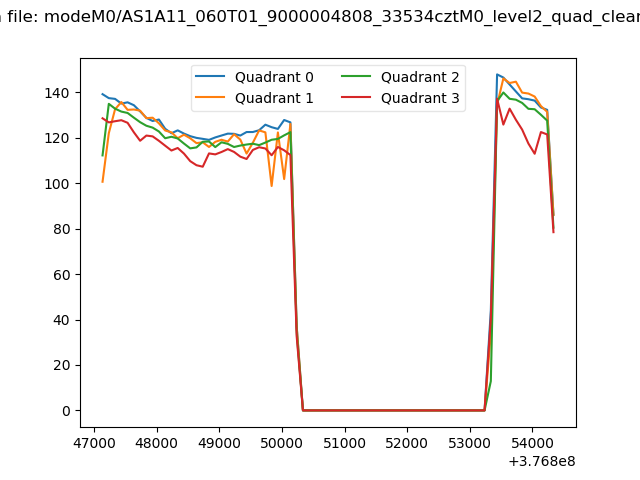 |
|
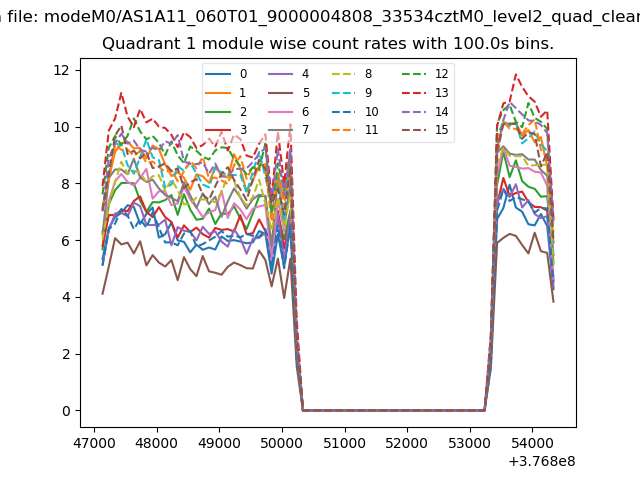
| Module-wise count rates for Quadrant A Data is divided into 100 sec bins |
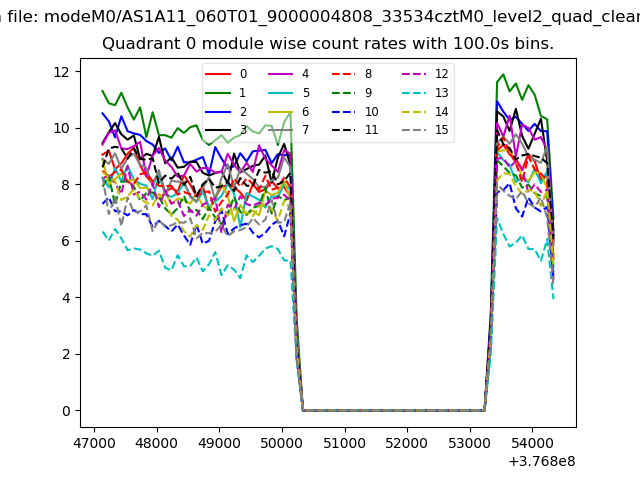 |
 |
| Module-wise count rates for Quadrant B Data is divided into 100 sec bins |
 |
 |
| Module-wise count rates for Quadrant C Data is divided into 100 sec bins |
 |
 |
| Module-wise count rates for Quadrant D Data is divided into 100 sec bins |
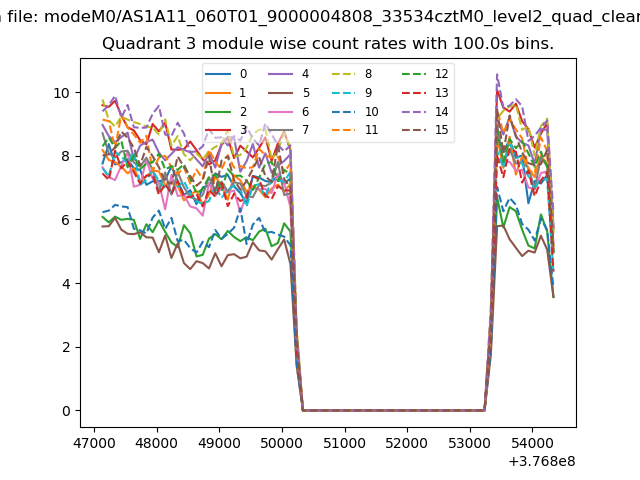 |
 |
| Parameter | Plot |
|---|---|
| CZT HV Monitor | 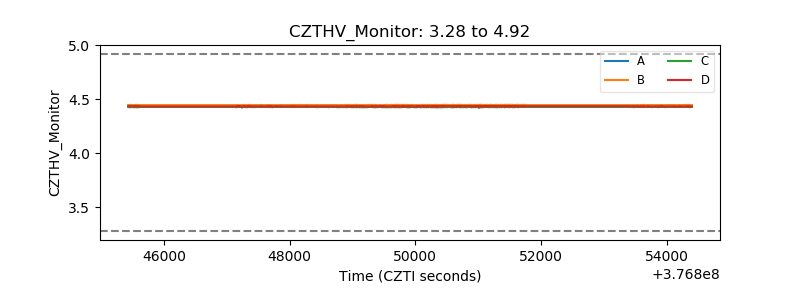 |
| D_VDD |  |
| Temperature 1 |  |
| Veto HV Monitor |  |
| Veto LLD | 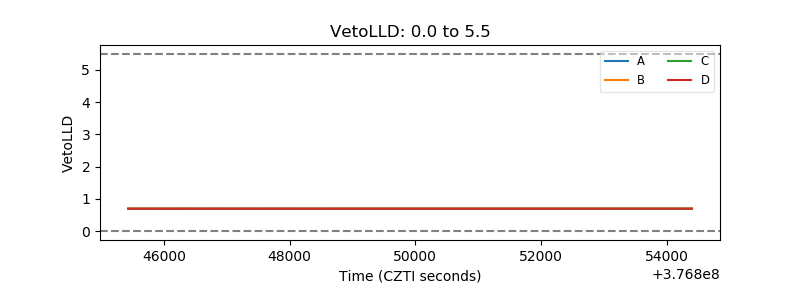 |
| Alpha Counter | 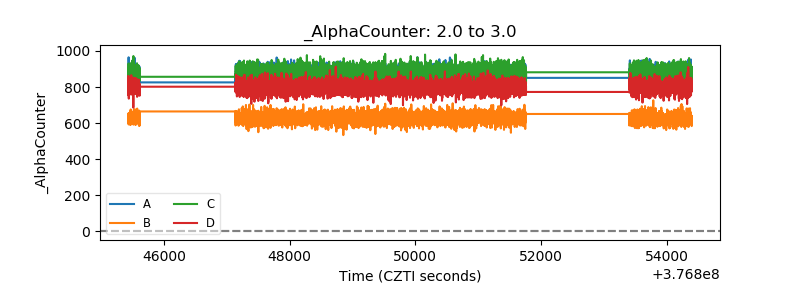 |
| _CPM_Rate | 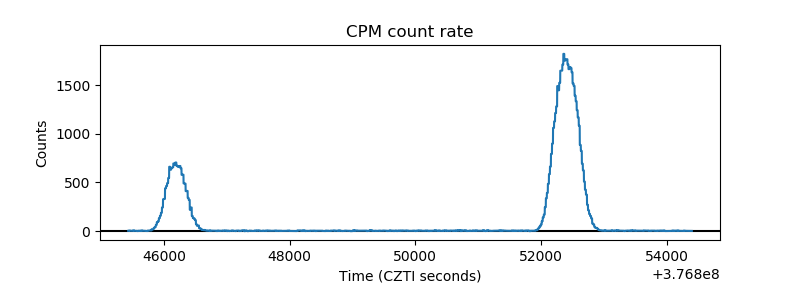 |
| CZT Counter | 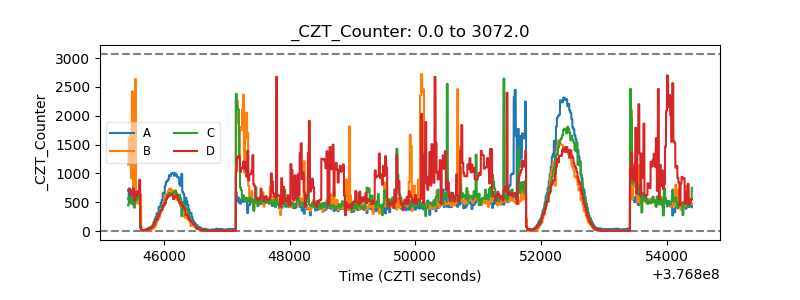 |
| +2.5 Volts monitor |  |
| +5 Volts monitor |  |
| _ROLL_ROT | 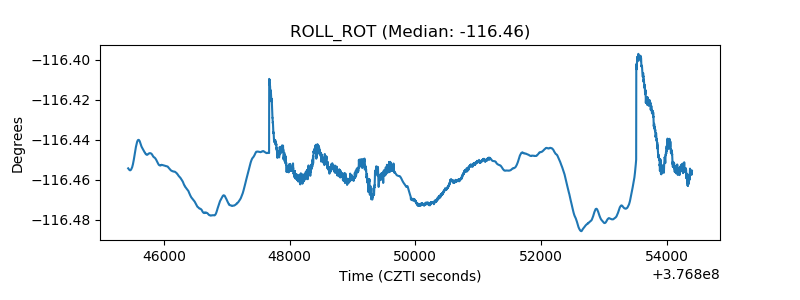 |
| _Roll_DEC | 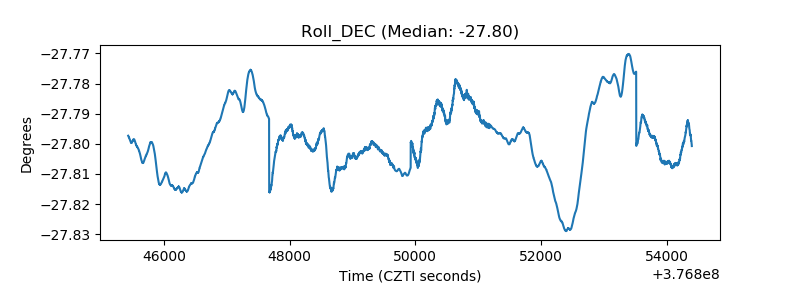 |
| _Roll_RA | 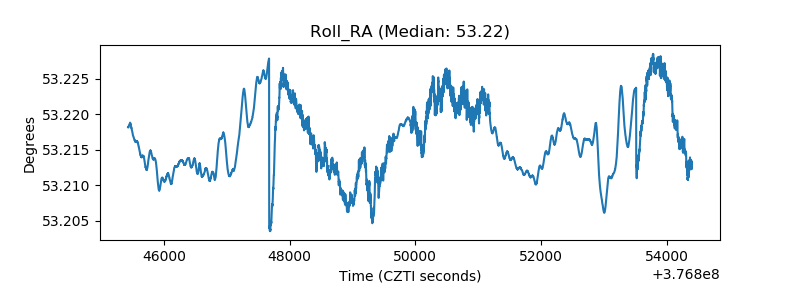 |
| Veto Counter | 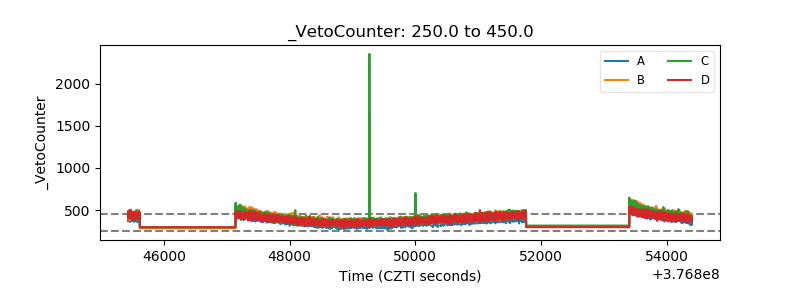 |