| Param | Original file | Final file |
|---|---|---|
| Filename | modeM0/AS1A11_060T01_9000004808_33536cztM0_level2.evt | modeM0/AS1A11_060T01_9000004808_33536cztM0_level2_quad_clean.evt |
| Size (bytes) | 473,696,640 | 73,448,640 |
| Size | 451.8 MB | 70.0 MB |
| Events in quadrant A | 2,520,008 | 482,412 |
| Events in quadrant B | 3,176,167 | 474,629 |
| Events in quadrant C | 3,189,652 | 456,670 |
| Events in quadrant D | 5,098,319 | 436,850 |
| Mode M0 | |||
|---|---|---|---|
| Quadrant | BADHDUFLAG | Total packets | Discarded packets |
| A | 0 | 10916 | 3 |
| B | 0 | 12757 | 2 |
| C | 0 | 12685 | 2 |
| D | 0 | 18805 | 2 |
| Mode M9 | |||
|---|---|---|---|
| Quadrant | BADHDUFLAG | Total packets | Discarded packets |
| A | 0 | 22 | 0 |
| B | 0 | 22 | 0 |
| C | 0 | 22 | 0 |
| D | 0 | 23 | 0 |
| Mode SS | |||
|---|---|---|---|
| Quadrant | BADHDUFLAG | Total packets | Discarded packets |
| A | 0 | 110 | 0 |
| B | 0 | 110 | 0 |
| C | 0 | 110 | 0 |
| D | 0 | 110 | 0 |
| Quadrant | Total seconds | Saturated seconds | Saturation percentage |
|---|---|---|---|
| A | 5328 | 9 | 0.168919% |
| B | 5328 | 197 | 3.697447% |
| C | 5328 | 132 | 2.477477% |
| D | 5328 | 229 | 4.298048% |
Noise dominated data is calculated using 1-second bins in cleaned event files. If a bin has >2000 counts, and if more than 50% of those come from <1% of pixels, then it is considered to be noise-dominated and hence unusable.
| Quadrant | # 1 sec bins | Bins with >0 counts | Bins with >2000 counts | High rate bins dominated by noise | Noise dominated (total time) | Noise dominated (detector-on time) | Marked lightcurve |
|---|---|---|---|---|---|---|---|
| A | 7121 | 5329 | 1 | 1 | 0.01% | 0.02% | 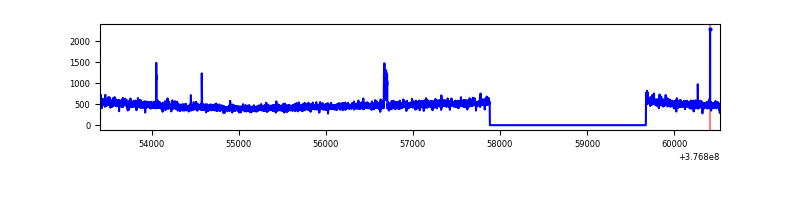 |
| B | 7121 | 5329 | 150 | 150 | 2.11% | 2.81% | 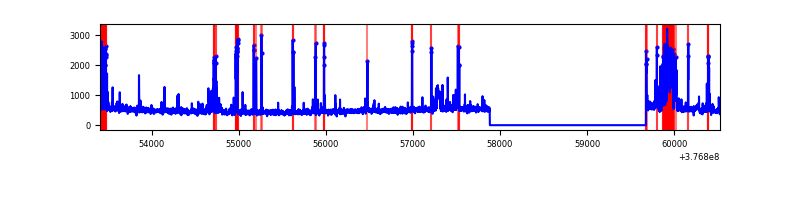 |
| C | 7121 | 5329 | 121 | 121 | 1.70% | 2.27% | 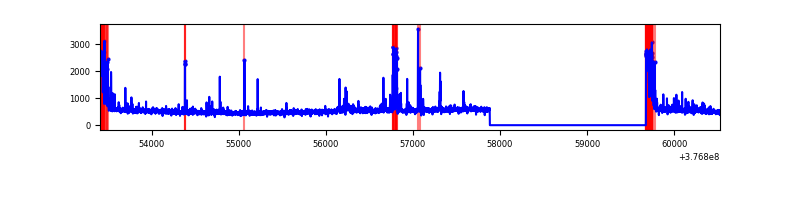 |
| D | 7121 | 5329 | 233 | 233 | 3.27% | 4.37% | 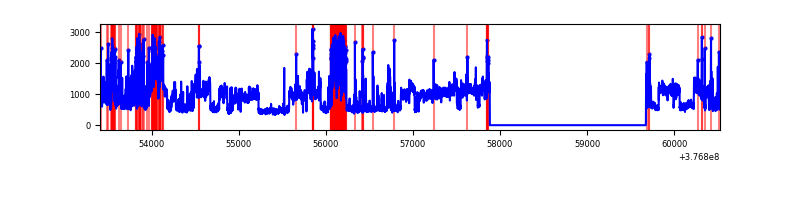 |
Top three noisy pixels from each quadrant. If the there are fewer than three noisy pixels in the level2.evt file, extra rows are filled as -1
| Pixel properties | Quadrant properties | ||||||
|---|---|---|---|---|---|---|---|
| Quadrant | DetID | PixID | Counts | Sigma | Mean | Median | Sigma |
| A | 15 | 169 | 38218 | 293.27 | 639 | 628 | 128.2 |
| A | 13 | 6 | 10929 | 80.36 | 639 | 628 | 128.2 |
| A | 13 | 254 | 9089 | 66.01 | 639 | 628 | 128.2 |
| B | 5 | 172 | 412672 | 3393.17 | 631 | 615 | 121.4 |
| B | 5 | 255 | 177118 | 1453.45 | 631 | 615 | 121.4 |
| B | 4 | 170 | 27552 | 221.82 | 631 | 615 | 121.4 |
| C | 0 | 10 | 403258 | 2853.85 | 609 | 614 | 141.1 |
| C | 15 | 214 | 231060 | 1633.35 | 609 | 614 | 141.1 |
| C | 14 | 254 | 94648 | 666.49 | 609 | 614 | 141.1 |
| D | 8 | 195 | 1745336 | 11878.5 | 604 | 589 | 146.9 |
| D | 2 | 250 | 707620 | 4813.57 | 604 | 589 | 146.9 |
| D | 13 | 249 | 132937 | 901.04 | 604 | 589 | 146.9 |
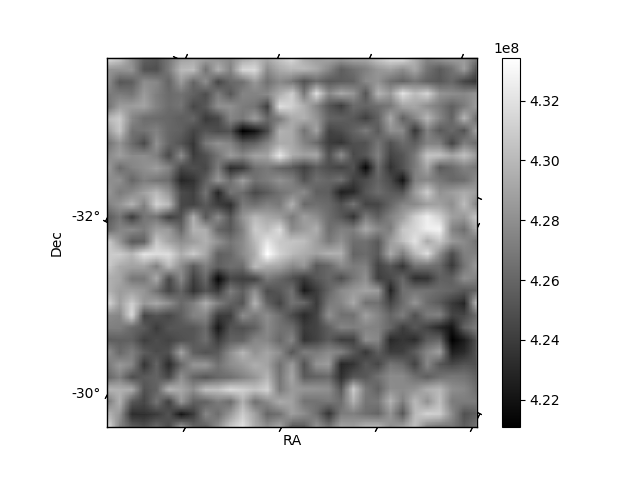
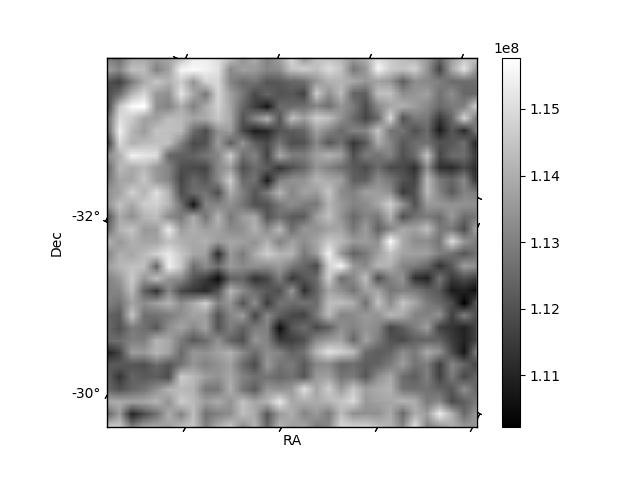
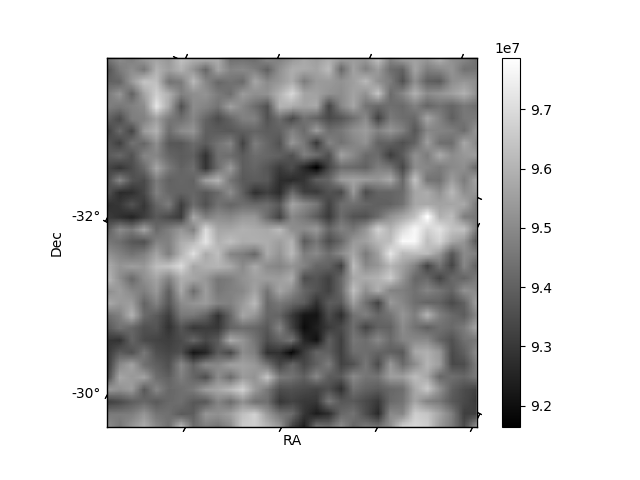
Histogram calculated using DETX and DETY for each event in the final _common_clean file
| Quadrant A | 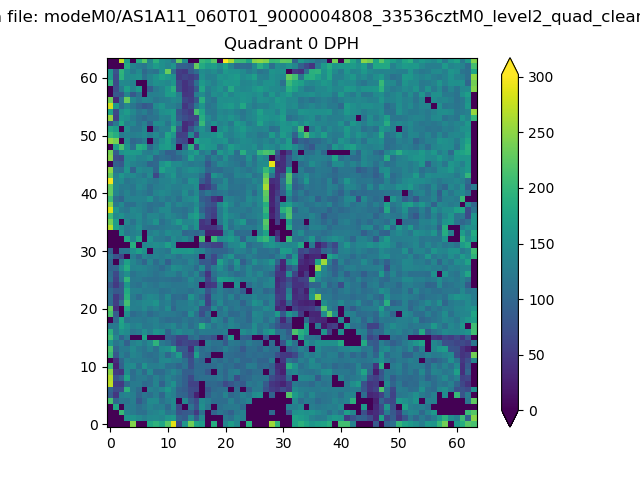 |
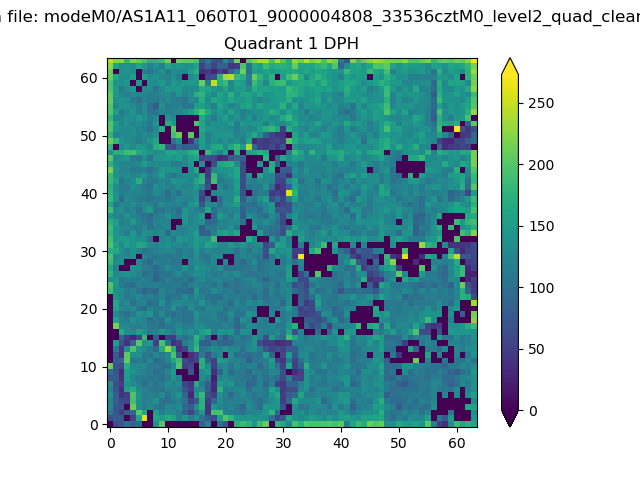 |
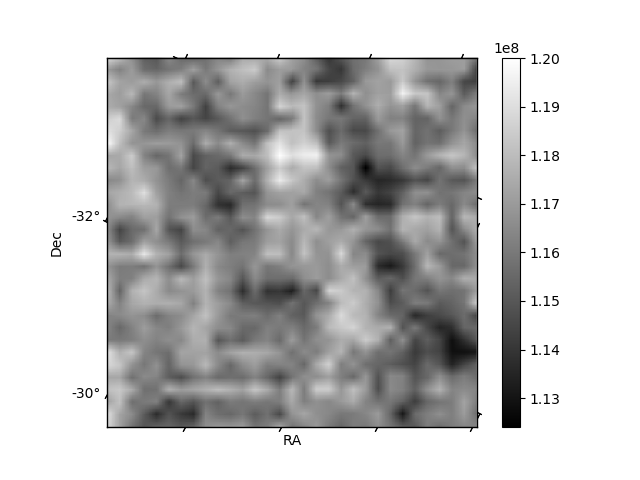
Quadrant B |
|---|---|---|---|
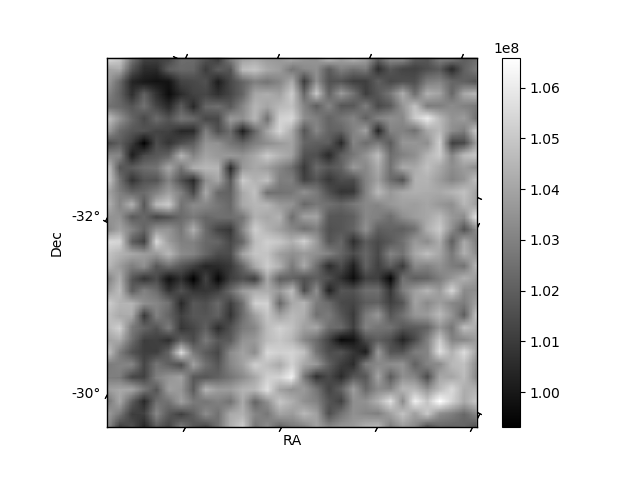
| Quadrant D | 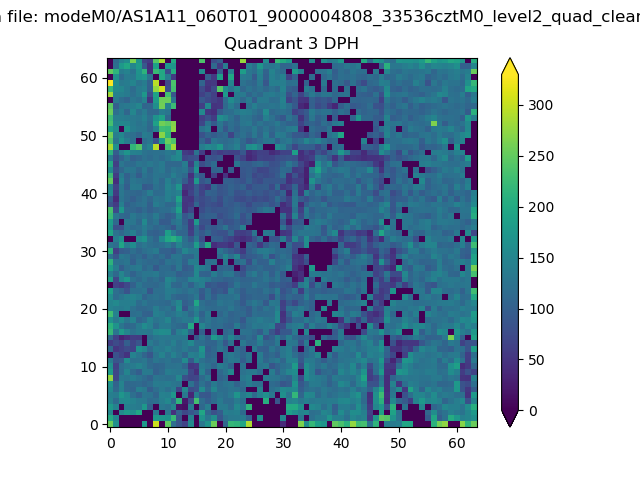 |
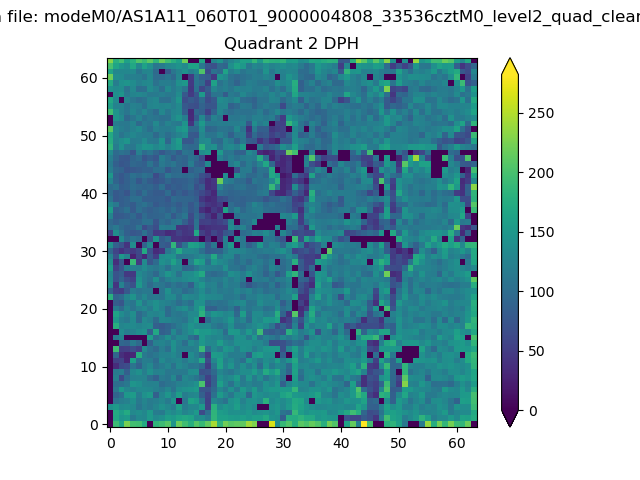 |
Quadrant C |
| Plot type | Count rate plots | Images |
|---|---|---|
| Comparison with Poisson distribution Blue bars denote a histogram of data divided into 1 sec bins. Red curve is a Poisson curve with rate = median count rate of data. |
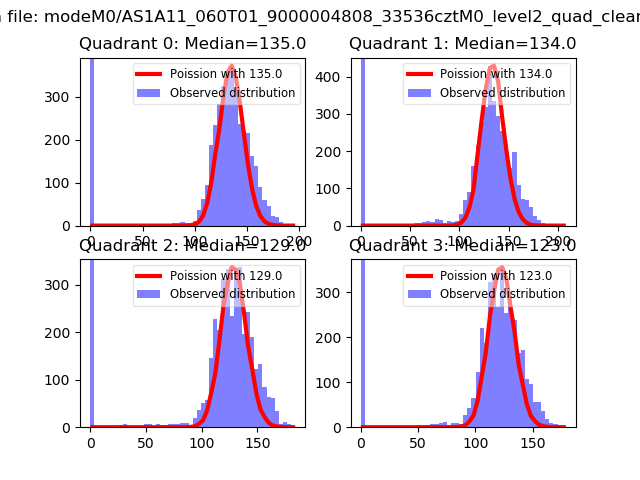 |
 |
| Quadrant-wise count rates Data is divided into 100 sec bins |
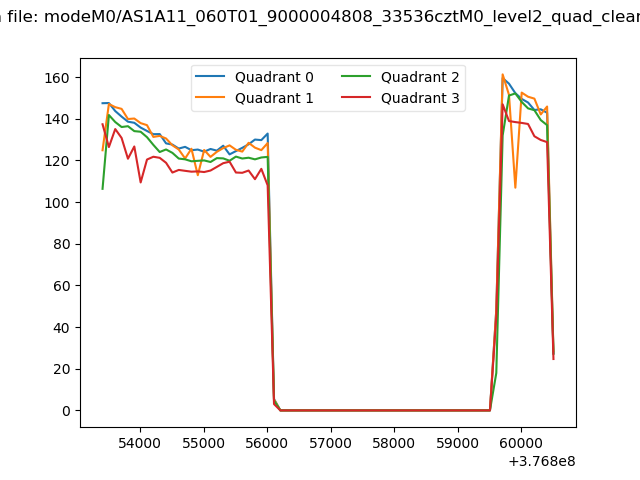 |
|
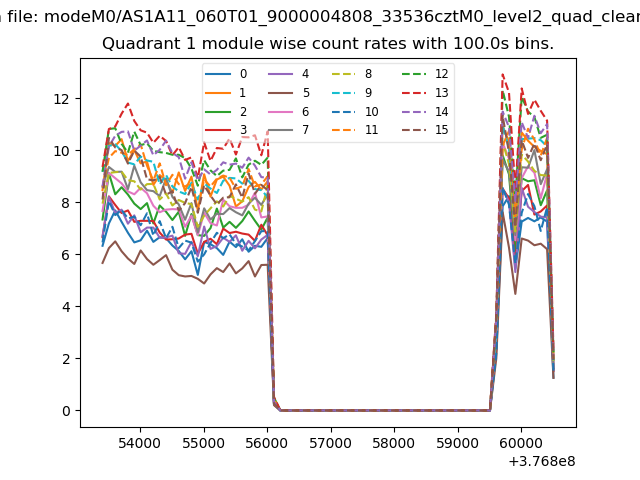
| Module-wise count rates for Quadrant A Data is divided into 100 sec bins |
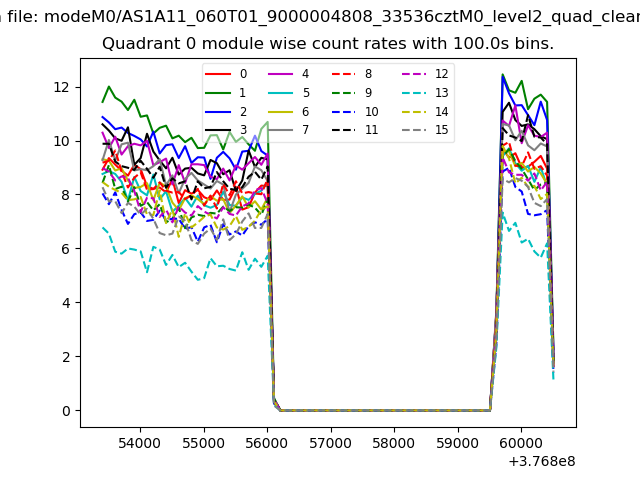 |
 |
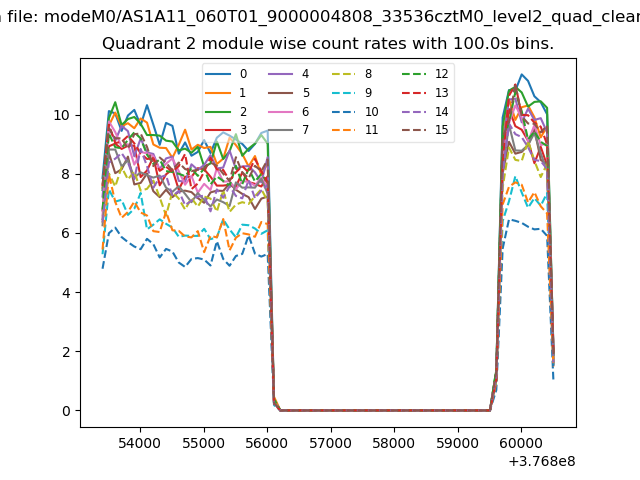
| Module-wise count rates for Quadrant B Data is divided into 100 sec bins |
 |
 |
| Module-wise count rates for Quadrant C Data is divided into 100 sec bins |
 |
 |
| Module-wise count rates for Quadrant D Data is divided into 100 sec bins |
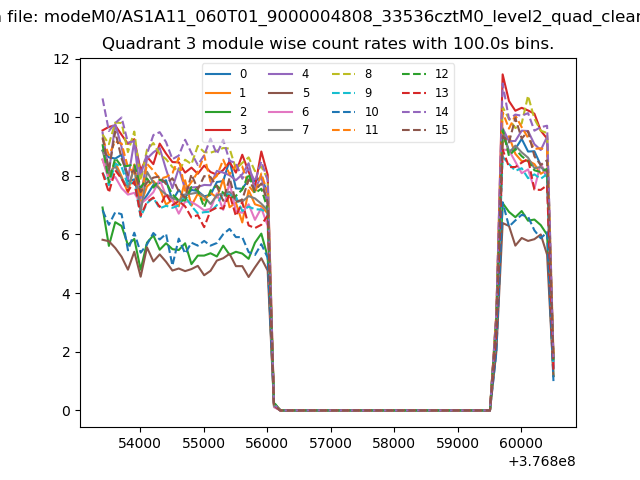 |
 |
| Parameter | Plot |
|---|---|
| CZT HV Monitor | 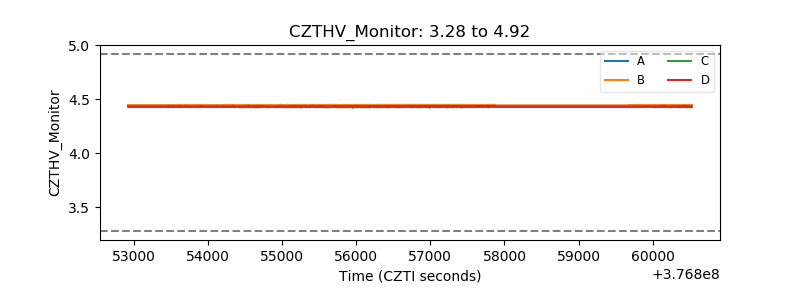 |
| D_VDD | 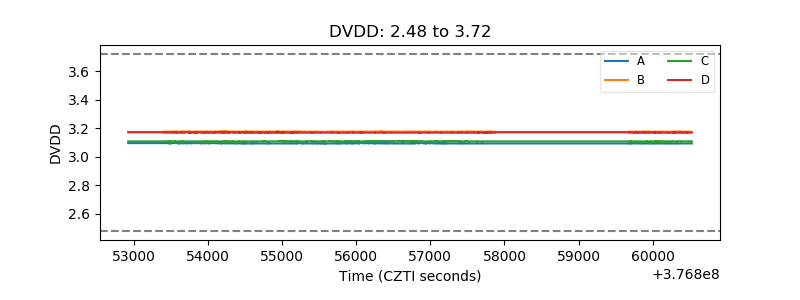 |
| Temperature 1 | 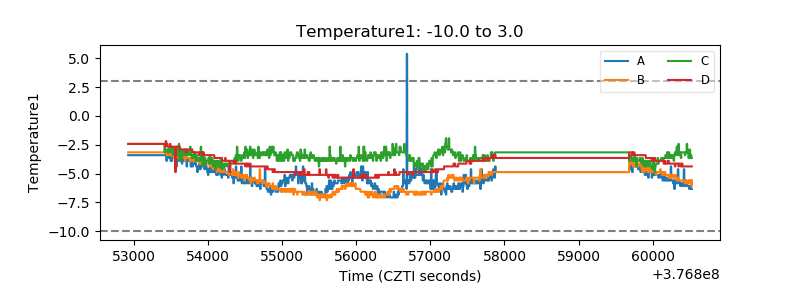 |
| Veto HV Monitor | 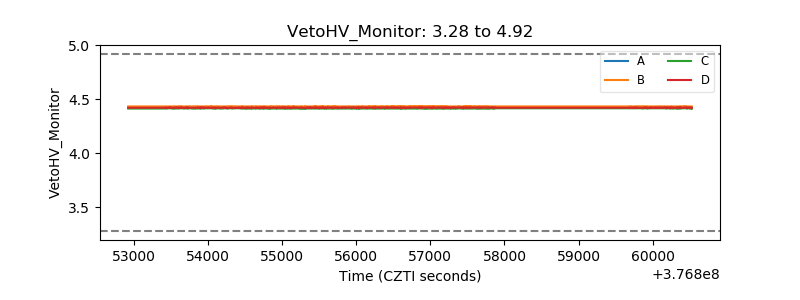 |
| Veto LLD | 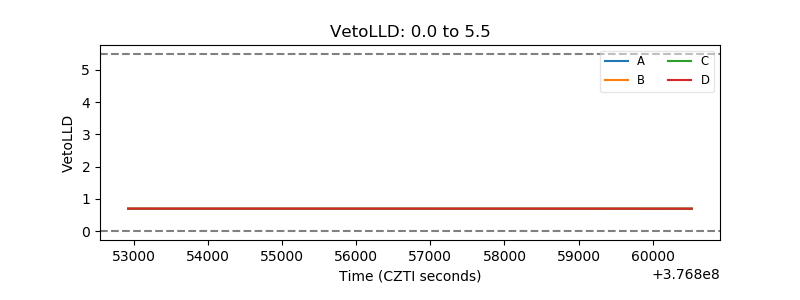 |
| Alpha Counter | 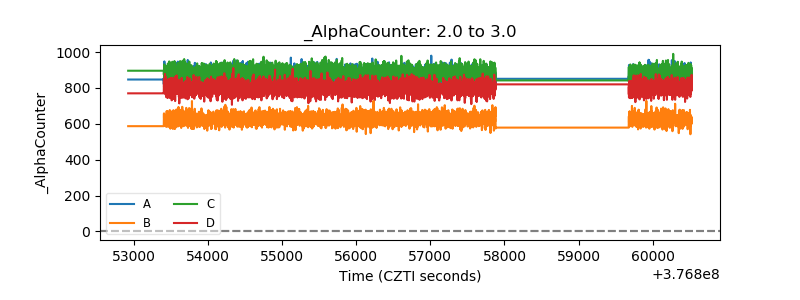 |
| _CPM_Rate | 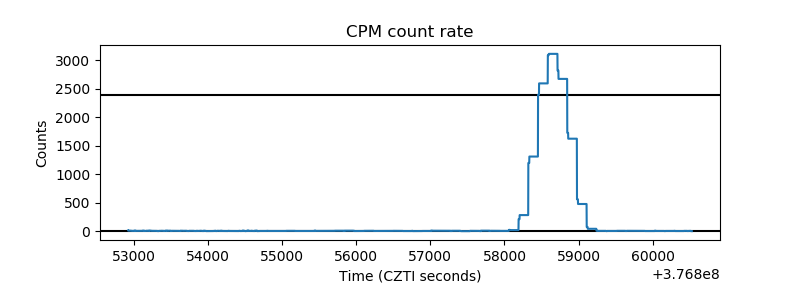 |
| CZT Counter | 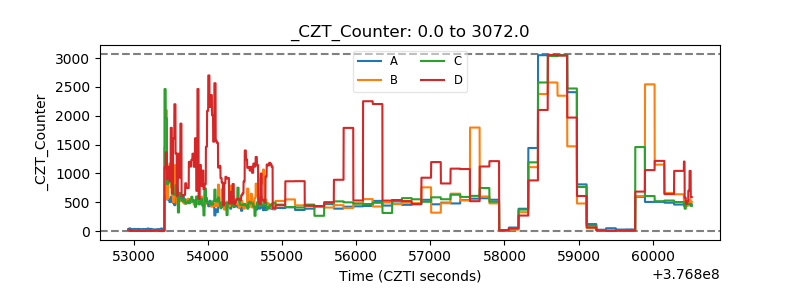 |
| +2.5 Volts monitor |  |
| +5 Volts monitor |  |
| _ROLL_ROT | 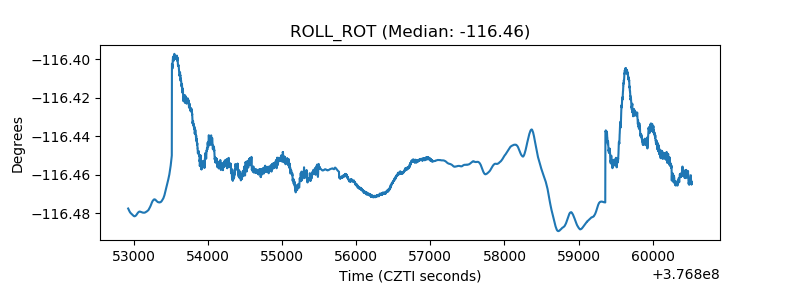 |
| _Roll_DEC | 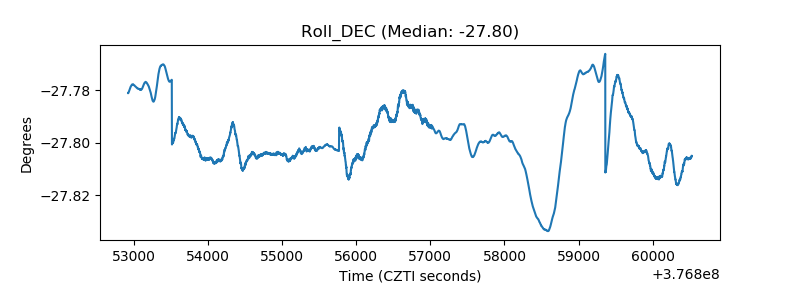 |
| _Roll_RA | 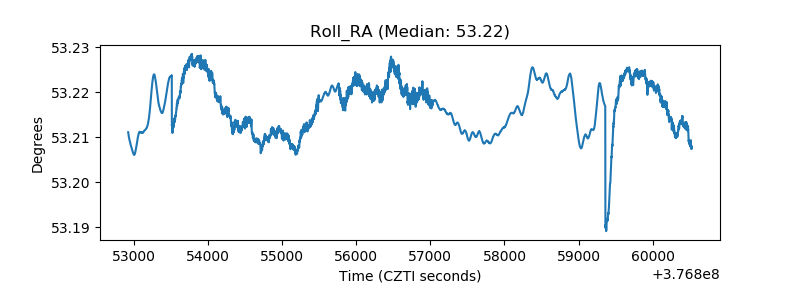 |
| Veto Counter |  |