| Param | Original file | Final file |
|---|---|---|
| Filename | modeM0/AS1A11_060T01_9000004808_33538cztM0_level2.evt | modeM0/AS1A11_060T01_9000004808_33538cztM0_level2_quad_clean.evt |
| Size (bytes) | 475,801,920 | 71,383,680 |
| Size | 453.8 MB | 68.1 MB |
| Events in quadrant A | 2,557,704 | 462,830 |
| Events in quadrant B | 2,958,789 | 473,493 |
| Events in quadrant C | 3,314,508 | 448,727 |
| Events in quadrant D | 5,223,390 | 409,112 |
| Mode M0 | |||
|---|---|---|---|
| Quadrant | BADHDUFLAG | Total packets | Discarded packets |
| A | 0 | 10644 | 3 |
| B | 0 | 11783 | 2 |
| C | 0 | 12990 | 2 |
| D | 0 | 19308 | 2 |
| Mode M9 | |||
|---|---|---|---|
| Quadrant | BADHDUFLAG | Total packets | Discarded packets |
| A | 0 | 37 | 0 |
| B | 0 | 37 | 0 |
| C | 0 | 37 | 0 |
| D | 0 | 38 | 0 |
| Mode SS | |||
|---|---|---|---|
| Quadrant | BADHDUFLAG | Total packets | Discarded packets |
| A | 0 | 106 | 0 |
| B | 0 | 106 | 0 |
| C | 0 | 106 | 0 |
| D | 0 | 106 | 0 |
| Quadrant | Total seconds | Saturated seconds | Saturation percentage |
|---|---|---|---|
| A | 5246 | 6 | 0.114373% |
| B | 5246 | 39 | 0.743424% |
| C | 5246 | 102 | 1.944339% |
| D | 5246 | 328 | 6.252383% |
Noise dominated data is calculated using 1-second bins in cleaned event files. If a bin has >2000 counts, and if more than 50% of those come from <1% of pixels, then it is considered to be noise-dominated and hence unusable.
| Quadrant | # 1 sec bins | Bins with >0 counts | Bins with >2000 counts | High rate bins dominated by noise | Noise dominated (total time) | Noise dominated (detector-on time) | Marked lightcurve |
|---|---|---|---|---|---|---|---|
| A | 7279 | 5247 | 0 | 0 | 0.00% | 0.00% | 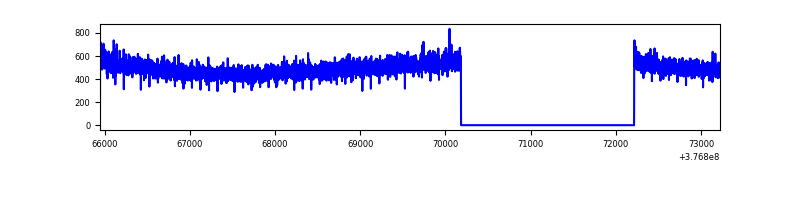 |
| B | 7279 | 5247 | 22 | 22 | 0.30% | 0.42% | 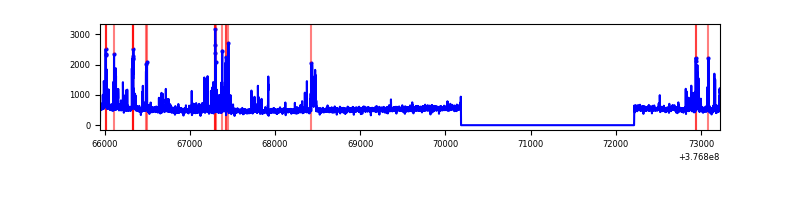 |
| C | 7279 | 5247 | 87 | 87 | 1.20% | 1.66% | 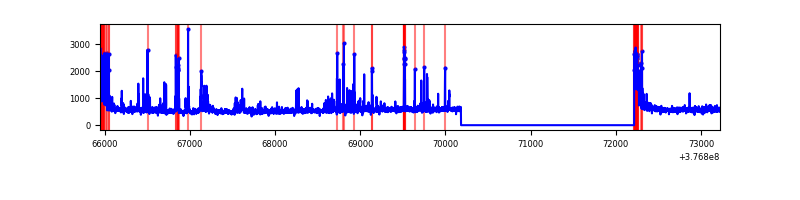 |
| D | 7279 | 5247 | 315 | 315 | 4.33% | 6.00% | 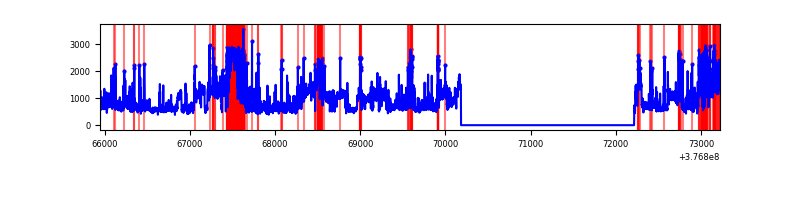 |
Top three noisy pixels from each quadrant. If the there are fewer than three noisy pixels in the level2.evt file, extra rows are filled as -1
| Pixel properties | Quadrant properties | ||||||
|---|---|---|---|---|---|---|---|
| Quadrant | DetID | PixID | Counts | Sigma | Mean | Median | Sigma |
| A | 13 | 254 | 8294 | 58.36 | 661 | 650 | 131.0 |
| A | 3 | 137 | 6253 | 42.78 | 661 | 650 | 131.0 |
| A | 10 | 83 | 5889 | 40.0 | 661 | 650 | 131.0 |
| B | 5 | 172 | 124484 | 983.09 | 666 | 650 | 126.0 |
| B | 5 | 255 | 121047 | 955.81 | 666 | 650 | 126.0 |
| B | 0 | 229 | 49246 | 385.79 | 666 | 650 | 126.0 |
| C | 0 | 10 | 251193 | 1678.86 | 649 | 656 | 149.2 |
| C | 15 | 214 | 226032 | 1510.26 | 649 | 656 | 149.2 |
| C | 14 | 254 | 215476 | 1439.52 | 649 | 656 | 149.2 |
| D | 8 | 195 | 1546804 | 10191.78 | 626 | 611 | 151.7 |
| D | 2 | 250 | 702033 | 4623.45 | 626 | 611 | 151.7 |
| D | 13 | 249 | 239247 | 1572.98 | 626 | 611 | 151.7 |
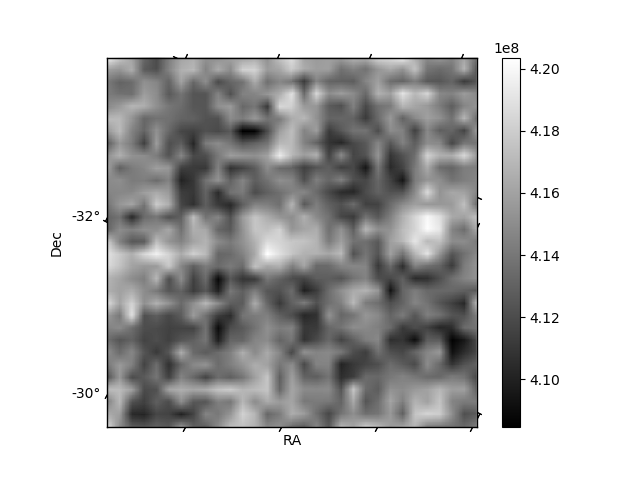
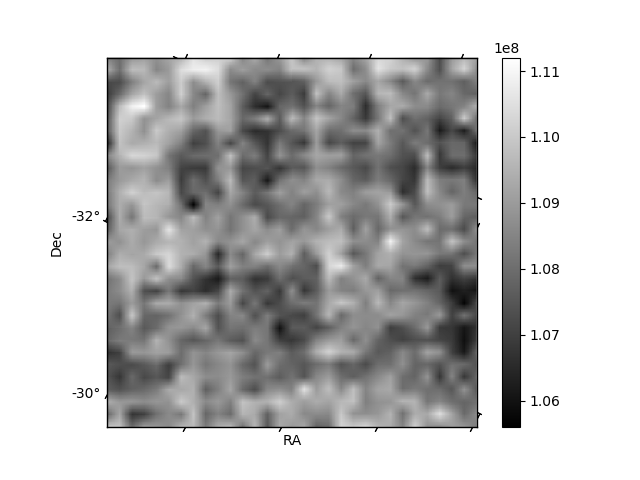
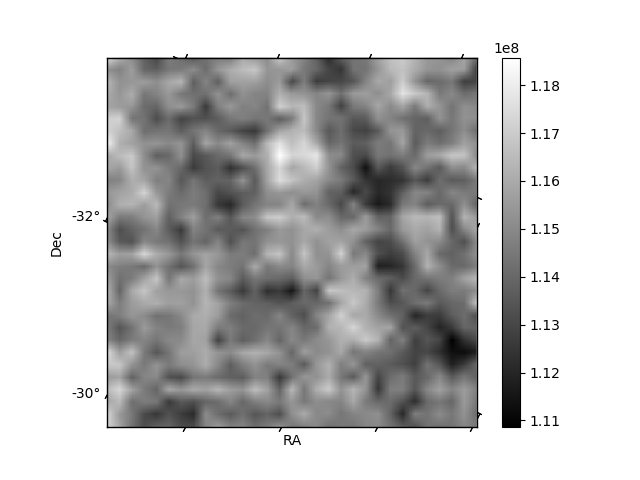
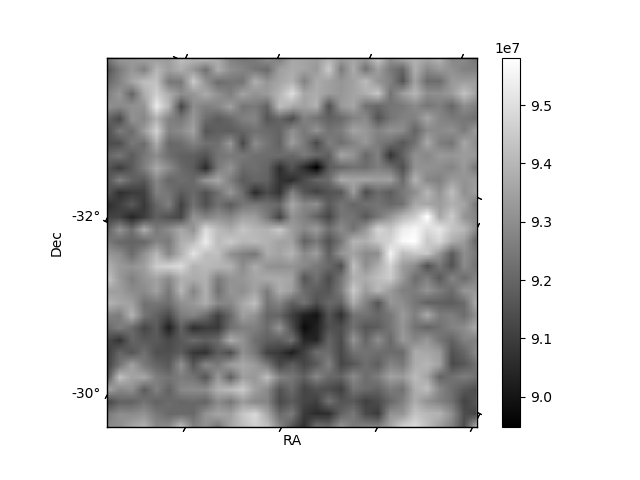
Histogram calculated using DETX and DETY for each event in the final _common_clean file
| Quadrant A | 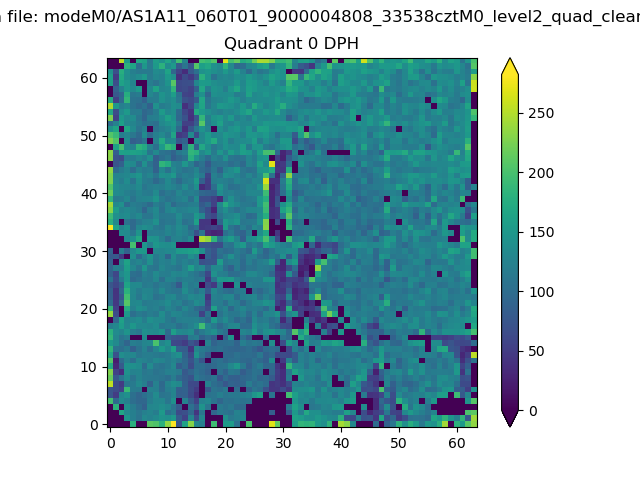 |
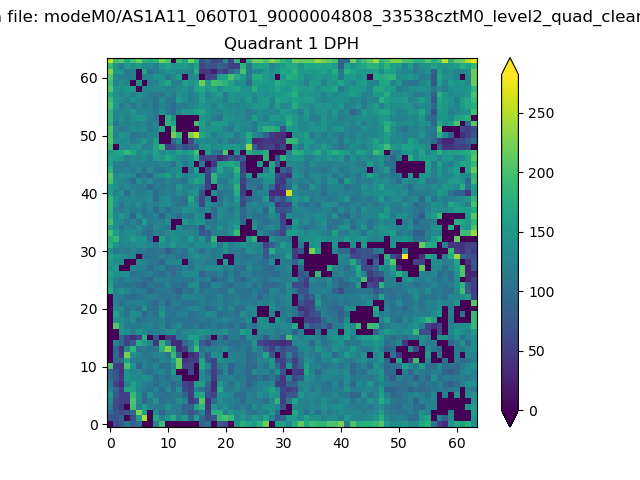 |
Quadrant B |
|---|---|---|---|
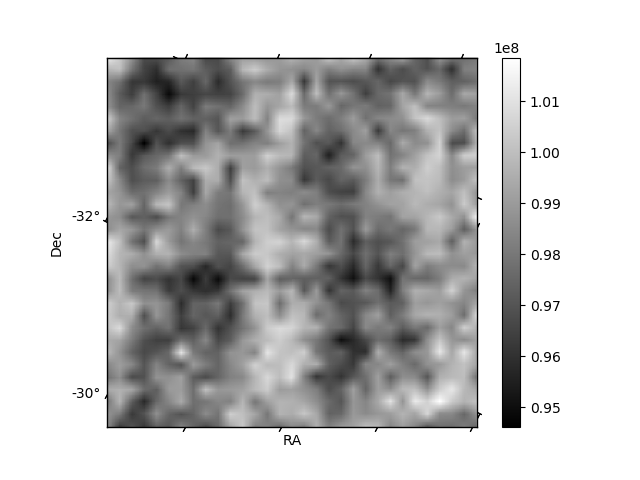
| Quadrant D | 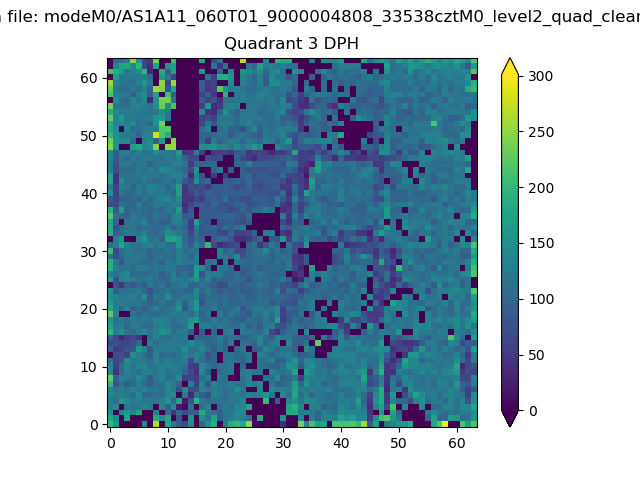 |
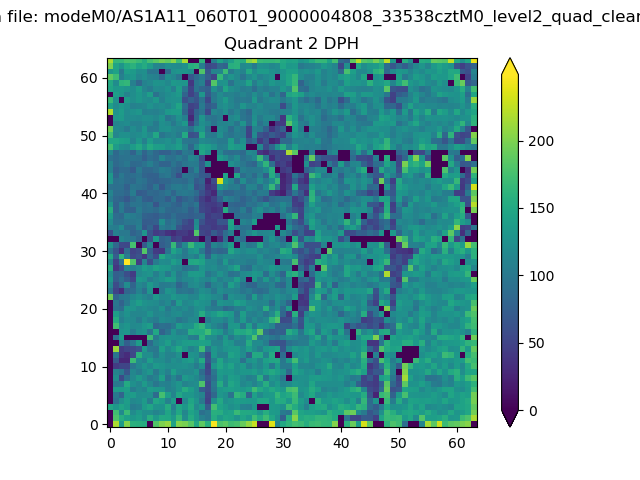 |
Quadrant C |
| Plot type | Count rate plots | Images |
|---|---|---|
| Comparison with Poisson distribution Blue bars denote a histogram of data divided into 1 sec bins. Red curve is a Poisson curve with rate = median count rate of data. |
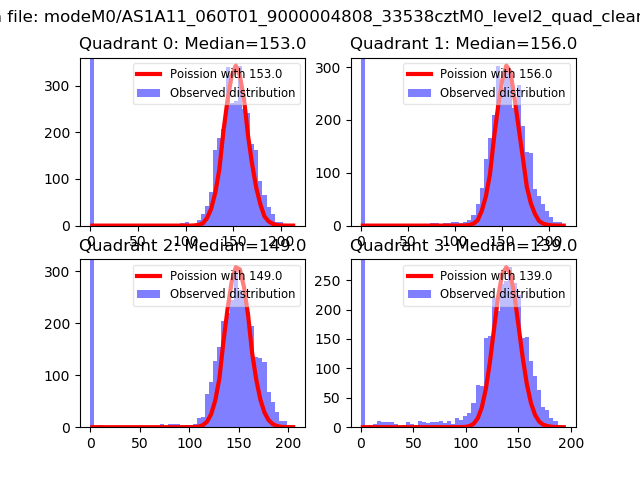 |
 |
| Quadrant-wise count rates Data is divided into 100 sec bins |
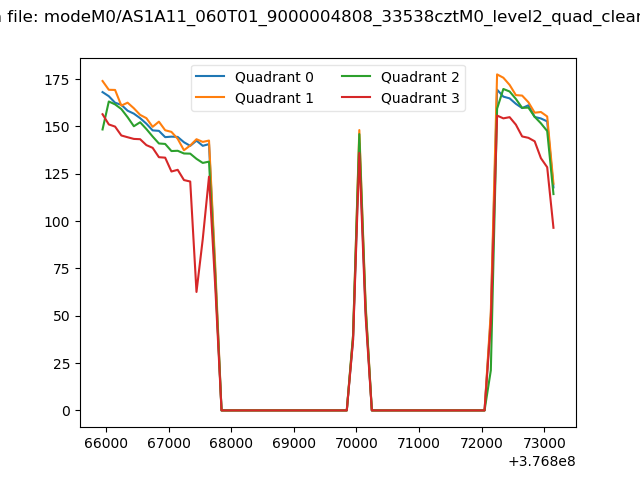 |
|
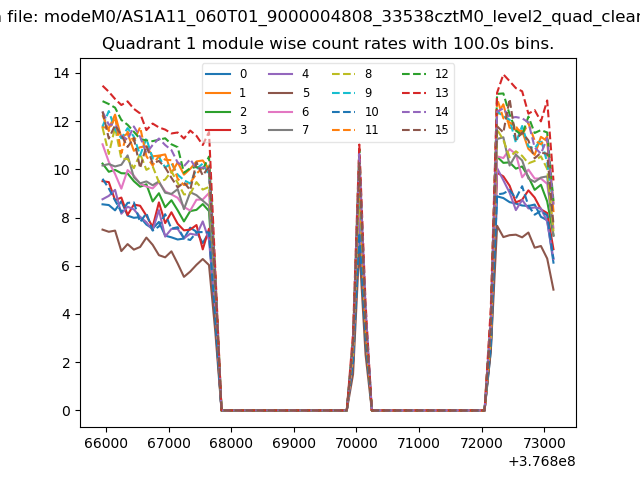
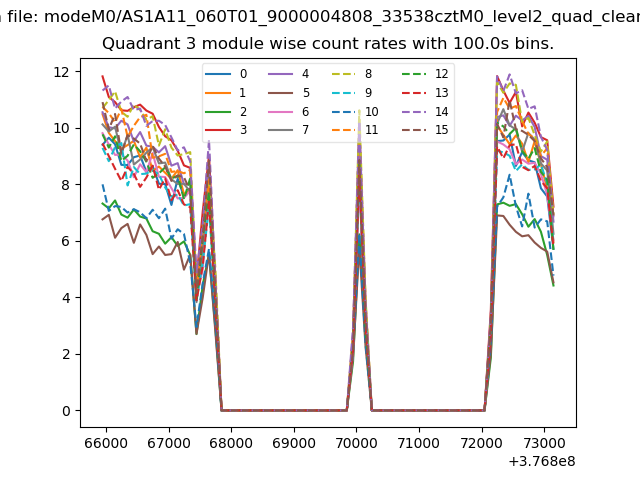
| Module-wise count rates for Quadrant A Data is divided into 100 sec bins |
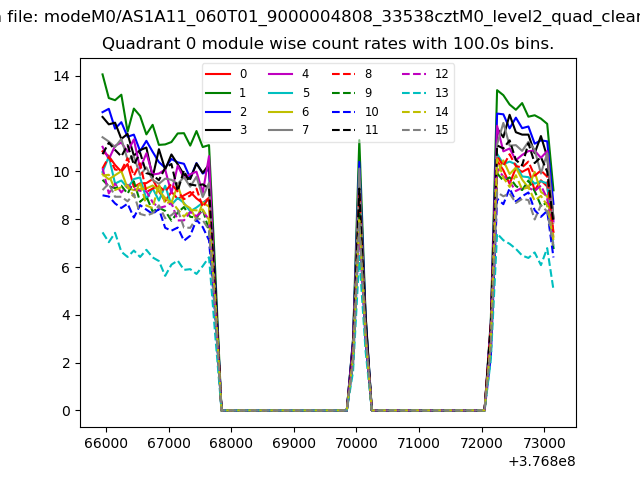 |
 |
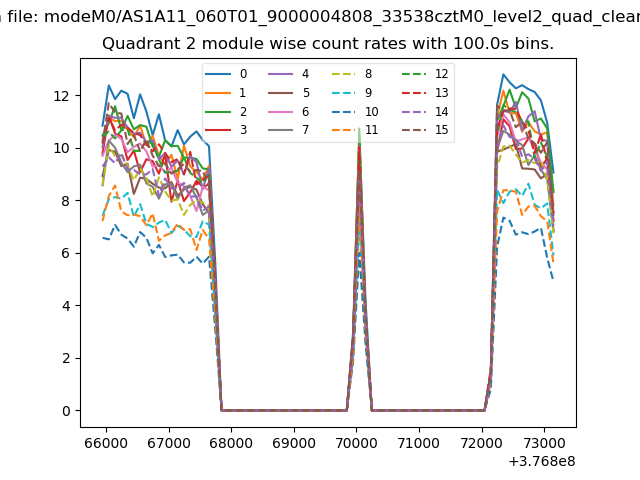
| Module-wise count rates for Quadrant B Data is divided into 100 sec bins |
 |
 |
| Module-wise count rates for Quadrant C Data is divided into 100 sec bins |
 |
 |
| Module-wise count rates for Quadrant D Data is divided into 100 sec bins |
 |
 |
| Parameter | Plot |
|---|---|
| CZT HV Monitor | 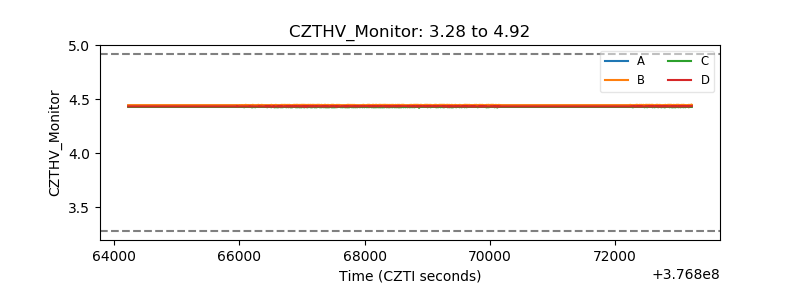 |
| D_VDD | 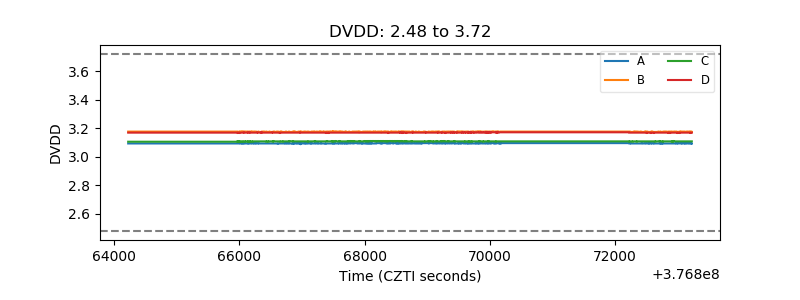 |
| Temperature 1 | 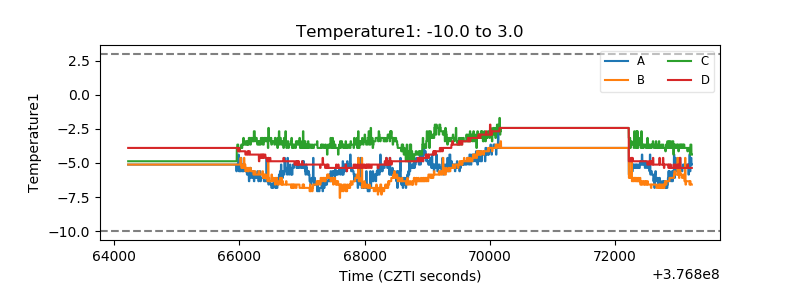 |
| Veto HV Monitor | 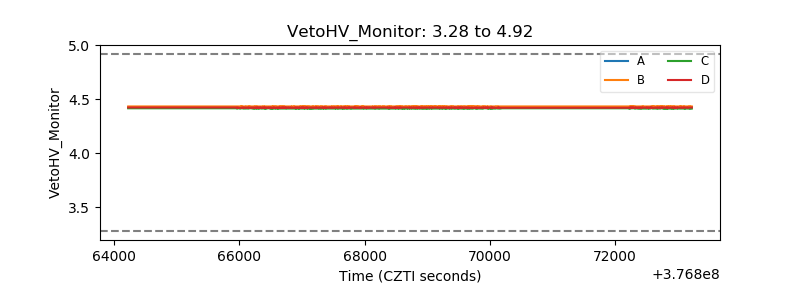 |
| Veto LLD | 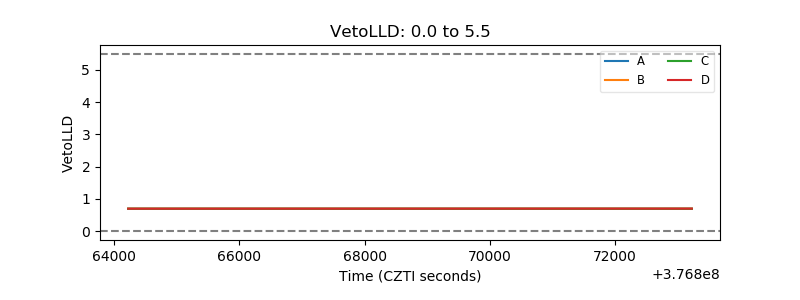 |
| Alpha Counter | 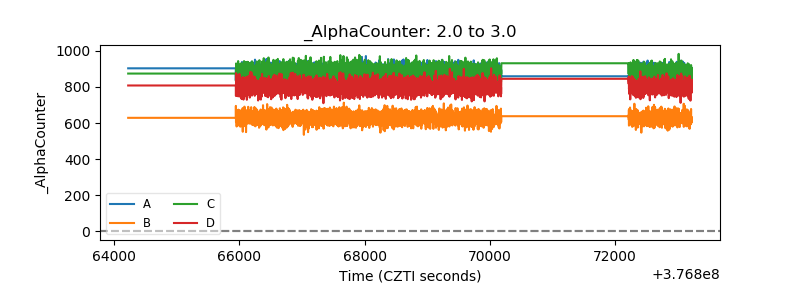 |
| _CPM_Rate | 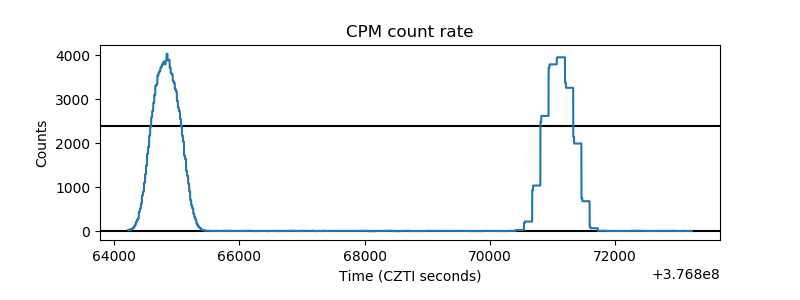 |
| CZT Counter | 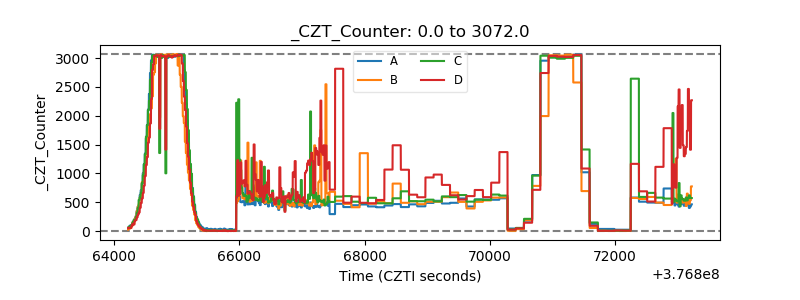 |
| +2.5 Volts monitor |  |
| +5 Volts monitor |  |
| _ROLL_ROT | 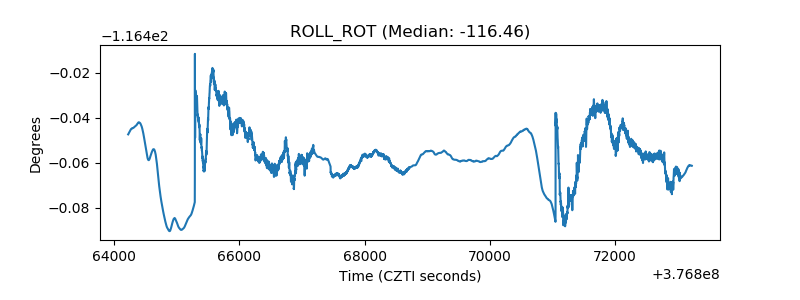 |
| _Roll_DEC | 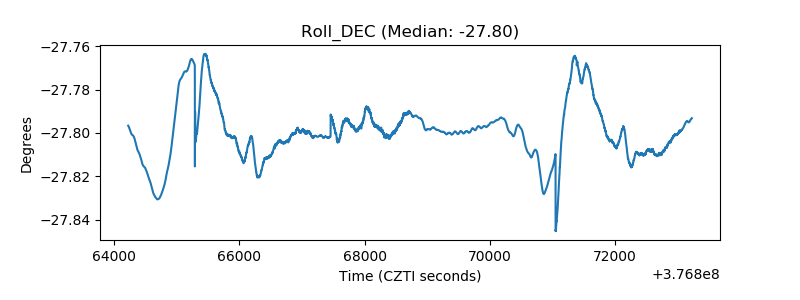 |
| _Roll_RA | 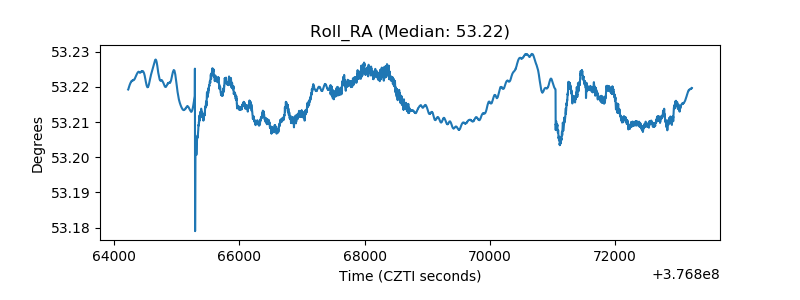 |
| Veto Counter | 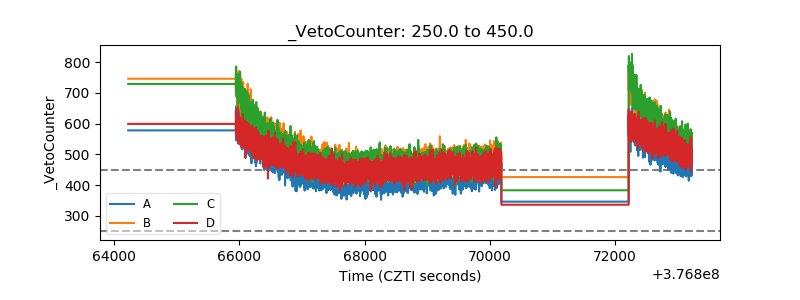 |