| Param | Original file | Final file |
|---|---|---|
| Filename | modeM0/AS1A11_060T01_9000004808_33539cztM0_level2.evt | modeM0/AS1A11_060T01_9000004808_33539cztM0_level2_quad_clean.evt |
| Size (bytes) | 467,930,880 | 70,254,720 |
| Size | 446.3 MB | 67.0 MB |
| Events in quadrant A | 2,535,590 | 450,787 |
| Events in quadrant B | 2,948,824 | 464,273 |
| Events in quadrant C | 3,155,059 | 444,187 |
| Events in quadrant D | 5,183,088 | 407,232 |
| Mode M0 | |||
|---|---|---|---|
| Quadrant | BADHDUFLAG | Total packets | Discarded packets |
| A | 0 | 10448 | 3 |
| B | 0 | 11678 | 2 |
| C | 0 | 12340 | 2 |
| D | 0 | 19090 | 2 |
| Mode M9 | |||
|---|---|---|---|
| Quadrant | BADHDUFLAG | Total packets | Discarded packets |
| A | 0 | 34 | 0 |
| B | 0 | 34 | 0 |
| C | 0 | 34 | 0 |
| D | 0 | 35 | 0 |
| Mode SS | |||
|---|---|---|---|
| Quadrant | BADHDUFLAG | Total packets | Discarded packets |
| A | 0 | 106 | 0 |
| B | 0 | 106 | 0 |
| C | 0 | 106 | 0 |
| D | 0 | 106 | 0 |
| Quadrant | Total seconds | Saturated seconds | Saturation percentage |
|---|---|---|---|
| A | 5144 | 7 | 0.136081% |
| B | 5144 | 53 | 1.030327% |
| C | 5144 | 79 | 1.535770% |
| D | 5144 | 273 | 5.307154% |
Noise dominated data is calculated using 1-second bins in cleaned event files. If a bin has >2000 counts, and if more than 50% of those come from <1% of pixels, then it is considered to be noise-dominated and hence unusable.
| Quadrant | # 1 sec bins | Bins with >0 counts | Bins with >2000 counts | High rate bins dominated by noise | Noise dominated (total time) | Noise dominated (detector-on time) | Marked lightcurve |
|---|---|---|---|---|---|---|---|
| A | 7267 | 5145 | 0 | 0 | 0.00% | 0.00% | 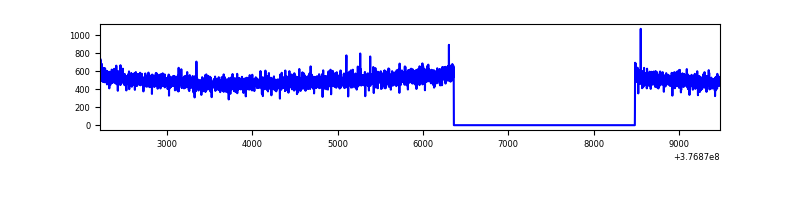 |
| B | 7267 | 5145 | 37 | 37 | 0.51% | 0.72% | 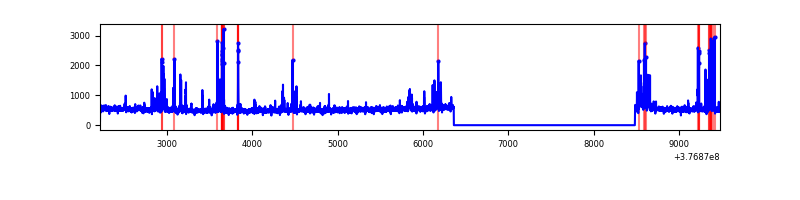 |
| C | 7267 | 5145 | 68 | 68 | 0.94% | 1.32% | 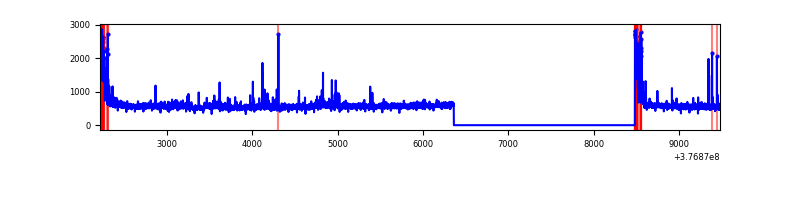 |
| D | 7267 | 5145 | 265 | 265 | 3.65% | 5.15% | 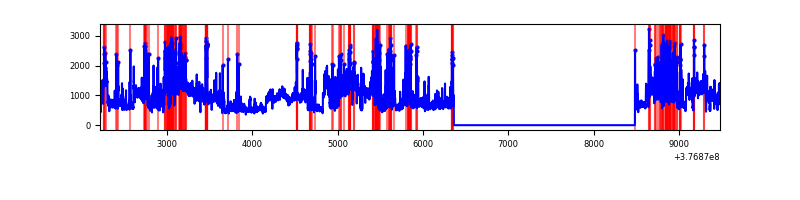 |
Top three noisy pixels from each quadrant. If the there are fewer than three noisy pixels in the level2.evt file, extra rows are filled as -1
| Pixel properties | Quadrant properties | ||||||
|---|---|---|---|---|---|---|---|
| Quadrant | DetID | PixID | Counts | Sigma | Mean | Median | Sigma |
| A | 13 | 254 | 8258 | 58.44 | 655 | 644 | 130.3 |
| A | 3 | 137 | 6046 | 41.46 | 655 | 644 | 130.3 |
| A | 10 | 83 | 6029 | 41.33 | 655 | 644 | 130.3 |
| B | 5 | 172 | 154011 | 1217.34 | 662 | 645 | 126.0 |
| B | 5 | 255 | 129447 | 1022.37 | 662 | 645 | 126.0 |
| B | 4 | 251 | 33592 | 261.52 | 662 | 645 | 126.0 |
| C | 0 | 10 | 254302 | 1697.73 | 650 | 658 | 149.4 |
| C | 15 | 214 | 223371 | 1490.7 | 650 | 658 | 149.4 |
| C | 14 | 67 | 59048 | 390.82 | 650 | 658 | 149.4 |
| D | 8 | 195 | 1570371 | 10303.54 | 630 | 615 | 152.4 |
| D | 2 | 250 | 484030 | 3173.03 | 630 | 615 | 152.4 |
| D | 12 | 6 | 243078 | 1591.48 | 630 | 615 | 152.4 |
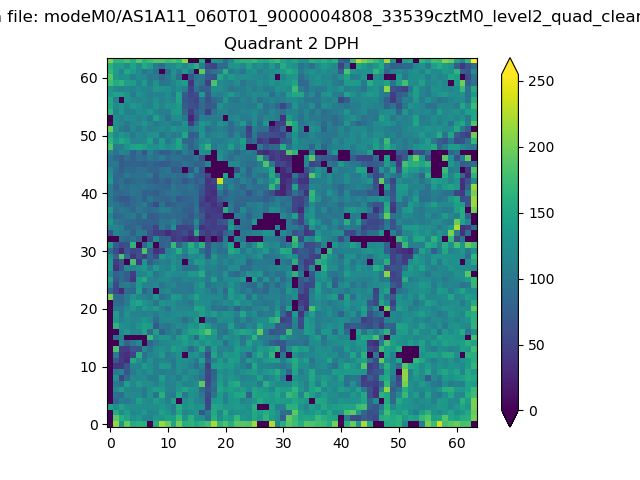
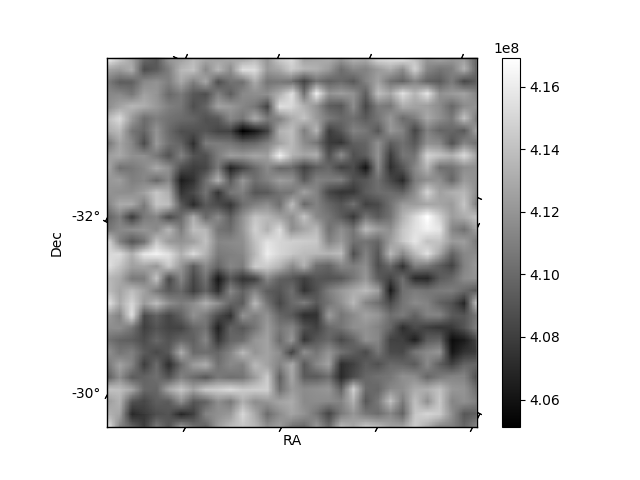
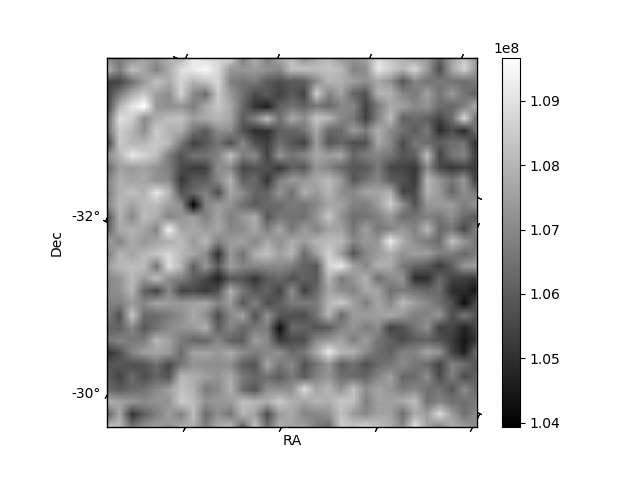
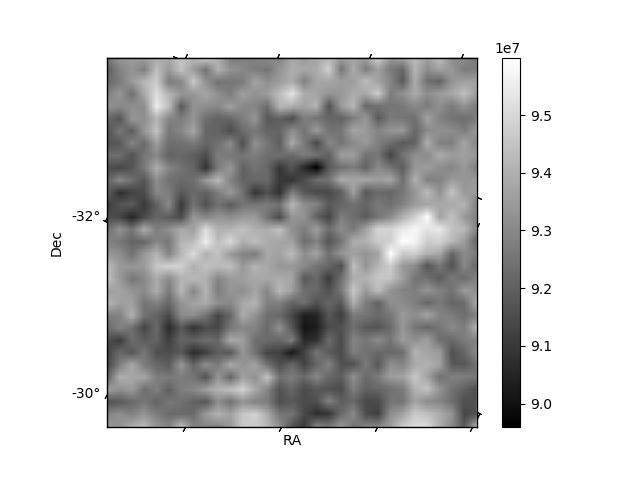
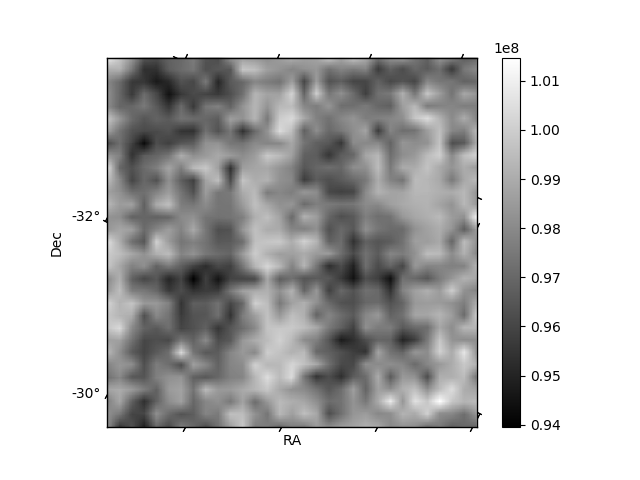
Histogram calculated using DETX and DETY for each event in the final _common_clean file
| Quadrant A | 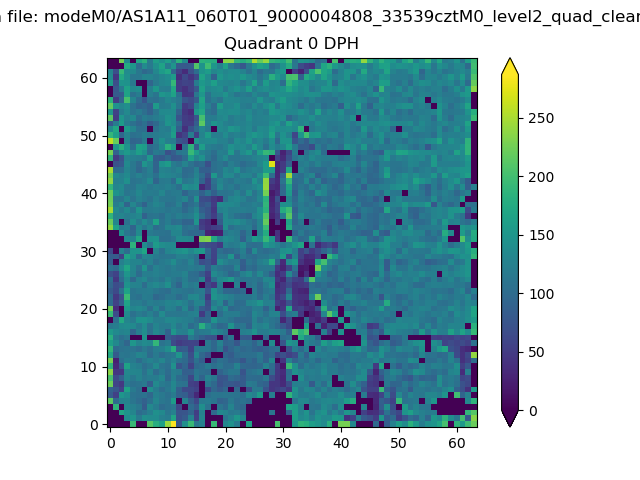 |
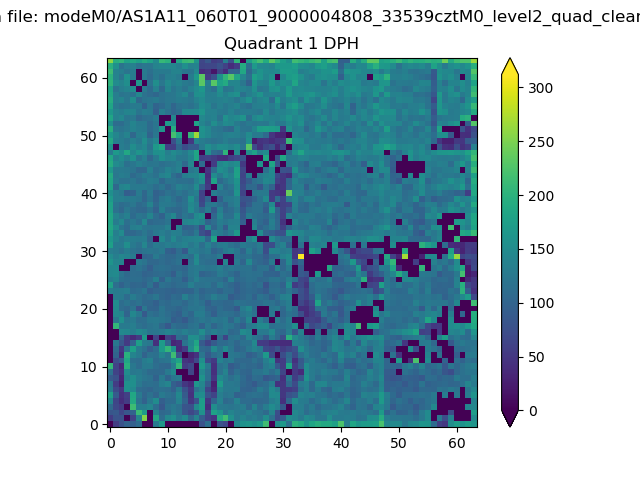 |
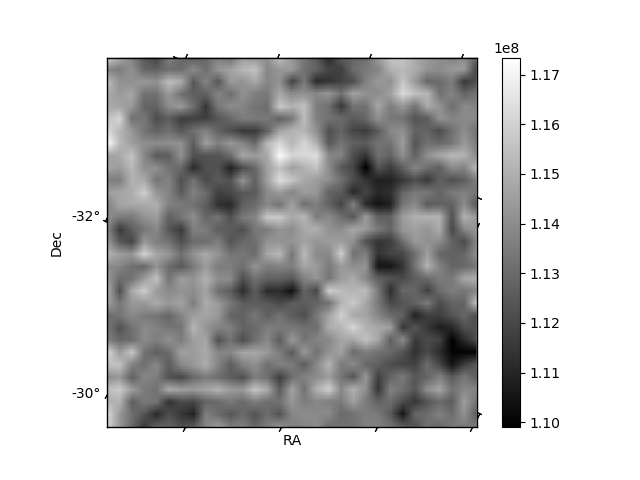
Quadrant B |
|---|---|---|---|
| Quadrant D | 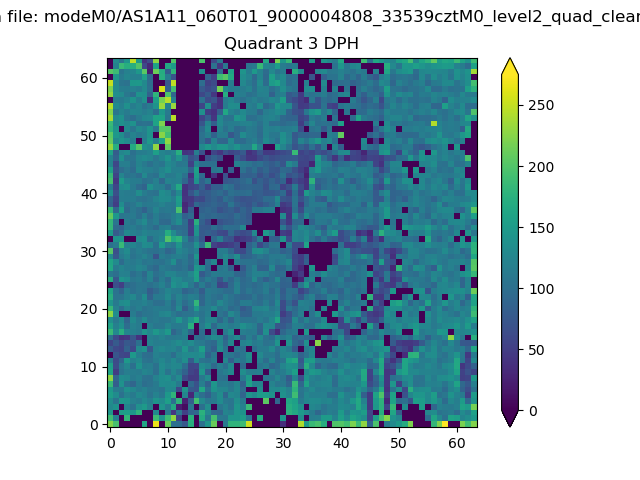 |
 |
Quadrant C |
| Plot type | Count rate plots | Images |
|---|---|---|
| Comparison with Poisson distribution Blue bars denote a histogram of data divided into 1 sec bins. Red curve is a Poisson curve with rate = median count rate of data. |
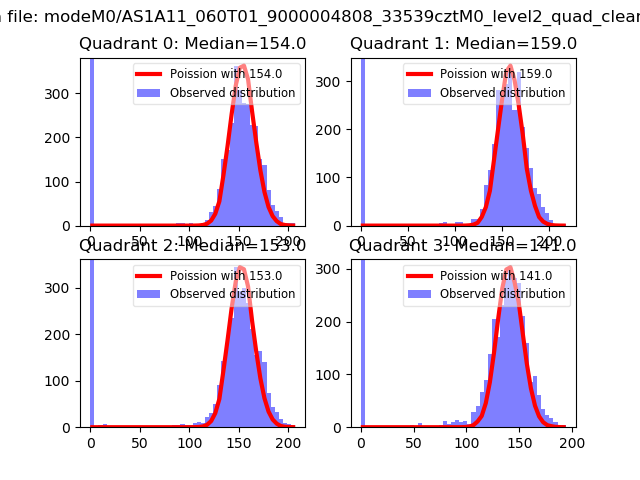 |
 |
| Quadrant-wise count rates Data is divided into 100 sec bins |
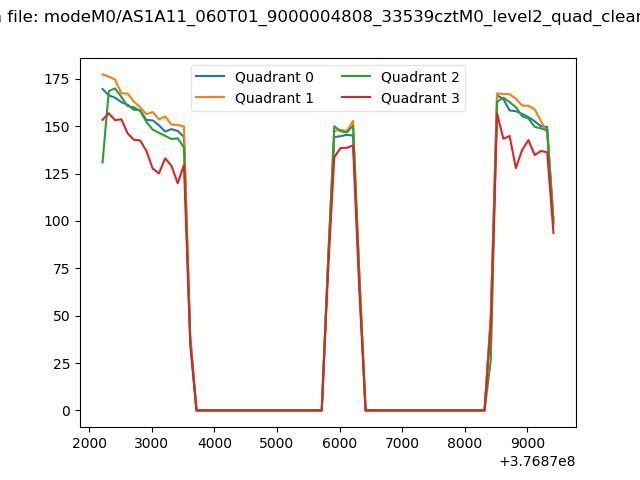 |
|
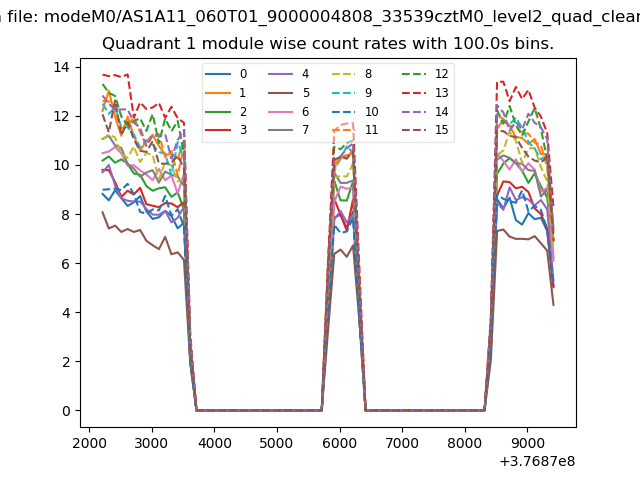
| Module-wise count rates for Quadrant A Data is divided into 100 sec bins |
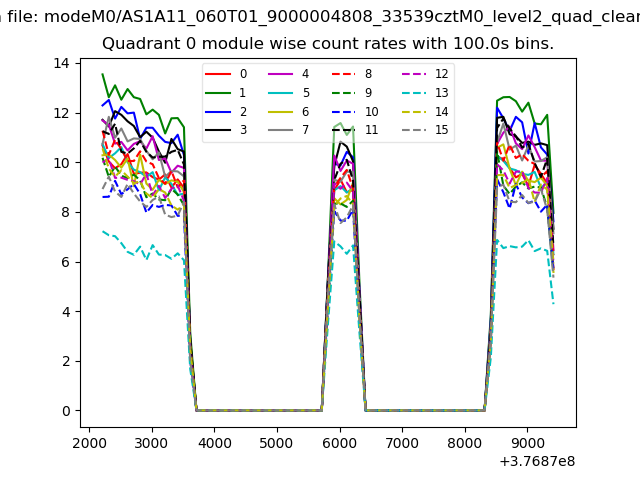 |
 |
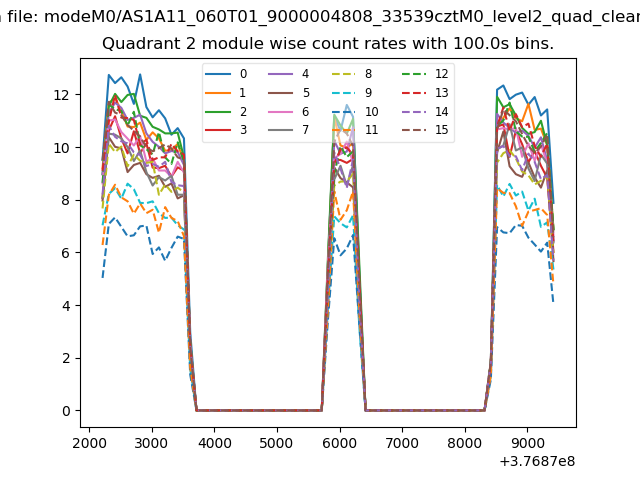
| Module-wise count rates for Quadrant B Data is divided into 100 sec bins |
 |
 |
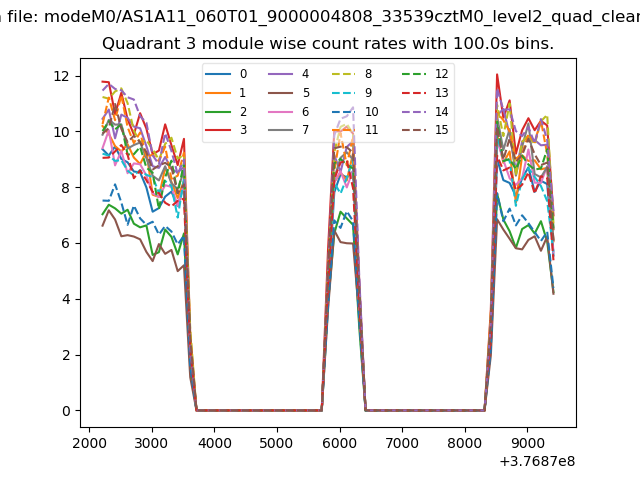
| Module-wise count rates for Quadrant C Data is divided into 100 sec bins |
 |
 |
| Module-wise count rates for Quadrant D Data is divided into 100 sec bins |
 |
 |
| Parameter | Plot |
|---|---|
| CZT HV Monitor | 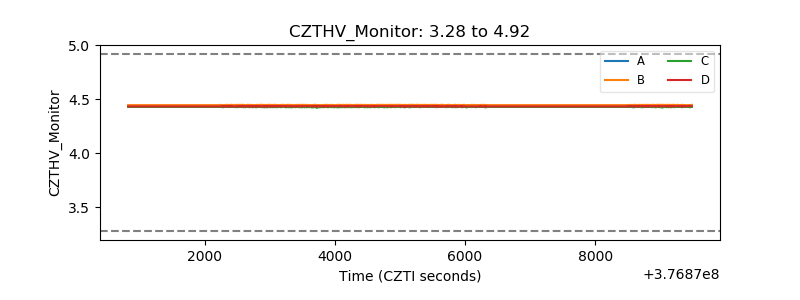 |
| D_VDD |  |
| Temperature 1 | 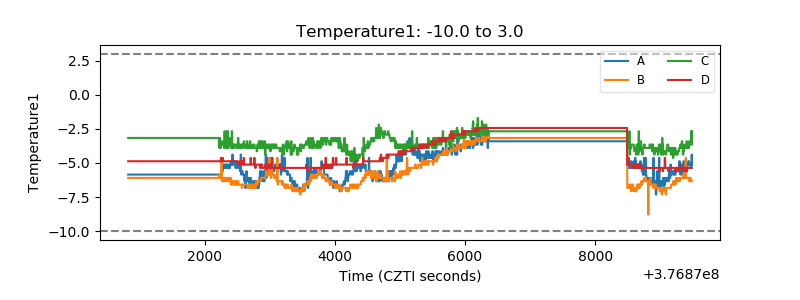 |
| Veto HV Monitor | 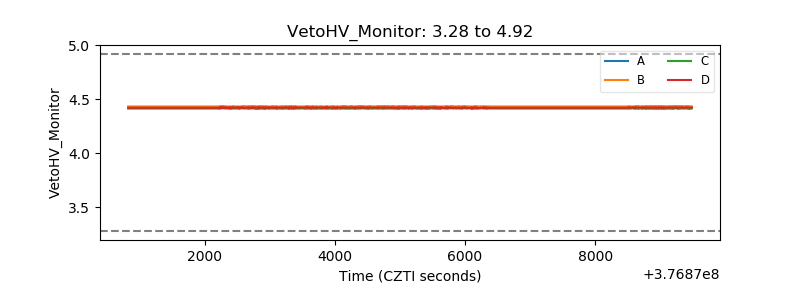 |
| Veto LLD | 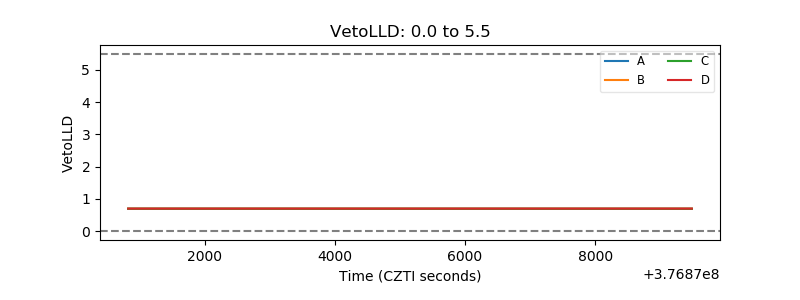 |
| Alpha Counter | 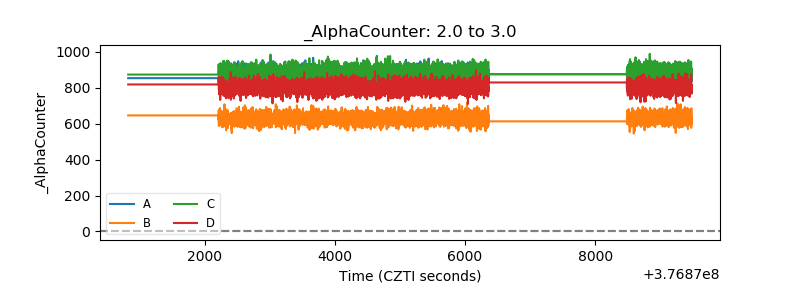 |
| _CPM_Rate | 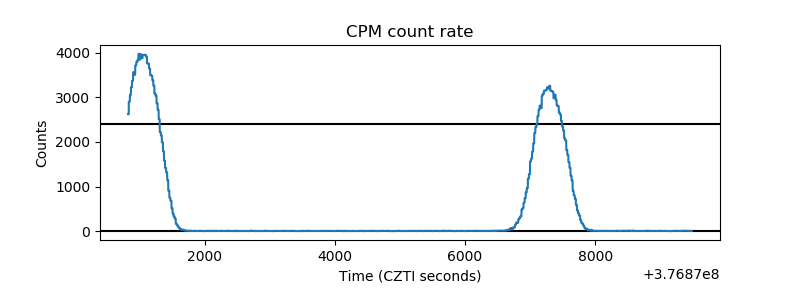 |
| CZT Counter | 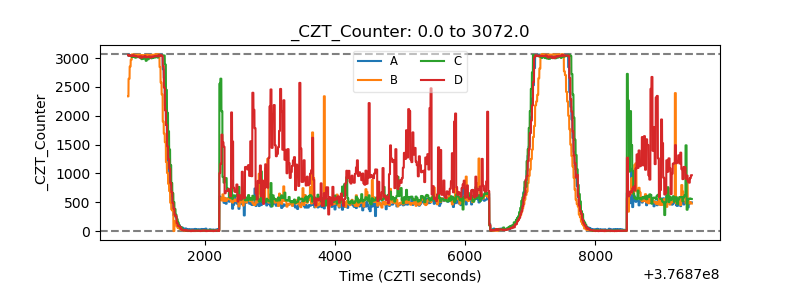 |
| +2.5 Volts monitor |  |
| +5 Volts monitor |  |
| _ROLL_ROT | 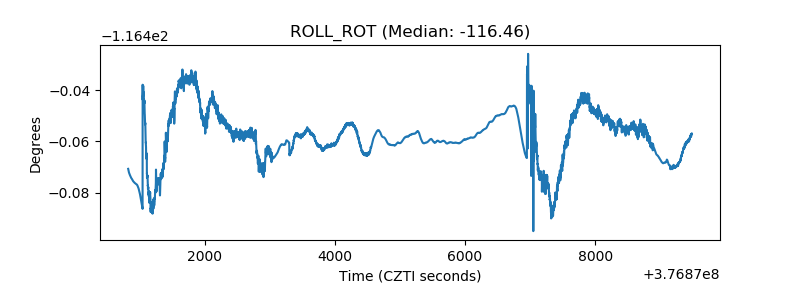 |
| _Roll_DEC | 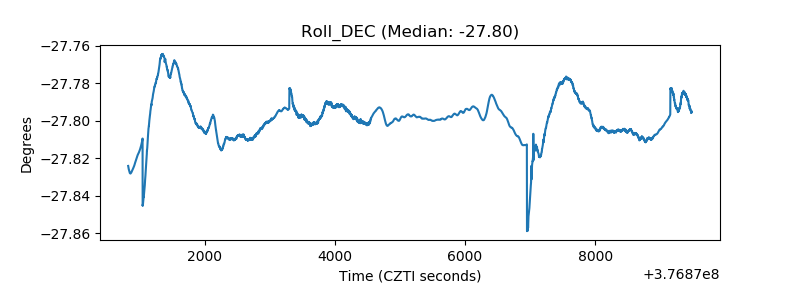 |
| _Roll_RA |  |
| Veto Counter | 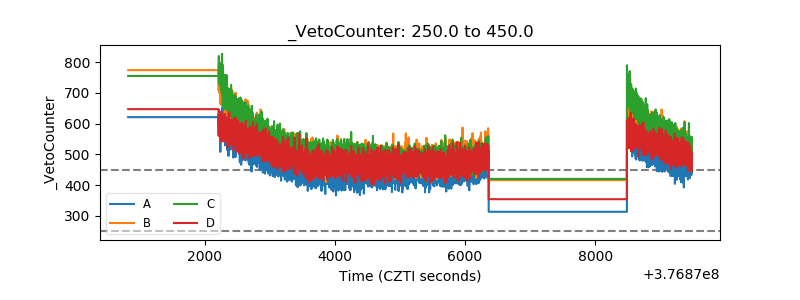 |