| Param | Original file | Final file |
|---|---|---|
| Filename | modeM0/AS1A11_060T01_9000004808_33543cztM0_level2.evt | modeM0/AS1A11_060T01_9000004808_33543cztM0_level2_quad_clean.evt |
| Size (bytes) | 483,897,600 | 66,533,760 |
| Size | 461.5 MB | 63.5 MB |
| Events in quadrant A | 2,781,007 | 407,451 |
| Events in quadrant B | 3,163,334 | 402,661 |
| Events in quadrant C | 3,316,797 | 403,878 |
| Events in quadrant D | 4,987,127 | 381,787 |
| Mode M0 | |||
|---|---|---|---|
| Quadrant | BADHDUFLAG | Total packets | Discarded packets |
| A | 0 | 12142 | 3 |
| B | 0 | 13067 | 2 |
| C | 0 | 13265 | 2 |
| D | 0 | 18755 | 2 |
| Mode M9 | |||
|---|---|---|---|
| Quadrant | BADHDUFLAG | Total packets | Discarded packets |
| A | 0 | 33 | 0 |
| B | 0 | 33 | 0 |
| C | 0 | 33 | 0 |
| D | 0 | 33 | 0 |
| Mode SS | |||
|---|---|---|---|
| Quadrant | BADHDUFLAG | Total packets | Discarded packets |
| A | 0 | 126 | 0 |
| B | 0 | 126 | 0 |
| C | 0 | 126 | 0 |
| D | 0 | 126 | 0 |
| Quadrant | Total seconds | Saturated seconds | Saturation percentage |
|---|---|---|---|
| A | 5988 | 9 | 0.150301% |
| B | 5988 | 109 | 1.820307% |
| C | 5988 | 109 | 1.820307% |
| D | 5988 | 174 | 2.905812% |
Noise dominated data is calculated using 1-second bins in cleaned event files. If a bin has >2000 counts, and if more than 50% of those come from <1% of pixels, then it is considered to be noise-dominated and hence unusable.
| Quadrant | # 1 sec bins | Bins with >0 counts | Bins with >2000 counts | High rate bins dominated by noise | Noise dominated (total time) | Noise dominated (detector-on time) | Marked lightcurve |
|---|---|---|---|---|---|---|---|
| A | 9334 | 5990 | 0 | 0 | 0.00% | 0.00% | 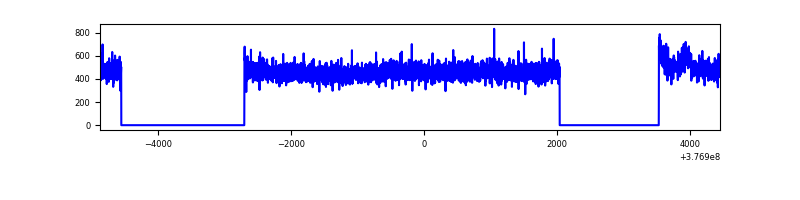 |
| B | 9334 | 5990 | 87 | 87 | 0.93% | 1.45% | 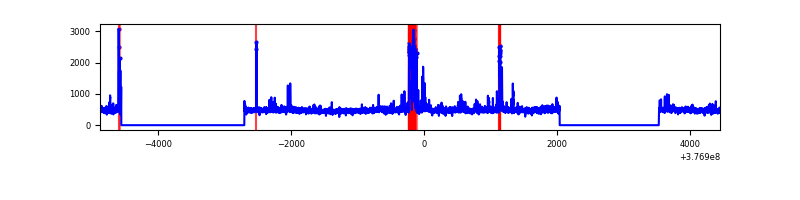 |
| C | 9334 | 5990 | 89 | 89 | 0.95% | 1.49% | 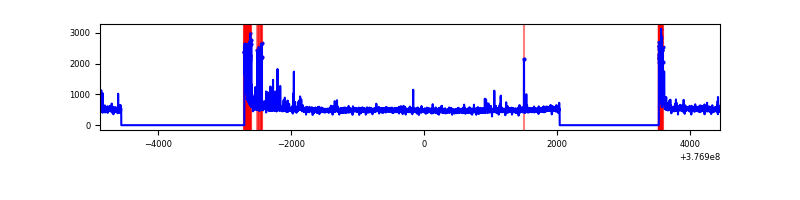 |
| D | 9334 | 5990 | 157 | 157 | 1.68% | 2.62% | 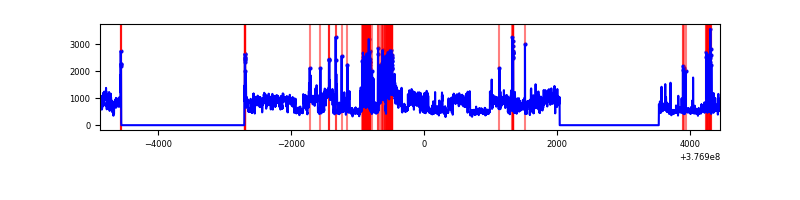 |
Top three noisy pixels from each quadrant. If the there are fewer than three noisy pixels in the level2.evt file, extra rows are filled as -1
| Pixel properties | Quadrant properties | ||||||
|---|---|---|---|---|---|---|---|
| Quadrant | DetID | PixID | Counts | Sigma | Mean | Median | Sigma |
| A | 15 | 169 | 51971 | 359.11 | 704 | 689 | 142.8 |
| A | 13 | 254 | 10344 | 67.61 | 704 | 689 | 142.8 |
| A | 3 | 137 | 7057 | 44.59 | 704 | 689 | 142.8 |
| B | 5 | 172 | 262928 | 1947.83 | 698 | 679 | 134.6 |
| B | 5 | 255 | 70386 | 517.74 | 698 | 679 | 134.6 |
| B | 4 | 187 | 17626 | 125.87 | 698 | 679 | 134.6 |
| C | 15 | 214 | 259140 | 1641.43 | 682 | 689 | 157.5 |
| C | 0 | 10 | 243916 | 1544.74 | 682 | 689 | 157.5 |
| C | 14 | 254 | 90875 | 572.77 | 682 | 689 | 157.5 |
| D | 8 | 195 | 1771953 | 10610.39 | 679 | 660 | 166.9 |
| D | 13 | 249 | 165394 | 986.79 | 679 | 660 | 166.9 |
| D | 2 | 250 | 142429 | 849.22 | 679 | 660 | 166.9 |
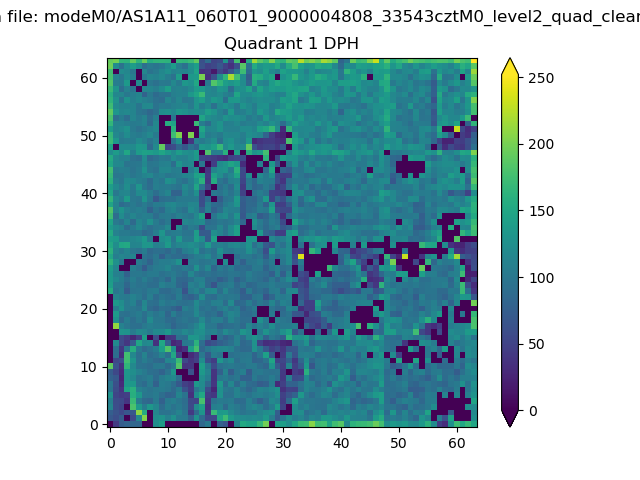
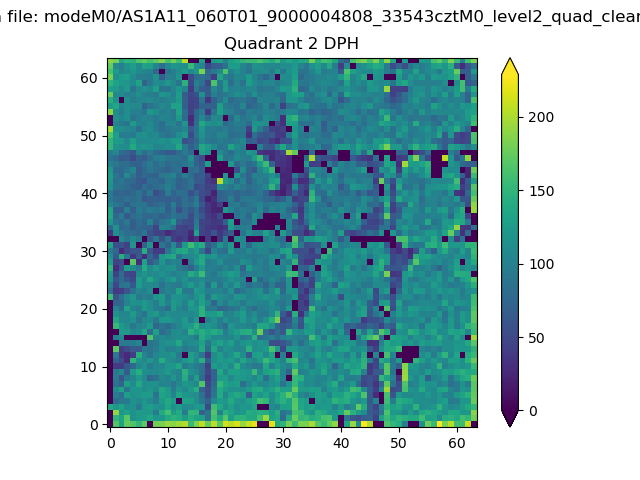
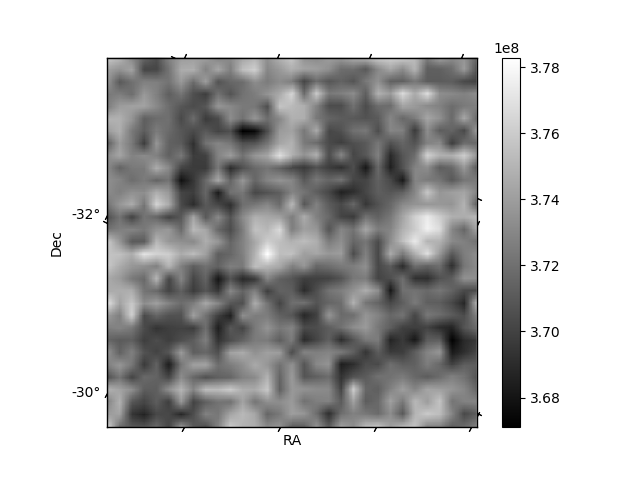
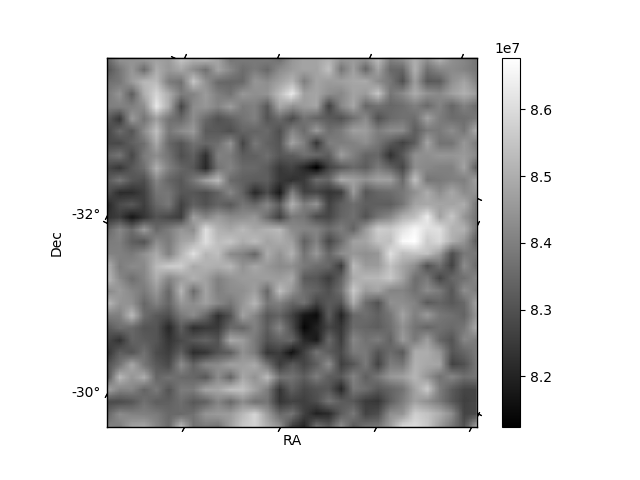
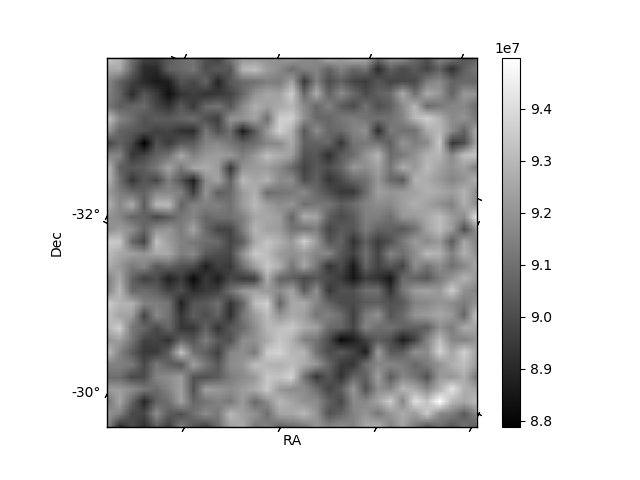
Histogram calculated using DETX and DETY for each event in the final _common_clean file
| Quadrant A |  |
 |
Quadrant B |
|---|---|---|---|
| Quadrant D | 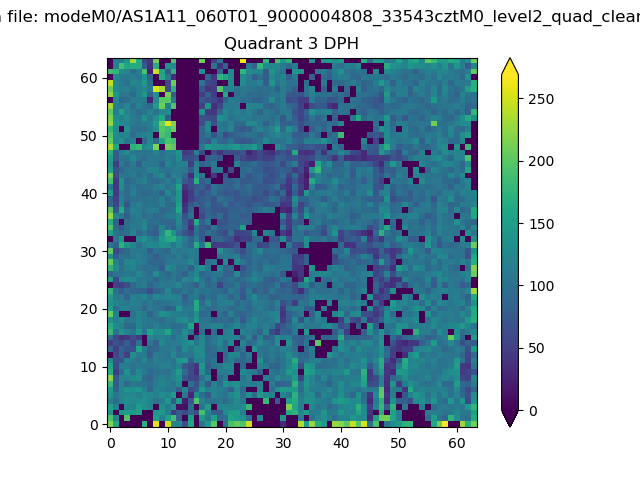 |
 |
Quadrant C |
| Plot type | Count rate plots | Images |
|---|---|---|
| Comparison with Poisson distribution Blue bars denote a histogram of data divided into 1 sec bins. Red curve is a Poisson curve with rate = median count rate of data. |
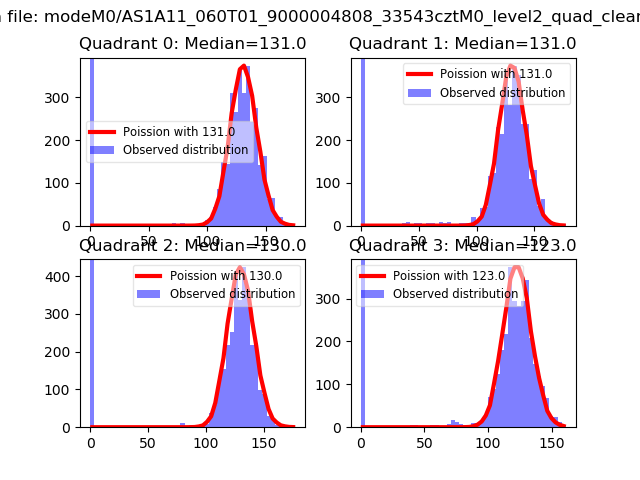 |
 |
| Quadrant-wise count rates Data is divided into 100 sec bins |
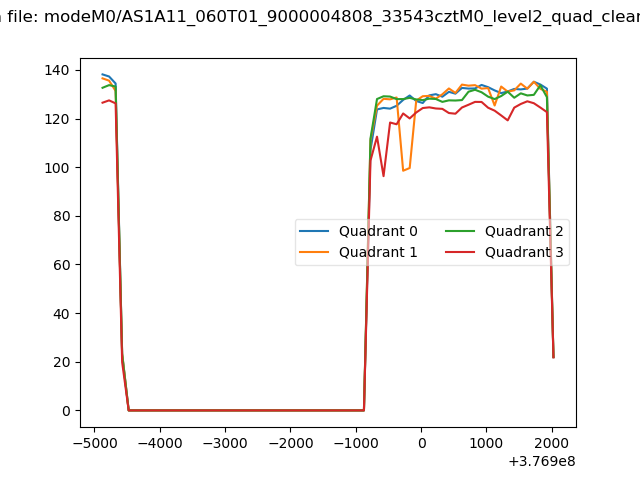 |
|
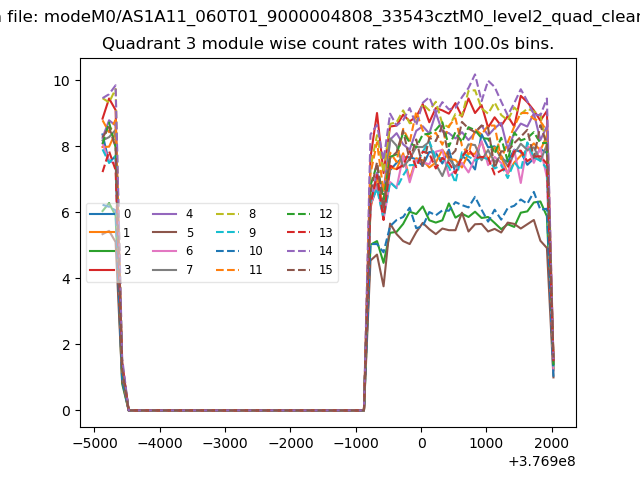
| Module-wise count rates for Quadrant A Data is divided into 100 sec bins |
 |
 |
| Module-wise count rates for Quadrant B Data is divided into 100 sec bins |
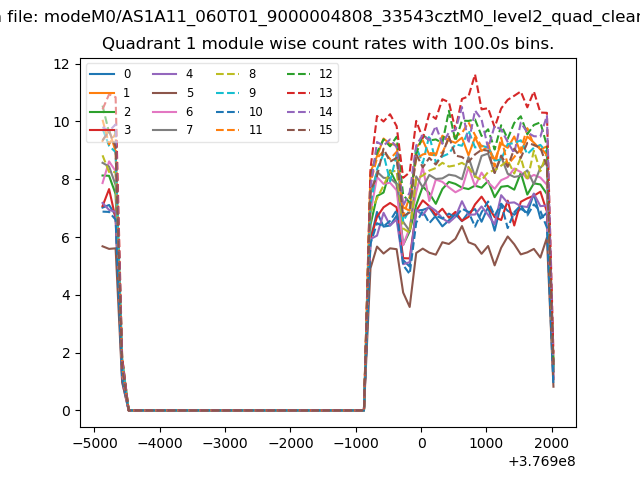 |
 |
| Module-wise count rates for Quadrant C Data is divided into 100 sec bins |
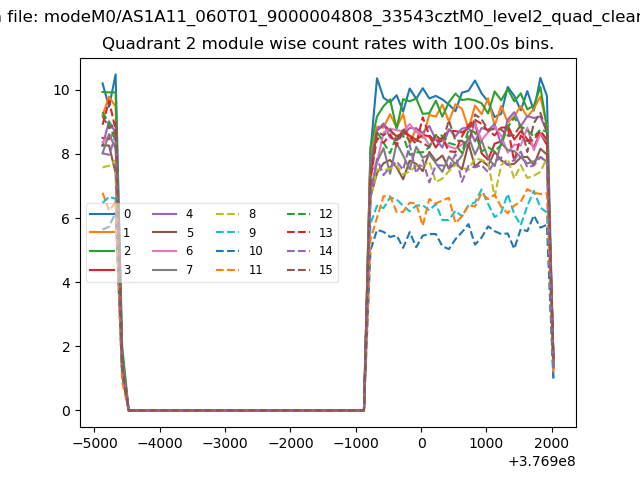 |
 |
| Module-wise count rates for Quadrant D Data is divided into 100 sec bins |
 |
 |
| Parameter | Plot |
|---|---|
| CZT HV Monitor | 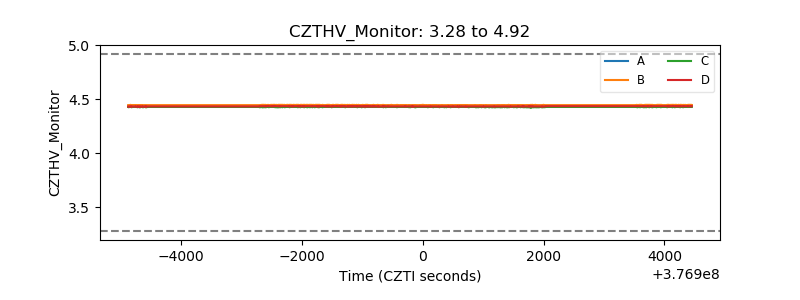 |
| D_VDD | 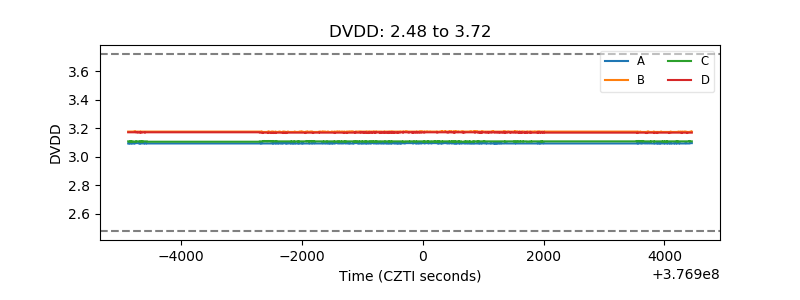 |
| Temperature 1 | 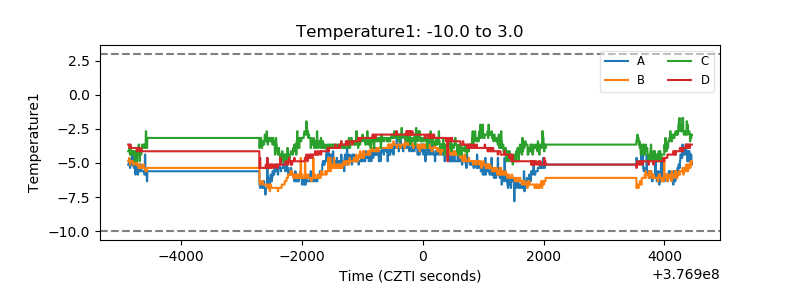 |
| Veto HV Monitor | 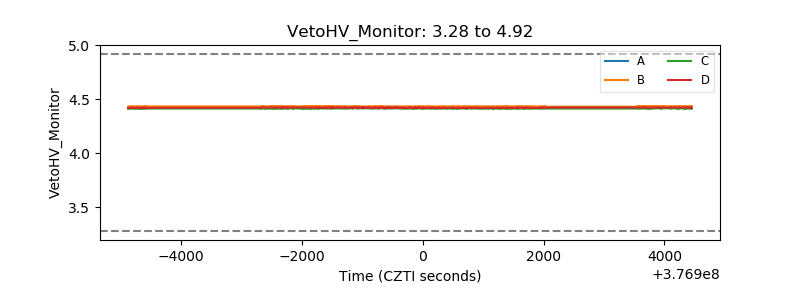 |
| Veto LLD | 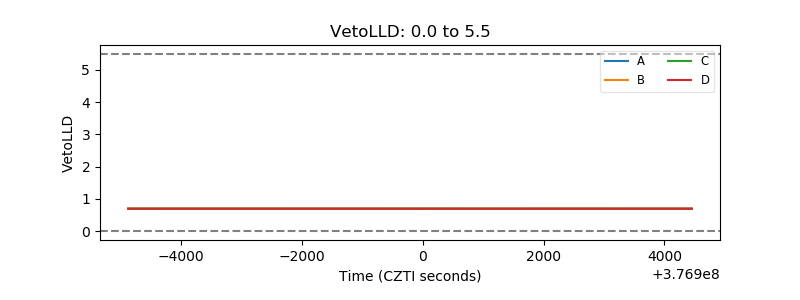 |
| Alpha Counter | 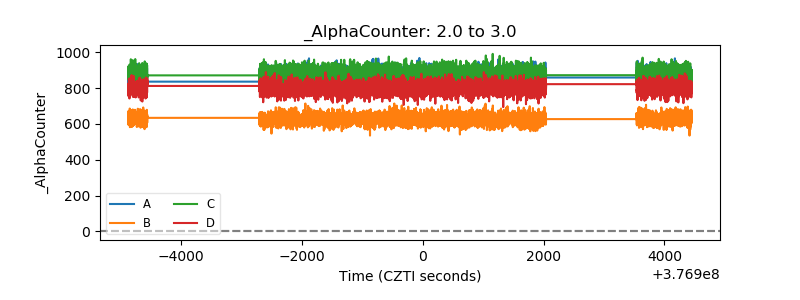 |
| _CPM_Rate | 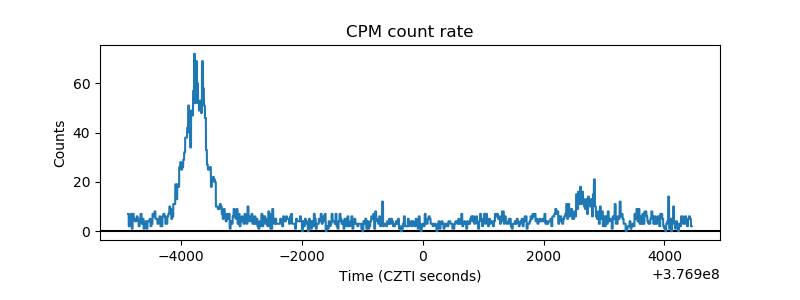 |
| CZT Counter | 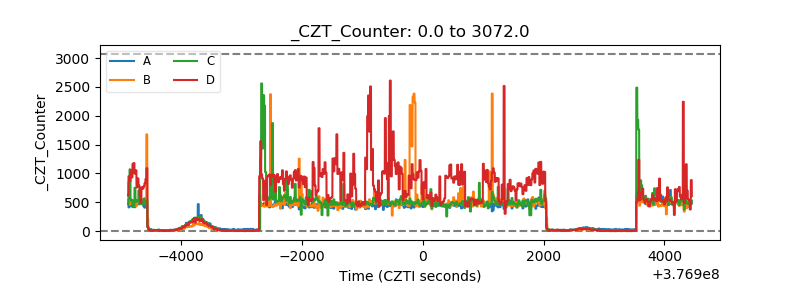 |
| +2.5 Volts monitor | 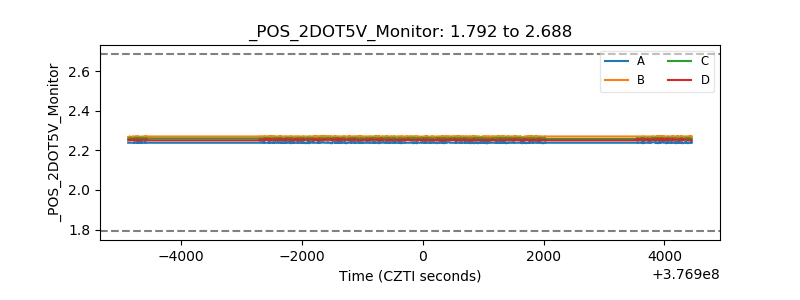 |
| +5 Volts monitor | 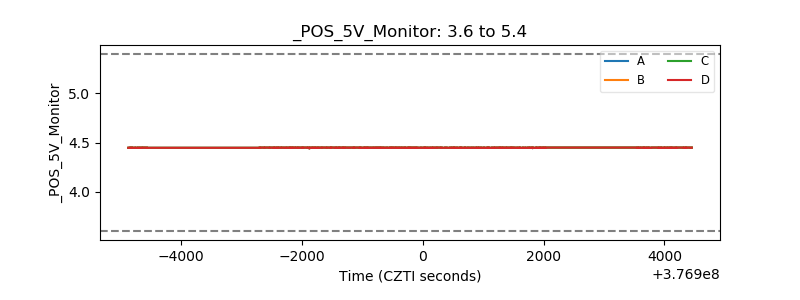 |
| _ROLL_ROT | 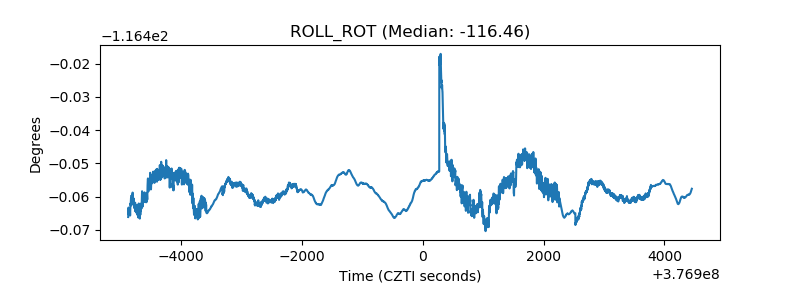 |
| _Roll_DEC | 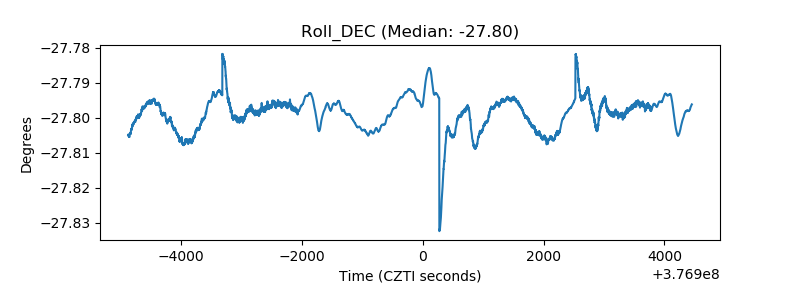 |
| _Roll_RA | 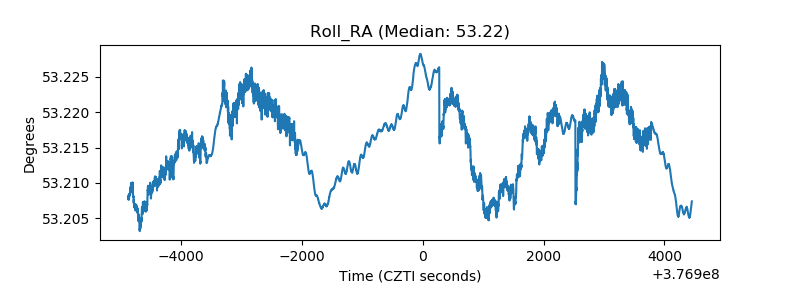 |
| Veto Counter | 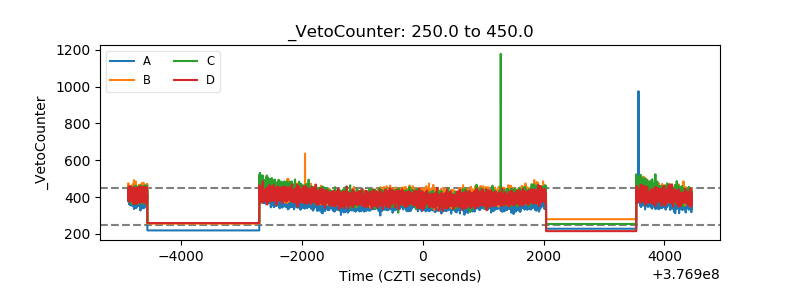 |