| Param | Original file | Final file |
|---|---|---|
| Filename | modeM0/AS1A11_060T01_9000004808_33545cztM0_level2.evt | modeM0/AS1A11_060T01_9000004808_33545cztM0_level2_quad_clean.evt |
| Size (bytes) | 558,426,240 | 84,303,360 |
| Size | 532.6 MB | 80.4 MB |
| Events in quadrant A | 2,987,853 | 539,621 |
| Events in quadrant B | 4,309,576 | 528,059 |
| Events in quadrant C | 3,545,901 | 536,035 |
| Events in quadrant D | 5,638,474 | 505,744 |
| Mode M0 | |||
|---|---|---|---|
| Quadrant | BADHDUFLAG | Total packets | Discarded packets |
| A | 0 | 13128 | 3 |
| B | 0 | 16879 | 2 |
| C | 0 | 14278 | 2 |
| D | 0 | 21076 | 2 |
| Mode M9 | |||
|---|---|---|---|
| Quadrant | BADHDUFLAG | Total packets | Discarded packets |
| A | 0 | 26 | 0 |
| B | 0 | 26 | 0 |
| C | 0 | 26 | 0 |
| D | 0 | 26 | 0 |
| Mode SS | |||
|---|---|---|---|
| Quadrant | BADHDUFLAG | Total packets | Discarded packets |
| A | 0 | 132 | 0 |
| B | 0 | 132 | 0 |
| C | 0 | 132 | 0 |
| D | 0 | 132 | 0 |
| Quadrant | Total seconds | Saturated seconds | Saturation percentage |
|---|---|---|---|
| A | 6350 | 16 | 0.251969% |
| B | 6350 | 363 | 5.716535% |
| C | 6350 | 89 | 1.401575% |
| D | 6350 | 155 | 2.440945% |
Noise dominated data is calculated using 1-second bins in cleaned event files. If a bin has >2000 counts, and if more than 50% of those come from <1% of pixels, then it is considered to be noise-dominated and hence unusable.
| Quadrant | # 1 sec bins | Bins with >0 counts | Bins with >2000 counts | High rate bins dominated by noise | Noise dominated (total time) | Noise dominated (detector-on time) | Marked lightcurve |
|---|---|---|---|---|---|---|---|
| A | 8946 | 6352 | 0 | 0 | 0.00% | 0.00% | 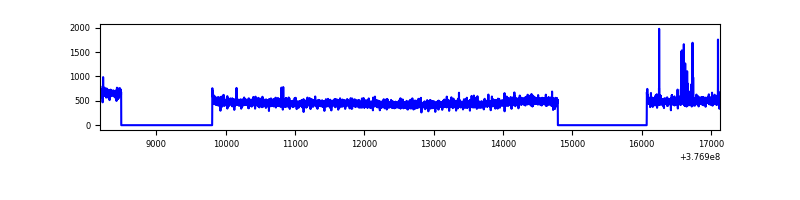 |
| B | 8946 | 6351 | 291 | 291 | 3.25% | 4.58% | 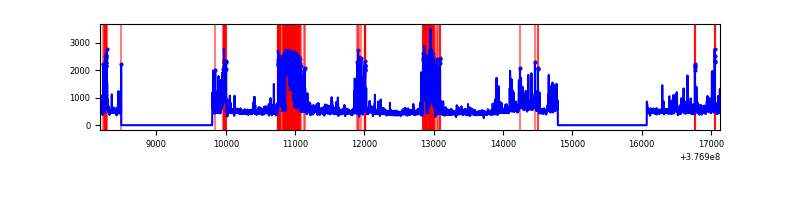 |
| C | 8946 | 6352 | 64 | 64 | 0.72% | 1.01% | 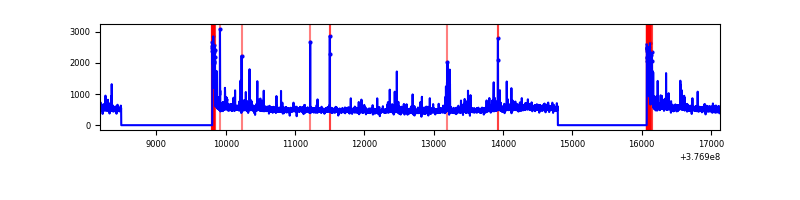 |
| D | 8946 | 6352 | 121 | 121 | 1.35% | 1.90% | 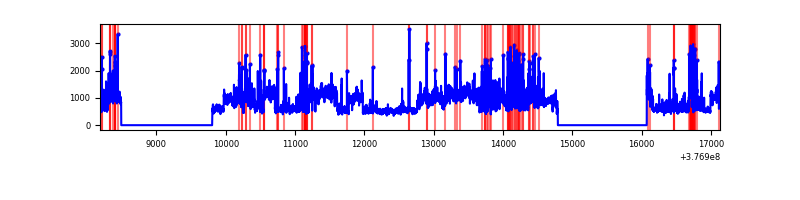 |
Top three noisy pixels from each quadrant. If the there are fewer than three noisy pixels in the level2.evt file, extra rows are filled as -1
| Pixel properties | Quadrant properties | ||||||
|---|---|---|---|---|---|---|---|
| Quadrant | DetID | PixID | Counts | Sigma | Mean | Median | Sigma |
| A | 15 | 169 | 97023 | 641.43 | 745 | 730 | 150.1 |
| A | 13 | 254 | 10739 | 66.67 | 745 | 730 | 150.1 |
| A | 3 | 137 | 7565 | 45.53 | 745 | 730 | 150.1 |
| B | 5 | 172 | 867838 | 6120.76 | 728 | 708 | 141.7 |
| B | 4 | 170 | 267572 | 1883.7 | 728 | 708 | 141.7 |
| B | 4 | 251 | 107124 | 751.15 | 728 | 708 | 141.7 |
| C | 0 | 10 | 301784 | 1773.99 | 725 | 727 | 169.7 |
| C | 15 | 214 | 273794 | 1609.06 | 725 | 727 | 169.7 |
| C | 14 | 254 | 56333 | 327.66 | 725 | 727 | 169.7 |
| D | 8 | 195 | 1919004 | 10854.78 | 722 | 700 | 176.7 |
| D | 2 | 250 | 421215 | 2379.5 | 722 | 700 | 176.7 |
| D | 2 | 249 | 149110 | 839.78 | 722 | 700 | 176.7 |
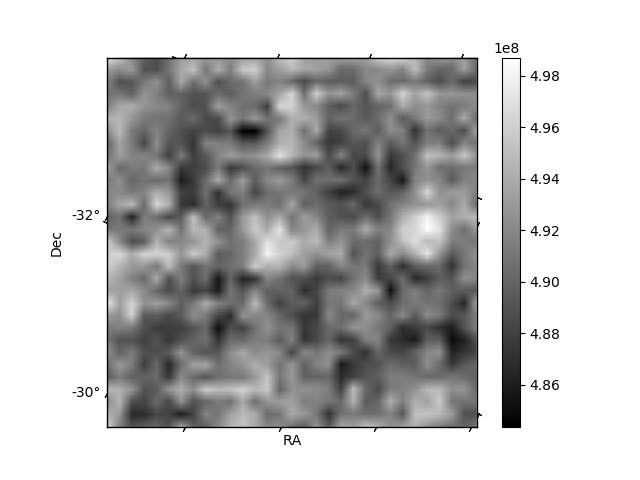
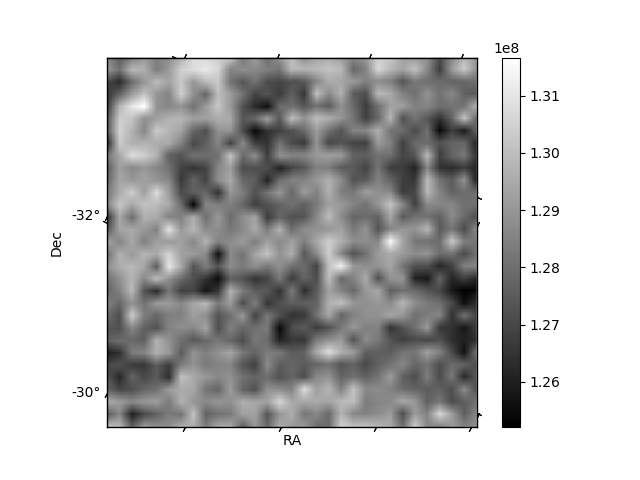
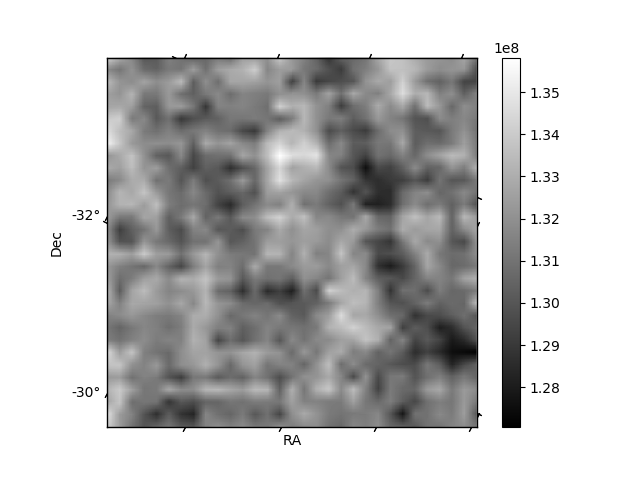
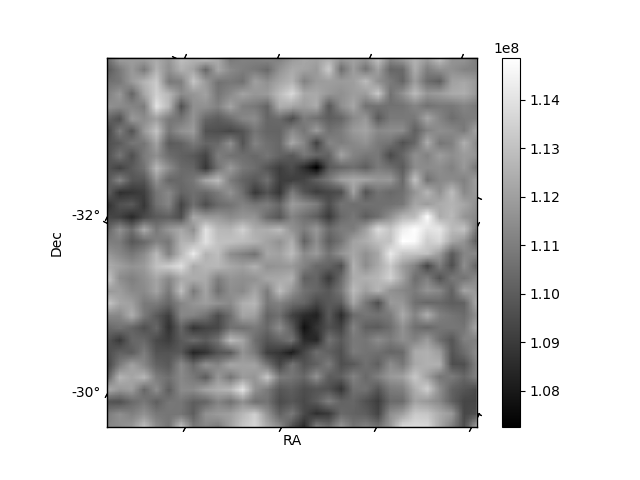
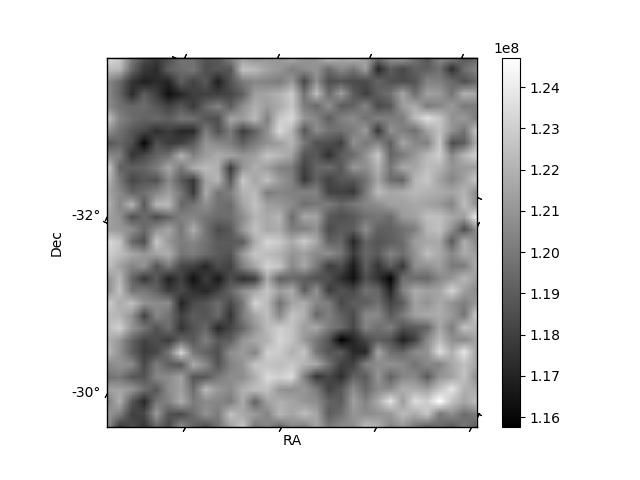
Histogram calculated using DETX and DETY for each event in the final _common_clean file
| Quadrant A | 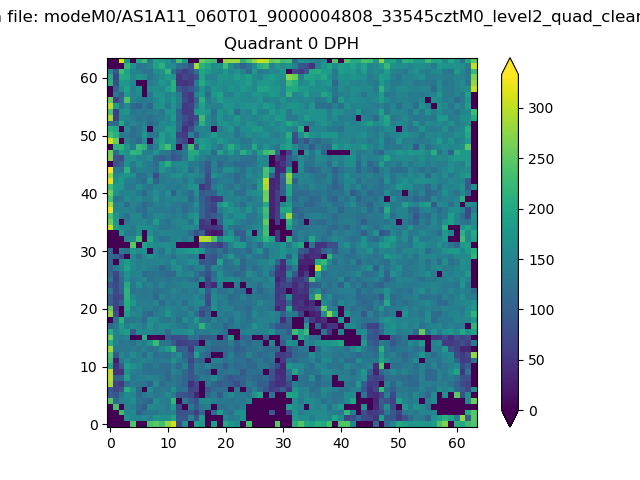 |
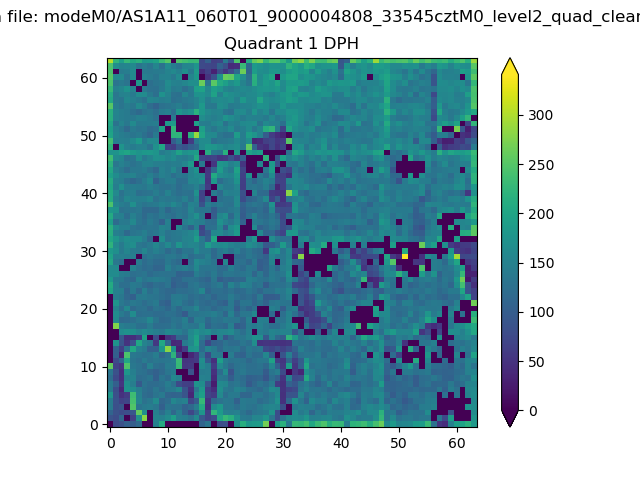 |
Quadrant B |
|---|---|---|---|
| Quadrant D | 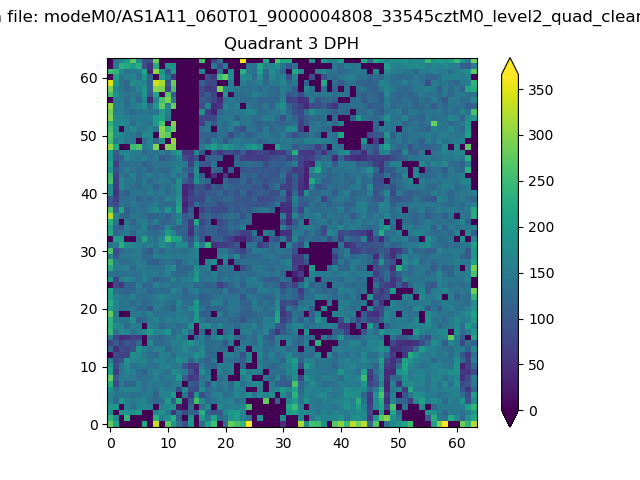 |
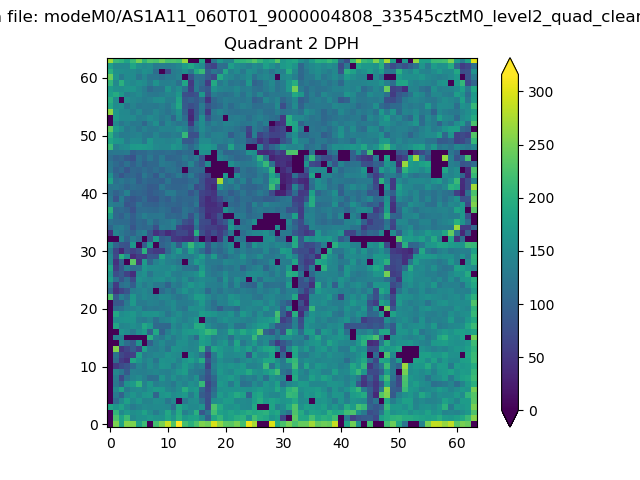 |
Quadrant C |
| Plot type | Count rate plots | Images |
|---|---|---|
| Comparison with Poisson distribution Blue bars denote a histogram of data divided into 1 sec bins. Red curve is a Poisson curve with rate = median count rate of data. |
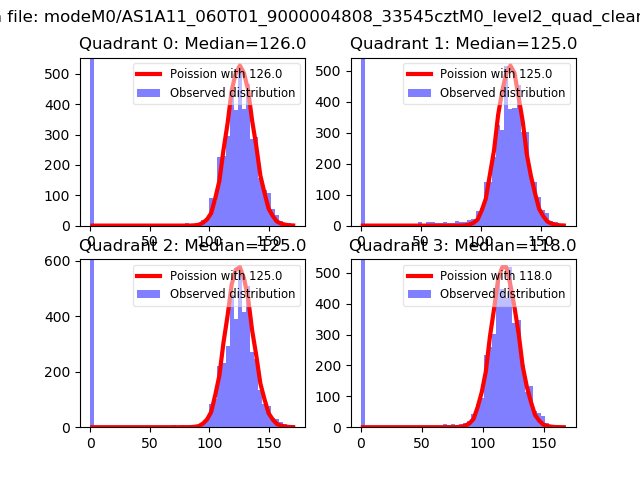 |
 |
| Quadrant-wise count rates Data is divided into 100 sec bins |
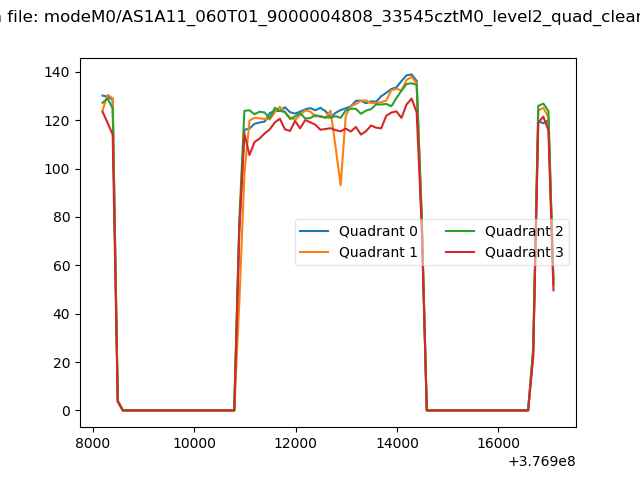 |
|
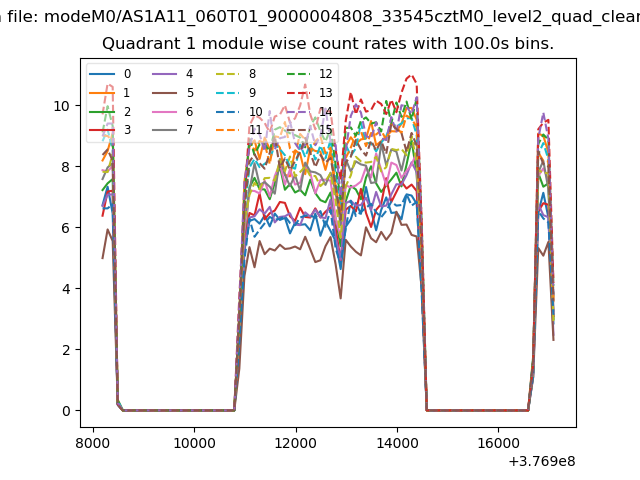
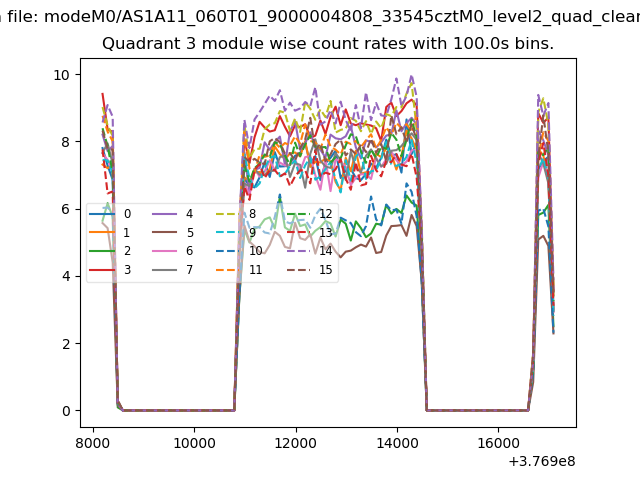
| Module-wise count rates for Quadrant A Data is divided into 100 sec bins |
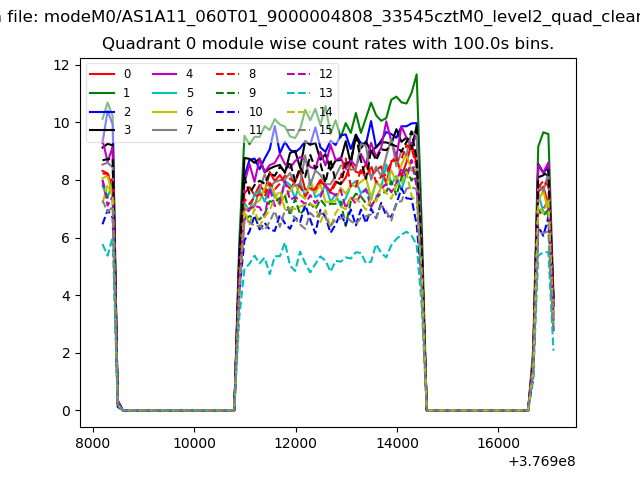 |
 |
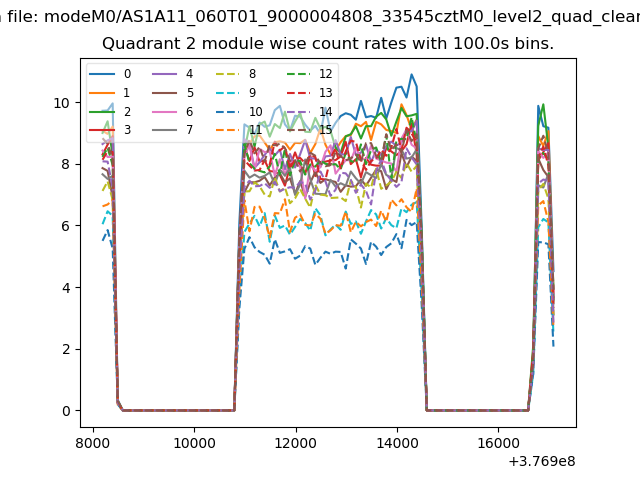
| Module-wise count rates for Quadrant B Data is divided into 100 sec bins |
 |
 |
| Module-wise count rates for Quadrant C Data is divided into 100 sec bins |
 |
 |
| Module-wise count rates for Quadrant D Data is divided into 100 sec bins |
 |
 |
| Parameter | Plot |
|---|---|
| CZT HV Monitor | 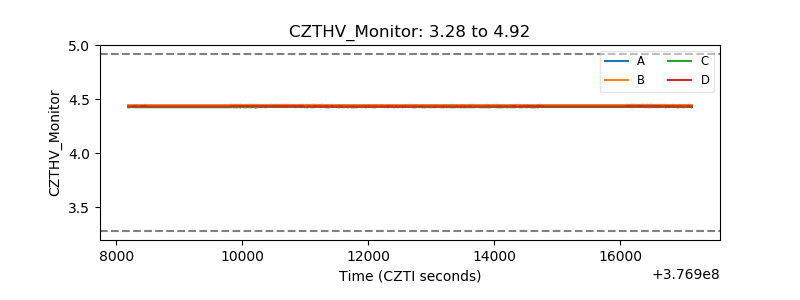 |
| D_VDD | 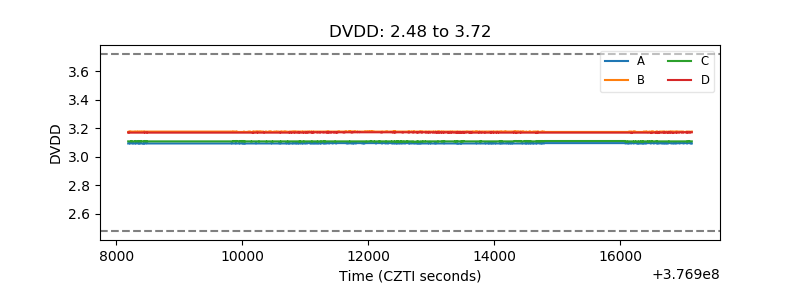 |
| Temperature 1 | 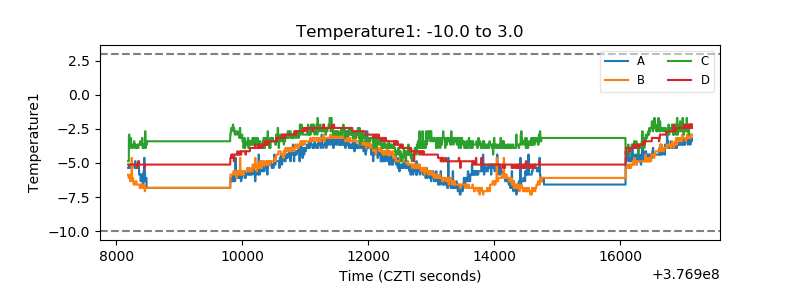 |
| Veto HV Monitor | 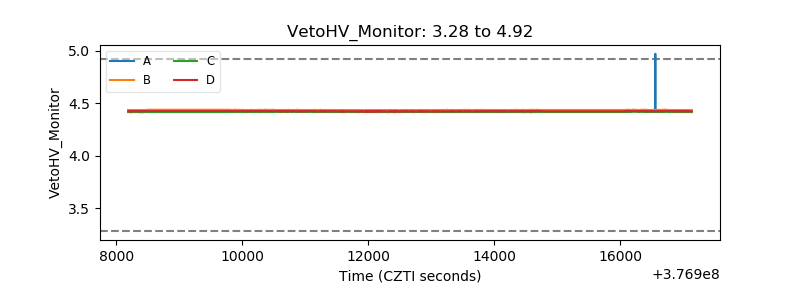 |
| Veto LLD | 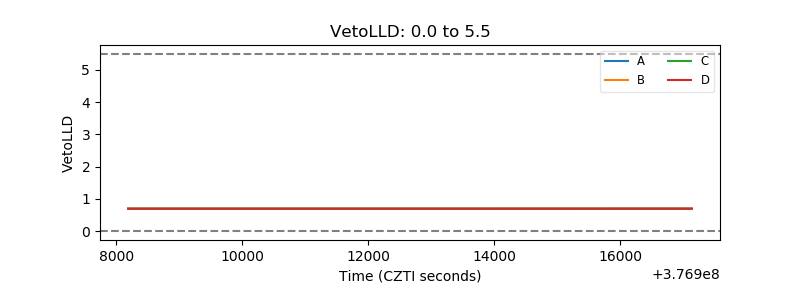 |
| Alpha Counter | 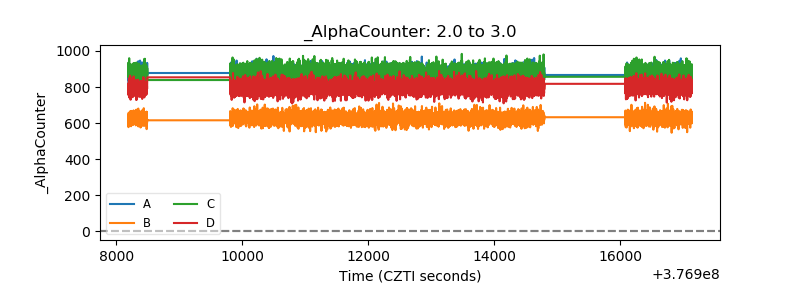 |
| _CPM_Rate | 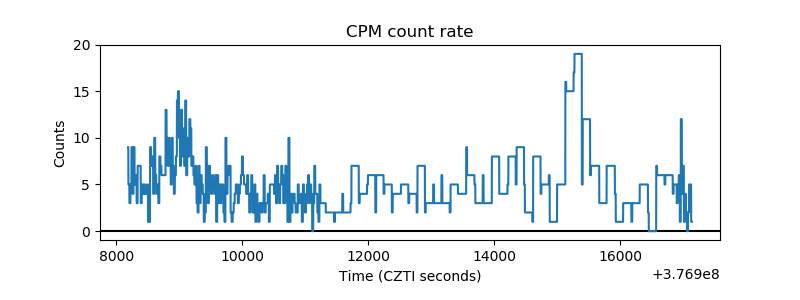 |
| CZT Counter | 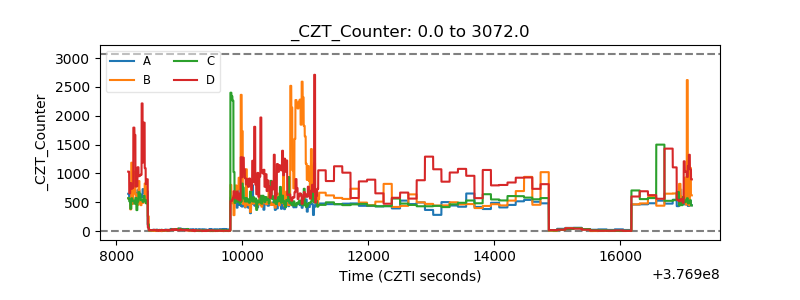 |
| +2.5 Volts monitor | 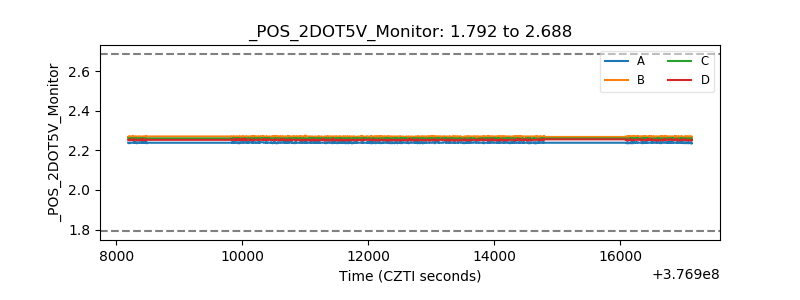 |
| +5 Volts monitor |  |
| _ROLL_ROT | 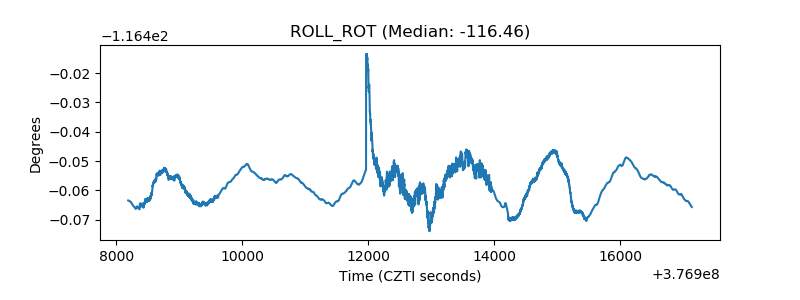 |
| _Roll_DEC | 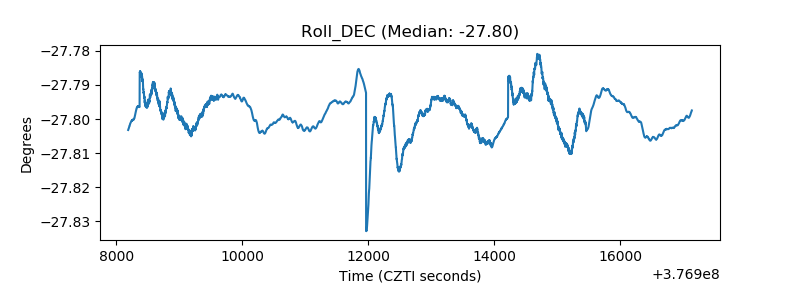 |
| _Roll_RA | 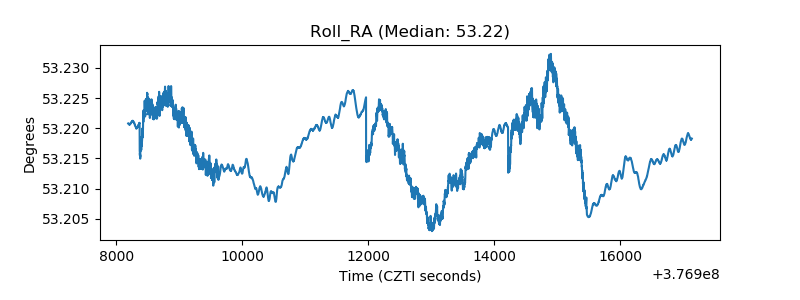 |
| Veto Counter | 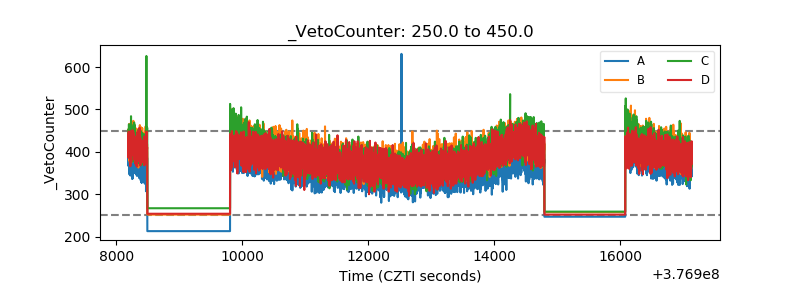 |