| Param | Original file | Final file |
|---|---|---|
| Filename | modeM0/AS1A11_060T01_9000004808_33547cztM0_level2.evt | modeM0/AS1A11_060T01_9000004808_33547cztM0_level2_quad_clean.evt |
| Size (bytes) | 914,598,720 | 155,280,960 |
| Size | 872.2 MB | 148.1 MB |
| Events in quadrant A | 5,343,551 | 1,010,146 |
| Events in quadrant B | 6,071,507 | 1,008,959 |
| Events in quadrant C | 6,137,185 | 998,530 |
| Events in quadrant D | 9,425,145 | 945,586 |
| Mode M0 | |||
|---|---|---|---|
| Quadrant | BADHDUFLAG | Total packets | Discarded packets |
| A | 0 | 22839 | 4 |
| B | 0 | 24915 | 3 |
| C | 0 | 24836 | 3 |
| D | 0 | 35267 | 3 |
| Mode M9 | |||
|---|---|---|---|
| Quadrant | BADHDUFLAG | Total packets | Discarded packets |
| A | 0 | 40 | 0 |
| B | 0 | 40 | 0 |
| C | 0 | 40 | 0 |
| D | 0 | 41 | 0 |
| Mode SS | |||
|---|---|---|---|
| Quadrant | BADHDUFLAG | Total packets | Discarded packets |
| A | 0 | 216 | 0 |
| B | 0 | 216 | 0 |
| C | 0 | 216 | 0 |
| D | 0 | 216 | 0 |
| Quadrant | Total seconds | Saturated seconds | Saturation percentage |
|---|---|---|---|
| A | 10691 | 118 | 1.103732% |
| B | 10691 | 163 | 1.524647% |
| C | 10691 | 207 | 1.936208% |
| D | 10691 | 577 | 5.397063% |
Noise dominated data is calculated using 1-second bins in cleaned event files. If a bin has >2000 counts, and if more than 50% of those come from <1% of pixels, then it is considered to be noise-dominated and hence unusable.
| Quadrant | # 1 sec bins | Bins with >0 counts | Bins with >2000 counts | High rate bins dominated by noise | Noise dominated (total time) | Noise dominated (detector-on time) | Marked lightcurve |
|---|---|---|---|---|---|---|---|
| A | 13497 | 10693 | 42 | 42 | 0.31% | 0.39% | 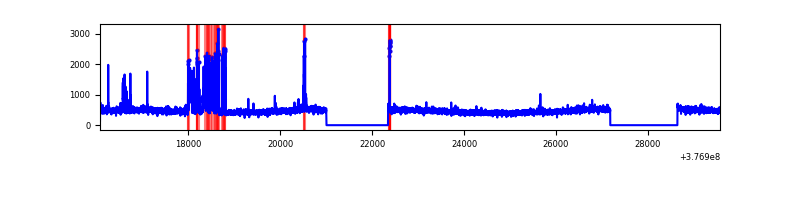 |
| B | 13497 | 10693 | 98 | 98 | 0.73% | 0.92% | 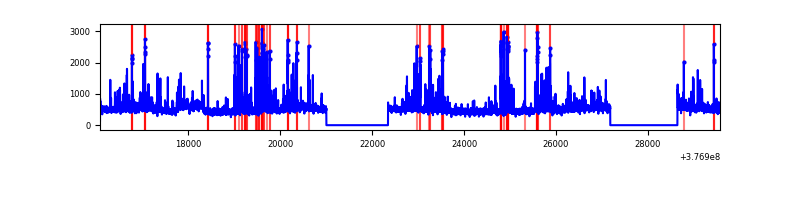 |
| C | 13497 | 10693 | 141 | 141 | 1.04% | 1.32% | 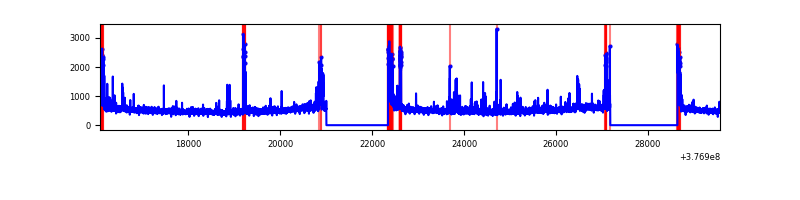 |
| D | 13497 | 10692 | 565 | 565 | 4.19% | 5.28% | 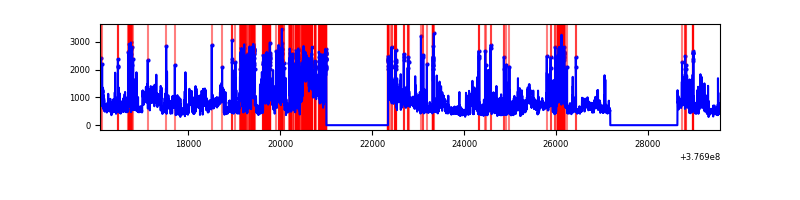 |
Top three noisy pixels from each quadrant. If the there are fewer than three noisy pixels in the level2.evt file, extra rows are filled as -1
| Pixel properties | Quadrant properties | ||||||
|---|---|---|---|---|---|---|---|
| Quadrant | DetID | PixID | Counts | Sigma | Mean | Median | Sigma |
| A | 15 | 169 | 497457 | 1995.48 | 1247 | 1223 | 248.7 |
| A | 13 | 6 | 22265 | 84.62 | 1247 | 1223 | 248.7 |
| A | 13 | 254 | 18566 | 69.74 | 1247 | 1223 | 248.7 |
| B | 5 | 172 | 466409 | 1955.37 | 1242 | 1209 | 237.9 |
| B | 4 | 170 | 180029 | 751.63 | 1242 | 1209 | 237.9 |
| B | 0 | 229 | 128939 | 536.89 | 1242 | 1209 | 237.9 |
| C | 0 | 10 | 508015 | 1827.39 | 1199 | 1208 | 277.3 |
| C | 15 | 214 | 458511 | 1648.89 | 1199 | 1208 | 277.3 |
| C | 3 | 233 | 275857 | 990.3 | 1199 | 1208 | 277.3 |
| D | 8 | 195 | 2098222 | 7195.89 | 1193 | 1161 | 291.4 |
| D | 1 | 47 | 1441614 | 4942.8 | 1193 | 1161 | 291.4 |
| D | 2 | 250 | 496833 | 1700.86 | 1193 | 1161 | 291.4 |
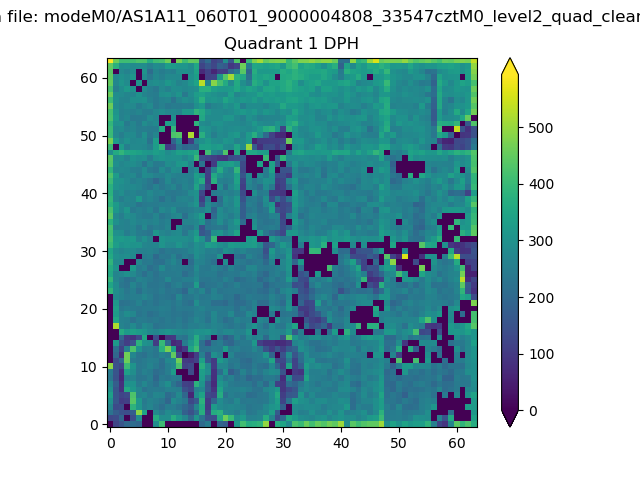
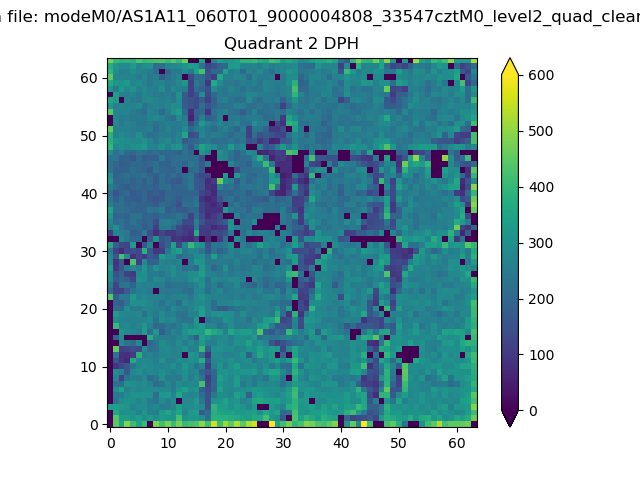
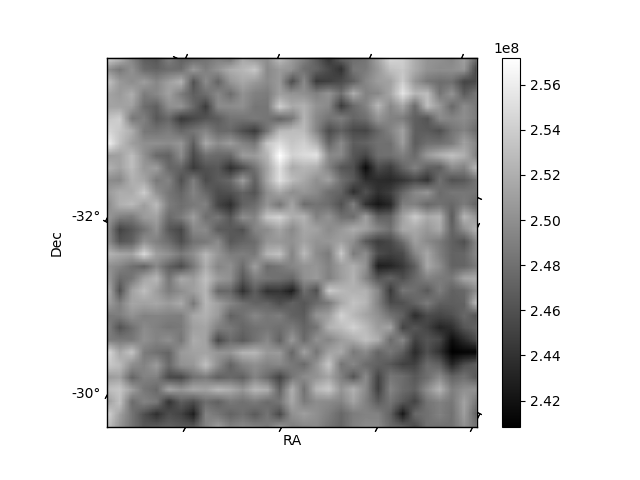
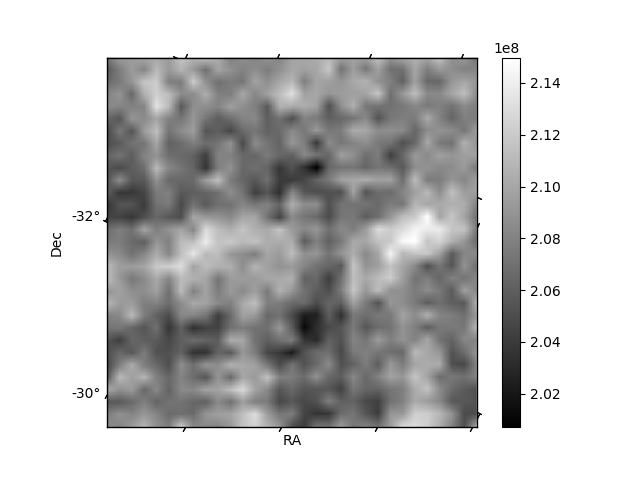
Histogram calculated using DETX and DETY for each event in the final _common_clean file
| Quadrant A |  |
 |
Quadrant B |
|---|---|---|---|
| Quadrant D |  |
 |
Quadrant C |
| Plot type | Count rate plots | Images |
|---|---|---|
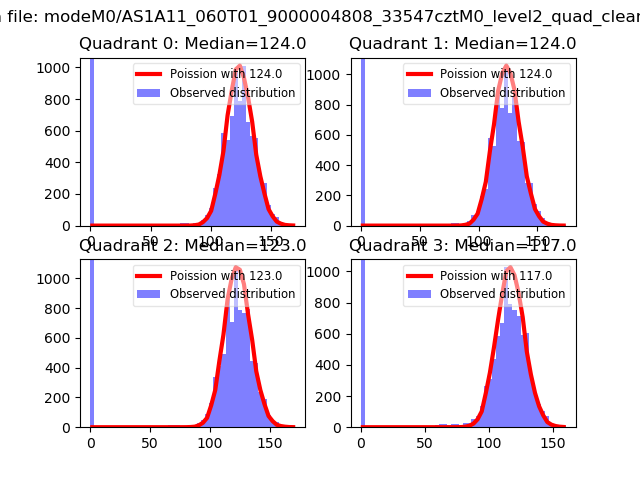
| Comparison with Poisson distribution Blue bars denote a histogram of data divided into 1 sec bins. Red curve is a Poisson curve with rate = median count rate of data. |
 |
 |
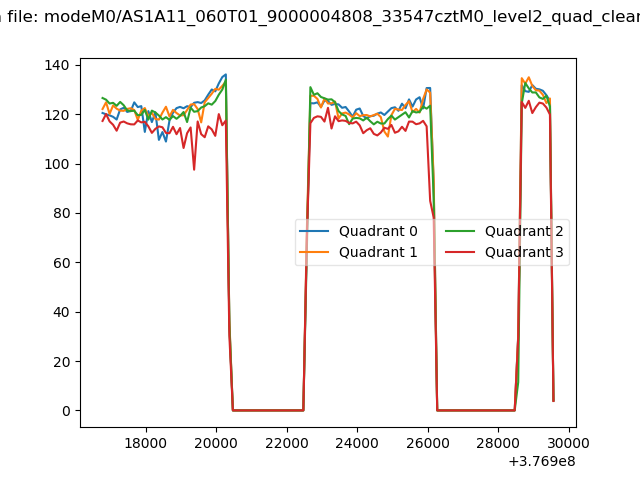
| Quadrant-wise count rates Data is divided into 100 sec bins |
 |
|
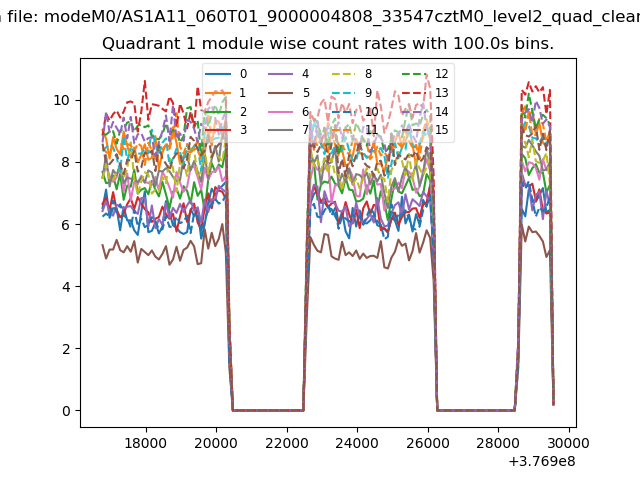
| Module-wise count rates for Quadrant A Data is divided into 100 sec bins |
 |
 |
| Module-wise count rates for Quadrant B Data is divided into 100 sec bins |
 |
 |
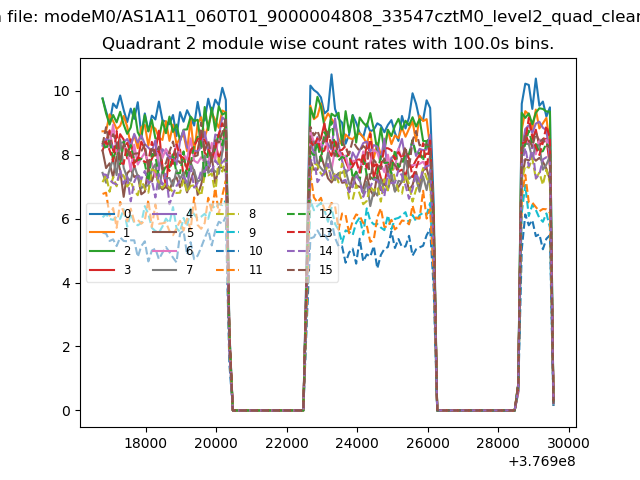
| Module-wise count rates for Quadrant C Data is divided into 100 sec bins |
 |
 |
| Module-wise count rates for Quadrant D Data is divided into 100 sec bins |
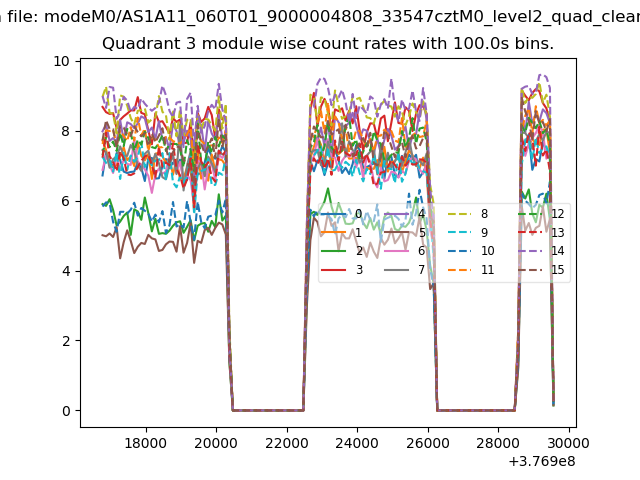 |
 |
| Parameter | Plot |
|---|---|
| CZT HV Monitor | 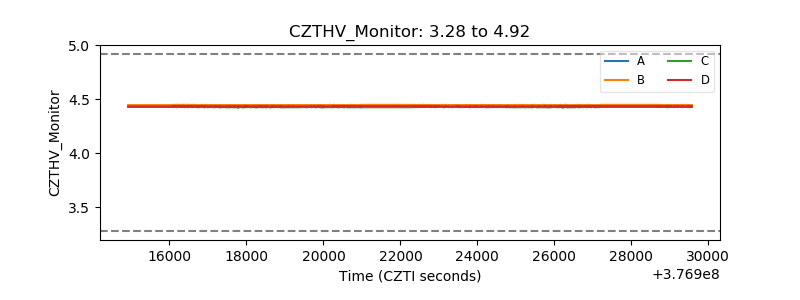 |
| D_VDD | 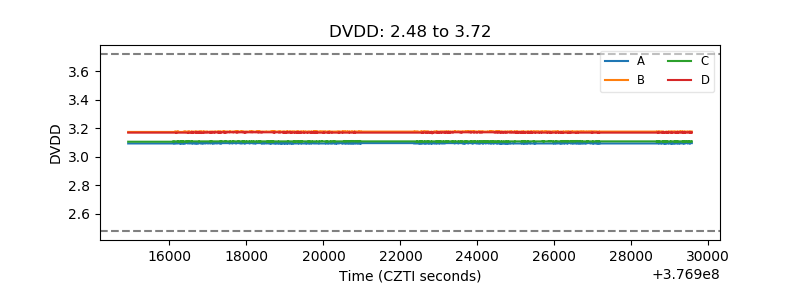 |
| Temperature 1 | 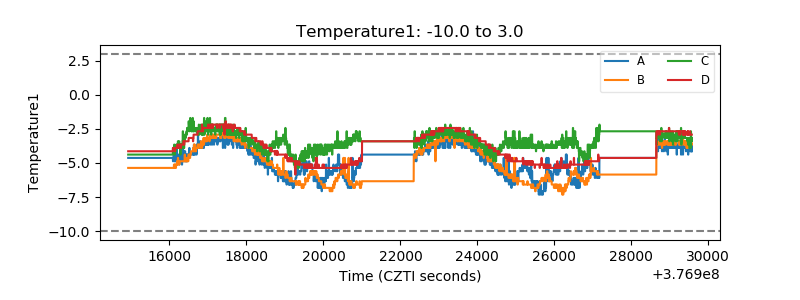 |
| Veto HV Monitor | 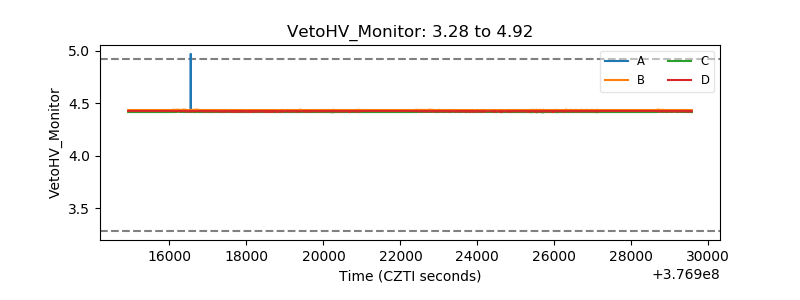 |
| Veto LLD | 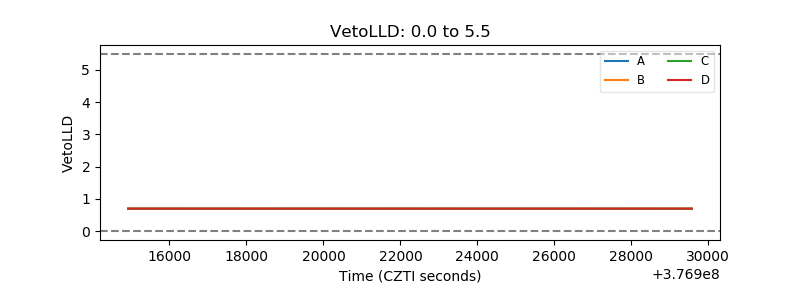 |
| Alpha Counter | 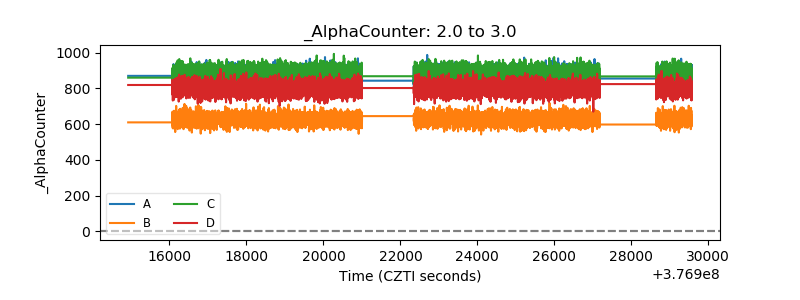 |
| _CPM_Rate | 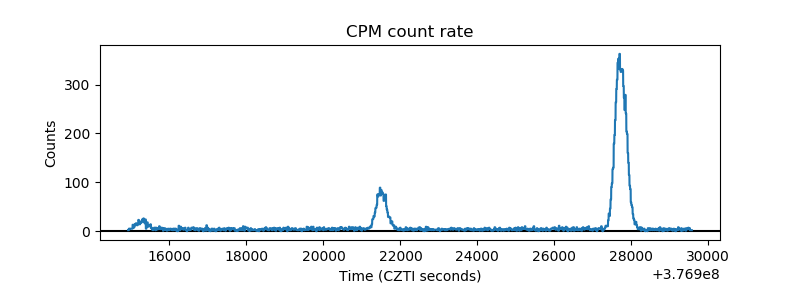 |
| CZT Counter | 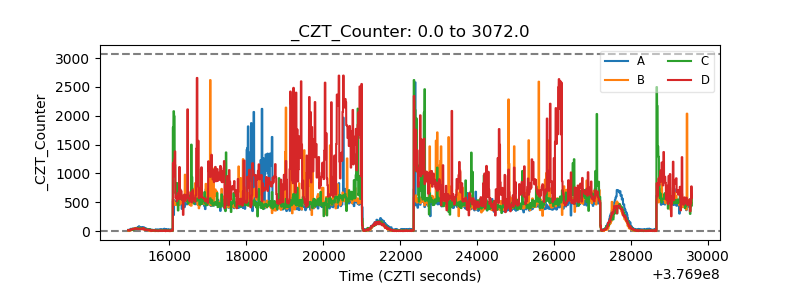 |
| +2.5 Volts monitor |  |
| +5 Volts monitor |  |
| _ROLL_ROT | 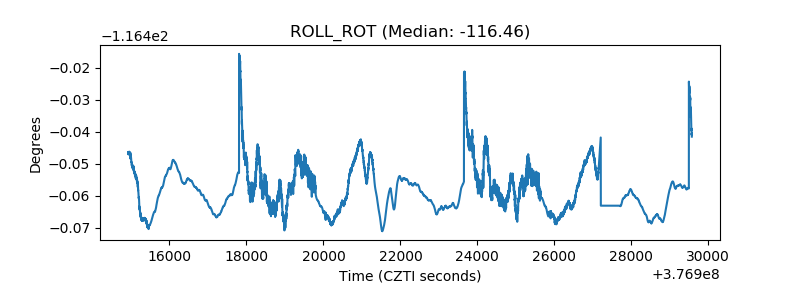 |
| _Roll_DEC | 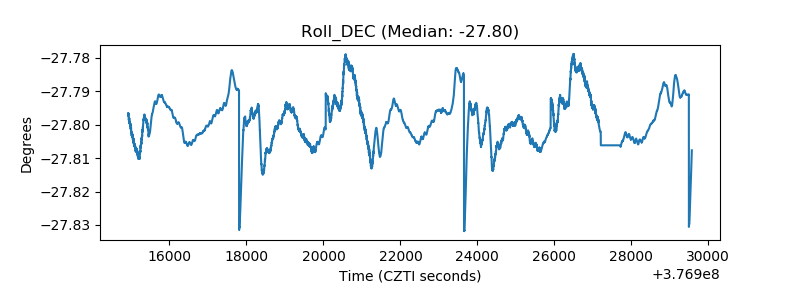 |
| _Roll_RA | 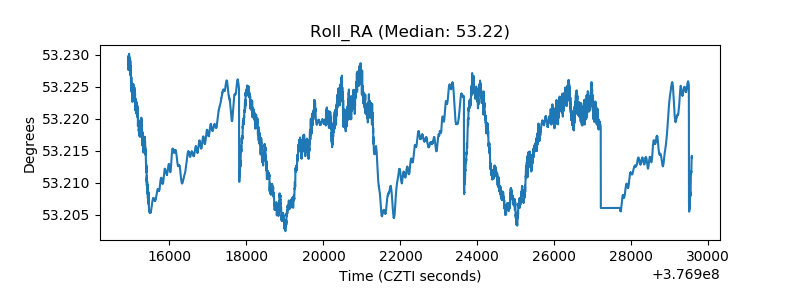 |
| Veto Counter | 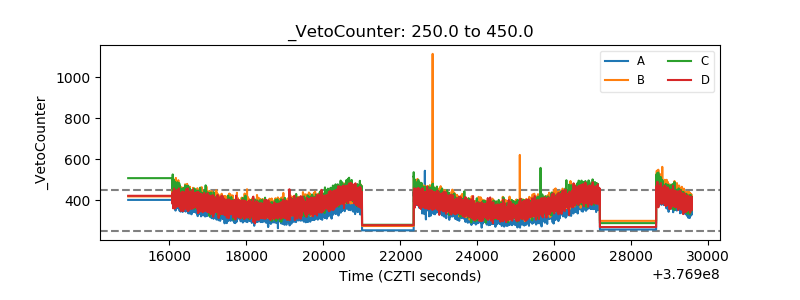 |