| Param | Original file | Final file |
|---|---|---|
| Filename | modeM0/AS1A11_060T01_9000004808_33548cztM0_level2.evt | modeM0/AS1A11_060T01_9000004808_33548cztM0_level2_quad_clean.evt |
| Size (bytes) | 424,157,760 | 82,774,080 |
| Size | 404.5 MB | 78.9 MB |
| Events in quadrant A | 2,537,393 | 544,348 |
| Events in quadrant B | 2,959,049 | 540,406 |
| Events in quadrant C | 3,099,904 | 525,464 |
| Events in quadrant D | 3,872,598 | 508,393 |
| Mode M0 | |||
|---|---|---|---|
| Quadrant | BADHDUFLAG | Total packets | Discarded packets |
| A | 0 | 11219 | 3 |
| B | 0 | 12344 | 2 |
| C | 0 | 12615 | 2 |
| D | 0 | 15328 | 2 |
| Mode M9 | |||
|---|---|---|---|
| Quadrant | BADHDUFLAG | Total packets | Discarded packets |
| A | 0 | 24 | 0 |
| B | 0 | 24 | 0 |
| C | 0 | 24 | 0 |
| D | 0 | 25 | 0 |
| Mode SS | |||
|---|---|---|---|
| Quadrant | BADHDUFLAG | Total packets | Discarded packets |
| A | 0 | 114 | 0 |
| B | 0 | 114 | 0 |
| C | 0 | 114 | 0 |
| D | 0 | 114 | 0 |
| Quadrant | Total seconds | Saturated seconds | Saturation percentage |
|---|---|---|---|
| A | 5541 | 10 | 0.180473% |
| B | 5541 | 83 | 1.497925% |
| C | 5541 | 87 | 1.570114% |
| D | 5541 | 117 | 2.111532% |
Noise dominated data is calculated using 1-second bins in cleaned event files. If a bin has >2000 counts, and if more than 50% of those come from <1% of pixels, then it is considered to be noise-dominated and hence unusable.
| Quadrant | # 1 sec bins | Bins with >0 counts | Bins with >2000 counts | High rate bins dominated by noise | Noise dominated (total time) | Noise dominated (detector-on time) | Marked lightcurve |
|---|---|---|---|---|---|---|---|
| A | 7124 | 5542 | 1 | 1 | 0.01% | 0.02% | 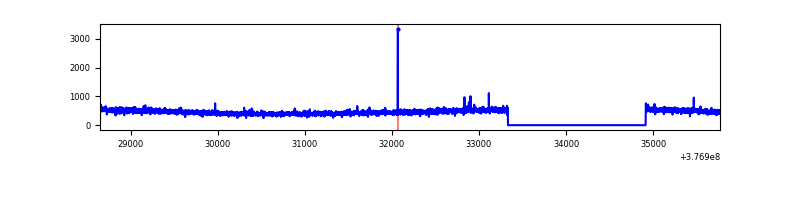 |
| B | 7124 | 5542 | 58 | 58 | 0.81% | 1.05% | 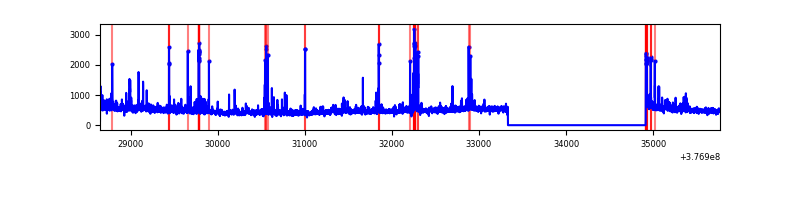 |
| C | 7124 | 5542 | 63 | 63 | 0.88% | 1.14% | 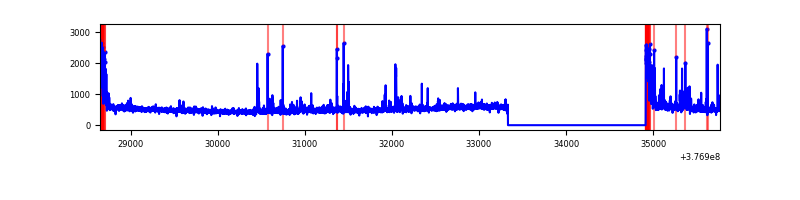 |
| D | 7124 | 5542 | 119 | 119 | 1.67% | 2.15% | 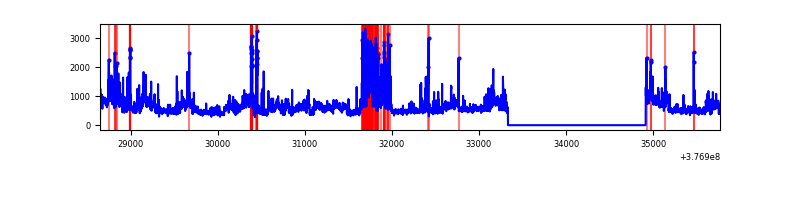 |
Top three noisy pixels from each quadrant. If the there are fewer than three noisy pixels in the level2.evt file, extra rows are filled as -1
| Pixel properties | Quadrant properties | ||||||
|---|---|---|---|---|---|---|---|
| Quadrant | DetID | PixID | Counts | Sigma | Mean | Median | Sigma |
| A | 7 | 16 | 10540 | 75.73 | 651 | 638 | 130.8 |
| A | 13 | 254 | 9541 | 68.09 | 651 | 638 | 130.8 |
| A | 13 | 6 | 6955 | 48.31 | 651 | 638 | 130.8 |
| B | 4 | 170 | 97676 | 768.18 | 645 | 628 | 126.3 |
| B | 0 | 229 | 95948 | 754.5 | 645 | 628 | 126.3 |
| B | 5 | 255 | 79974 | 628.06 | 645 | 628 | 126.3 |
| C | 15 | 214 | 242613 | 1664.25 | 623 | 628 | 145.4 |
| C | 0 | 10 | 231524 | 1587.99 | 623 | 628 | 145.4 |
| C | 1 | 23 | 71346 | 486.36 | 623 | 628 | 145.4 |
| D | 8 | 195 | 712871 | 4665.27 | 625 | 609 | 152.7 |
| D | 2 | 250 | 341751 | 2234.46 | 625 | 609 | 152.7 |
| D | 1 | 47 | 149771 | 977.0 | 625 | 609 | 152.7 |
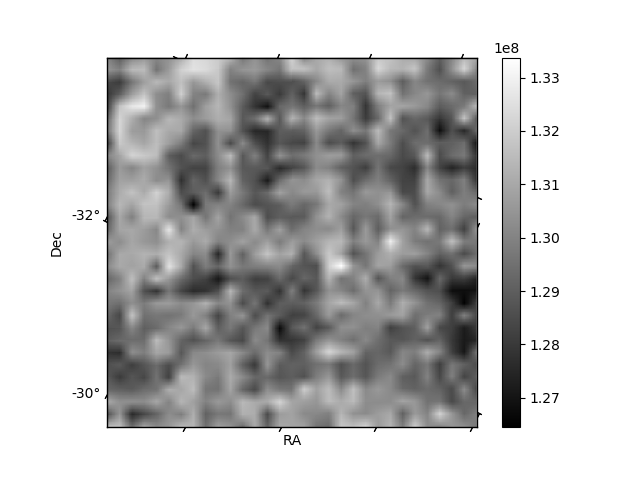
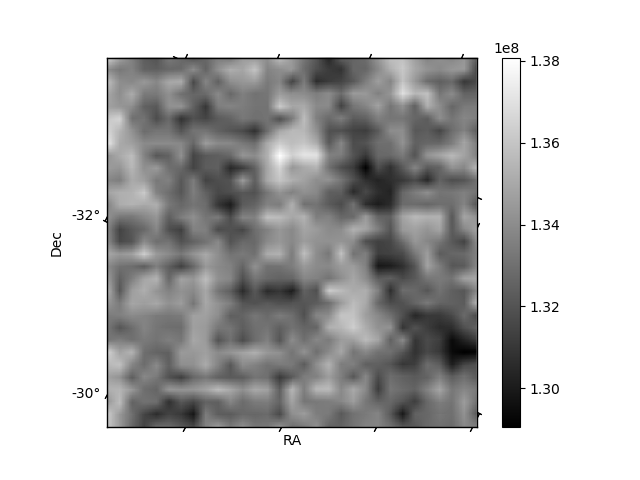
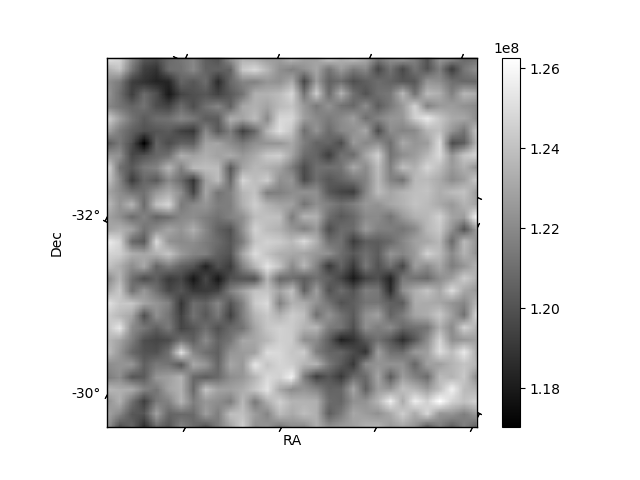
Histogram calculated using DETX and DETY for each event in the final _common_clean file
| Quadrant A | 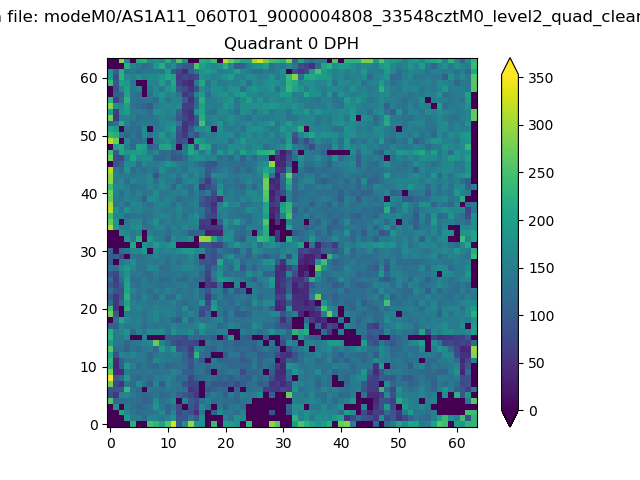 |
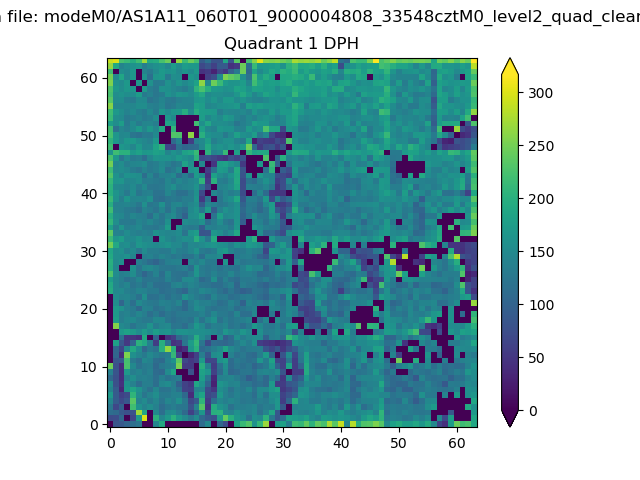 |
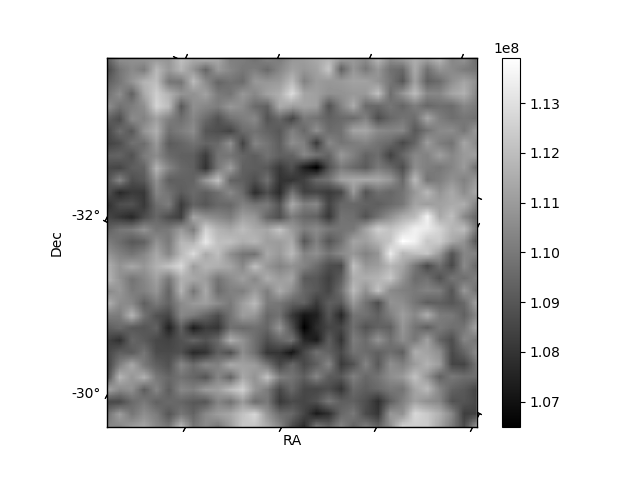
Quadrant B |
|---|---|---|---|
| Quadrant D | 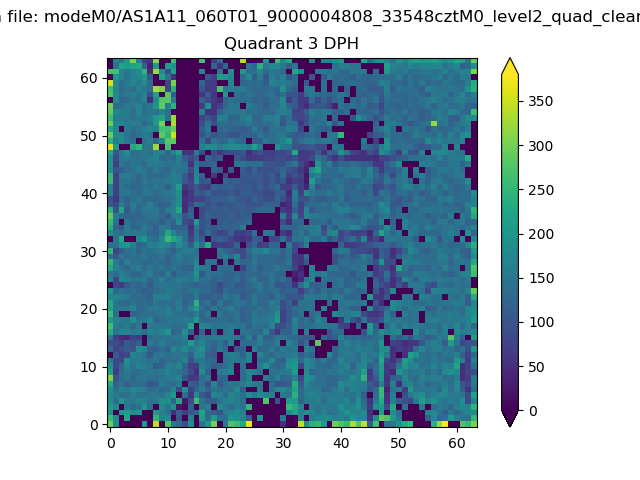 |
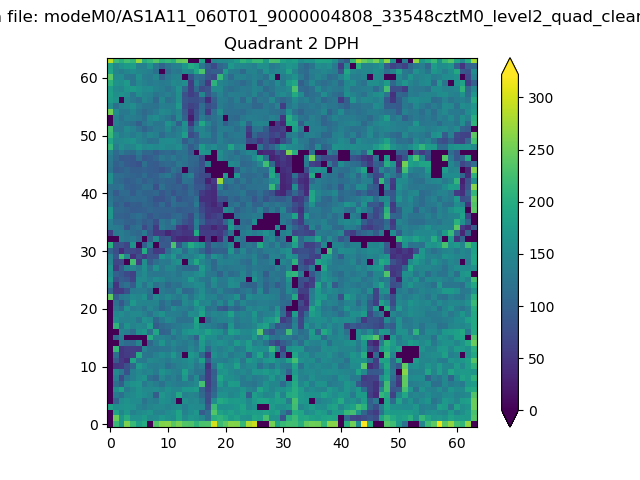 |
Quadrant C |
| Plot type | Count rate plots | Images |
|---|---|---|
| Comparison with Poisson distribution Blue bars denote a histogram of data divided into 1 sec bins. Red curve is a Poisson curve with rate = median count rate of data. |
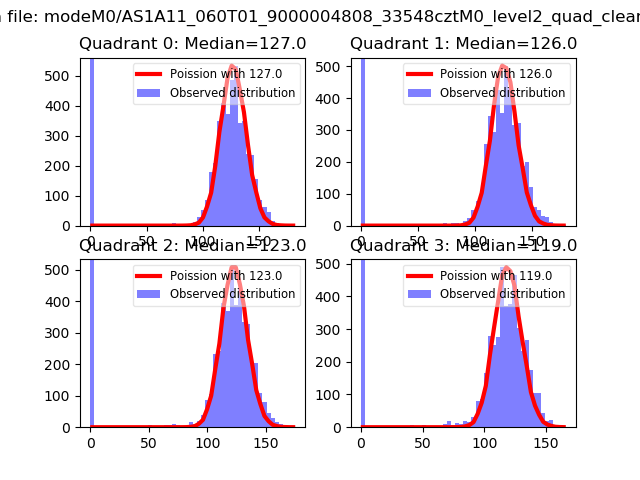 |
 |
| Quadrant-wise count rates Data is divided into 100 sec bins |
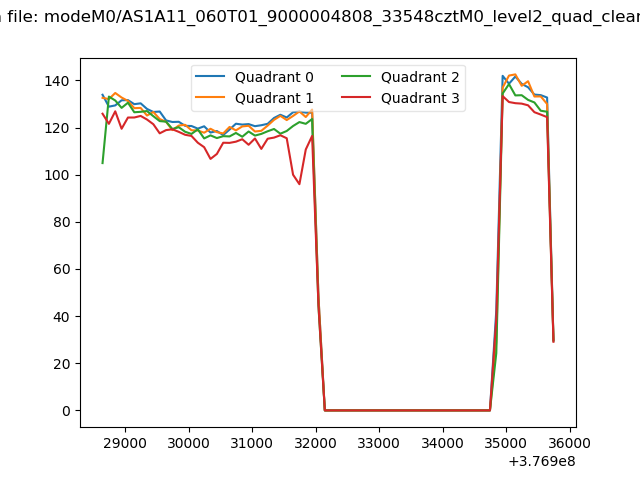 |
|
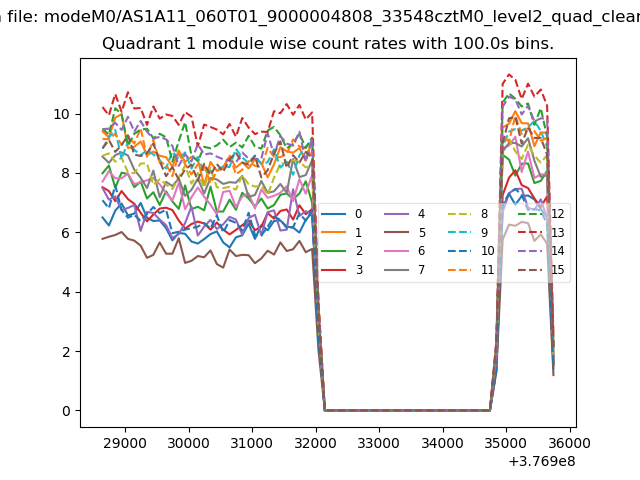
| Module-wise count rates for Quadrant A Data is divided into 100 sec bins |
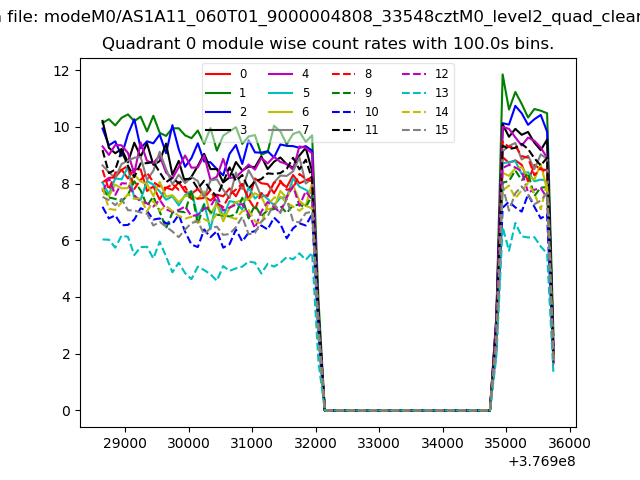 |
 |
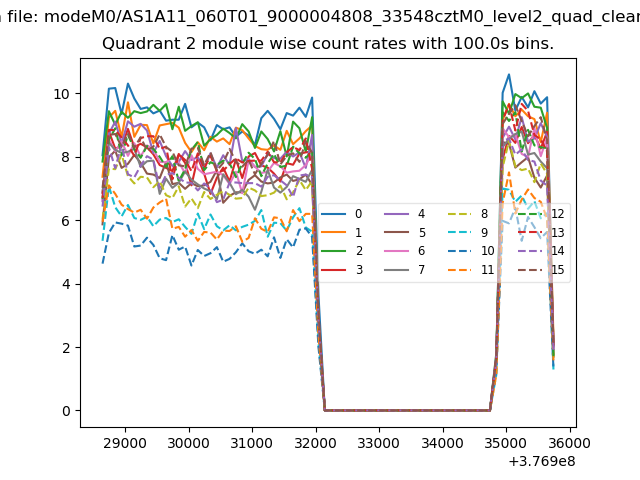
| Module-wise count rates for Quadrant B Data is divided into 100 sec bins |
 |
 |
| Module-wise count rates for Quadrant C Data is divided into 100 sec bins |
 |
 |
| Module-wise count rates for Quadrant D Data is divided into 100 sec bins |
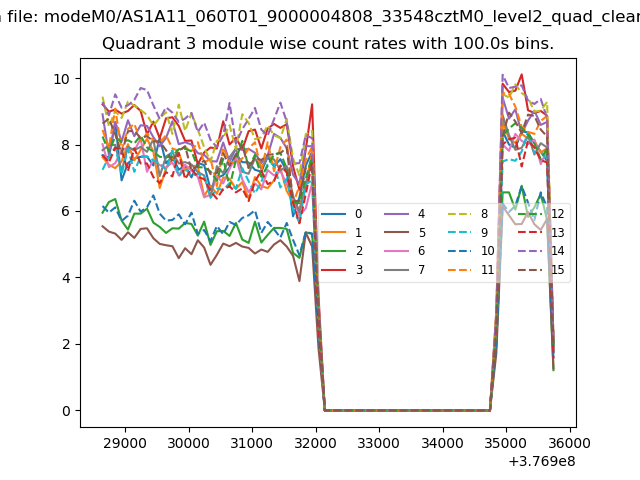 |
 |
| Parameter | Plot |
|---|---|
| CZT HV Monitor | 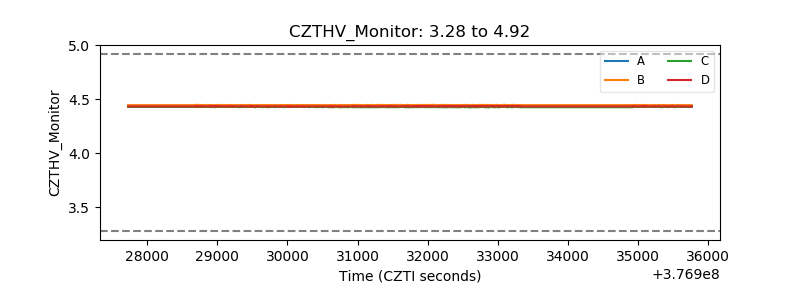 |
| D_VDD | 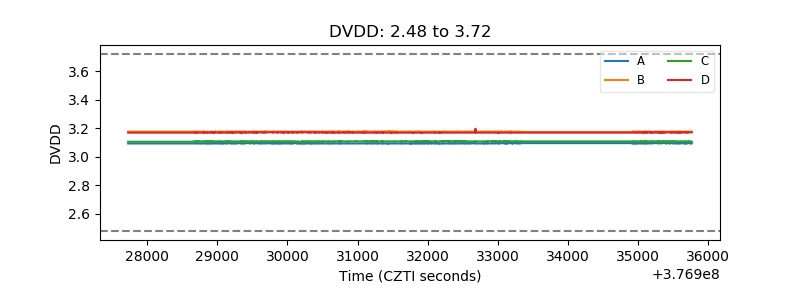 |
| Temperature 1 | 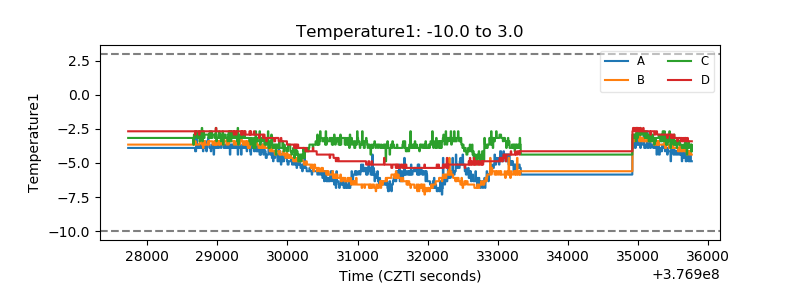 |
| Veto HV Monitor | 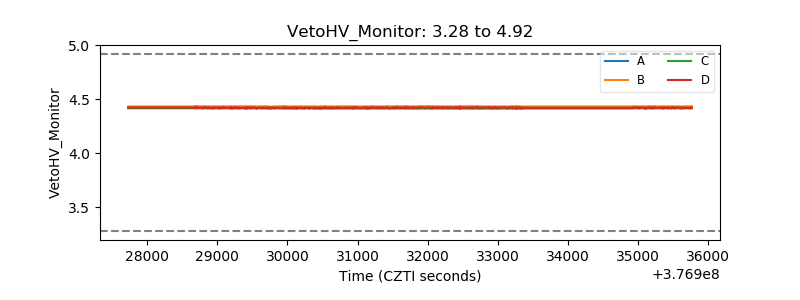 |
| Veto LLD | 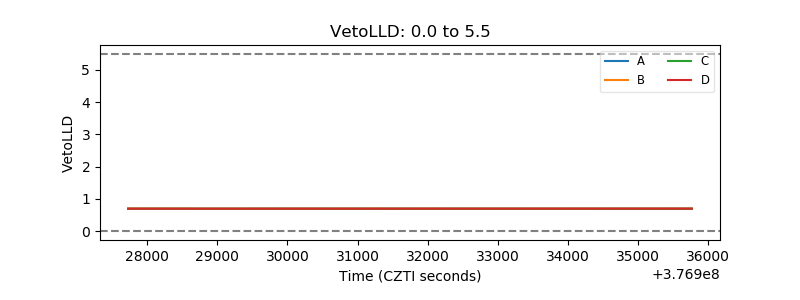 |
| Alpha Counter | 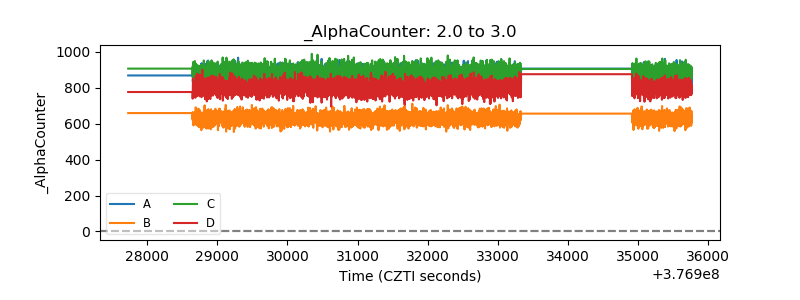 |
| _CPM_Rate | 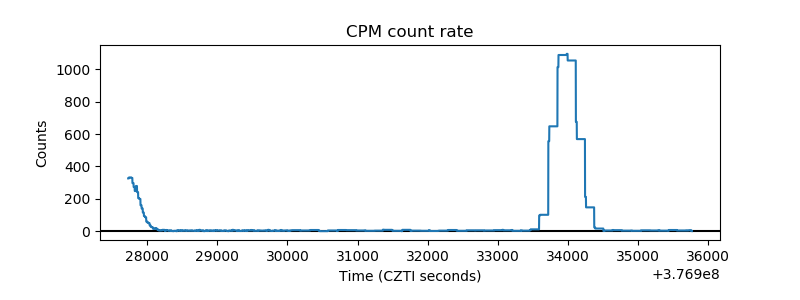 |
| CZT Counter |  |
| +2.5 Volts monitor |  |
| +5 Volts monitor |  |
| _ROLL_ROT | 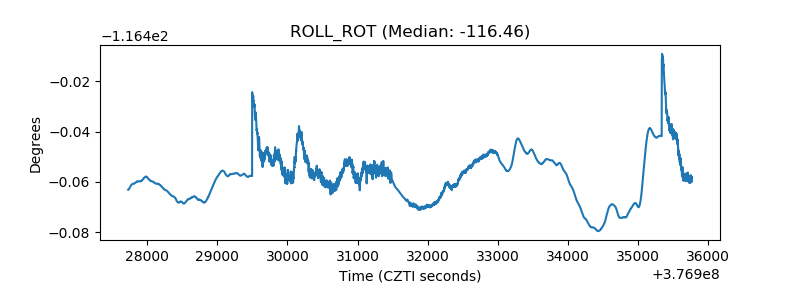 |
| _Roll_DEC | 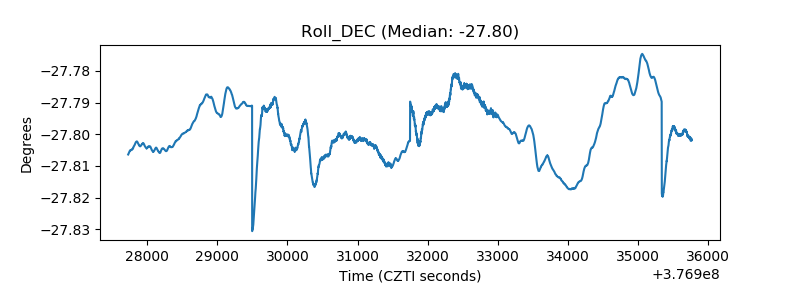 |
| _Roll_RA |  |
| Veto Counter | 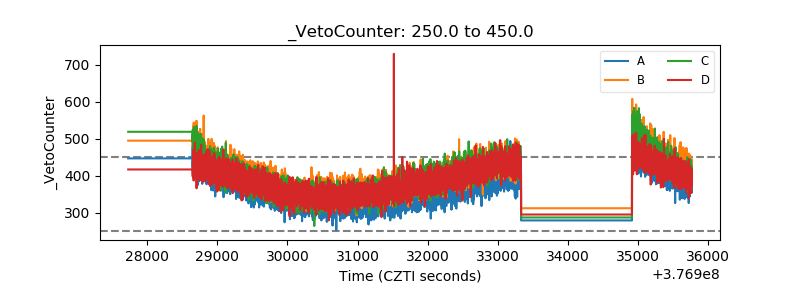 |