| Param | Original file | Final file |
|---|---|---|
| Filename | modeM0/AS1A11_060T01_9000004808_33549cztM0_level2.evt | modeM0/AS1A11_060T01_9000004808_33549cztM0_level2_quad_clean.evt |
| Size (bytes) | 456,408,000 | 80,300,160 |
| Size | 435.3 MB | 76.6 MB |
| Events in quadrant A | 2,611,344 | 527,292 |
| Events in quadrant B | 3,254,411 | 524,016 |
| Events in quadrant C | 3,911,813 | 496,501 |
| Events in quadrant D | 3,659,848 | 487,088 |
| Mode M0 | |||
|---|---|---|---|
| Quadrant | BADHDUFLAG | Total packets | Discarded packets |
| A | 0 | 11461 | 3 |
| B | 0 | 13370 | 2 |
| C | 0 | 15386 | 2 |
| D | 0 | 14768 | 2 |
| Mode M9 | |||
|---|---|---|---|
| Quadrant | BADHDUFLAG | Total packets | Discarded packets |
| A | 0 | 32 | 0 |
| B | 0 | 32 | 0 |
| C | 0 | 32 | 0 |
| D | 0 | 32 | 0 |
| Mode SS | |||
|---|---|---|---|
| Quadrant | BADHDUFLAG | Total packets | Discarded packets |
| A | 0 | 120 | 0 |
| B | 0 | 120 | 0 |
| C | 0 | 120 | 0 |
| D | 0 | 120 | 0 |
| Quadrant | Total seconds | Saturated seconds | Saturation percentage |
|---|---|---|---|
| A | 5663 | 8 | 0.141268% |
| B | 5663 | 96 | 1.695215% |
| C | 5663 | 197 | 3.478722% |
| D | 5663 | 68 | 1.200777% |
Noise dominated data is calculated using 1-second bins in cleaned event files. If a bin has >2000 counts, and if more than 50% of those come from <1% of pixels, then it is considered to be noise-dominated and hence unusable.
| Quadrant | # 1 sec bins | Bins with >0 counts | Bins with >2000 counts | High rate bins dominated by noise | Noise dominated (total time) | Noise dominated (detector-on time) | Marked lightcurve |
|---|---|---|---|---|---|---|---|
| A | 8948 | 5665 | 0 | 0 | 0.00% | 0.00% | 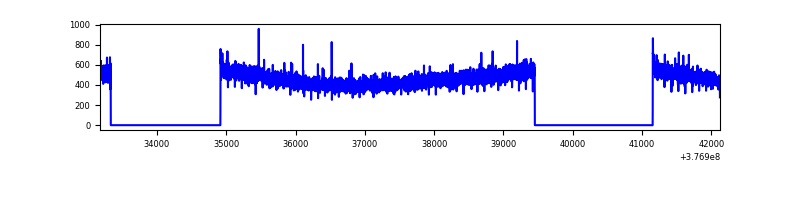 |
| B | 8948 | 5665 | 74 | 74 | 0.83% | 1.31% | 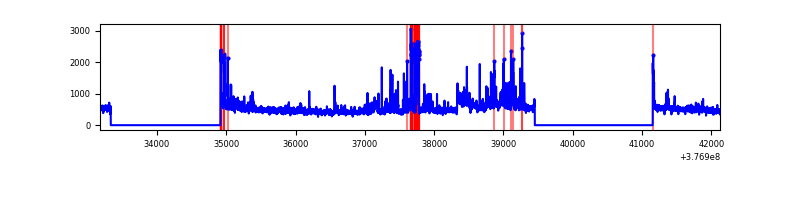 |
| C | 8948 | 5665 | 183 | 183 | 2.05% | 3.23% | 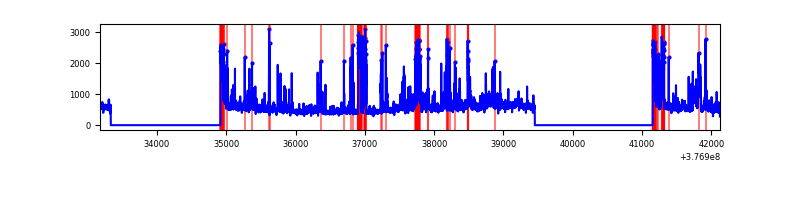 |
| D | 8948 | 5665 | 56 | 56 | 0.63% | 0.99% | 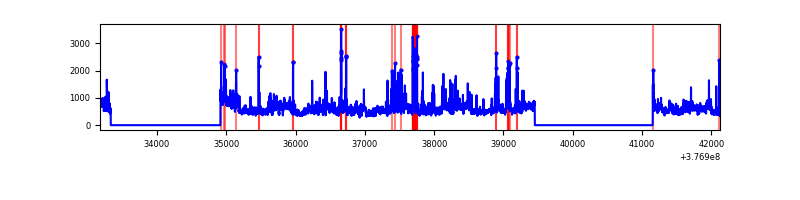 |
Top three noisy pixels from each quadrant. If the there are fewer than three noisy pixels in the level2.evt file, extra rows are filled as -1
| Pixel properties | Quadrant properties | ||||||
|---|---|---|---|---|---|---|---|
| Quadrant | DetID | PixID | Counts | Sigma | Mean | Median | Sigma |
| A | 13 | 254 | 9475 | 65.69 | 674 | 661 | 134.2 |
| A | 3 | 137 | 6726 | 45.2 | 674 | 661 | 134.2 |
| A | 10 | 83 | 6287 | 41.93 | 674 | 661 | 134.2 |
| B | 0 | 229 | 248637 | 1924.04 | 667 | 650 | 128.9 |
| B | 4 | 170 | 244326 | 1890.6 | 667 | 650 | 128.9 |
| B | 4 | 251 | 46077 | 352.45 | 667 | 650 | 128.9 |
| C | 1 | 23 | 305454 | 2035.79 | 640 | 645 | 149.7 |
| C | 14 | 254 | 297302 | 1981.35 | 640 | 645 | 149.7 |
| C | 3 | 233 | 244066 | 1625.79 | 640 | 645 | 149.7 |
| D | 8 | 195 | 674296 | 4241.98 | 645 | 628 | 158.8 |
| D | 2 | 250 | 146711 | 919.86 | 645 | 628 | 158.8 |
| D | 13 | 249 | 108260 | 677.74 | 645 | 628 | 158.8 |
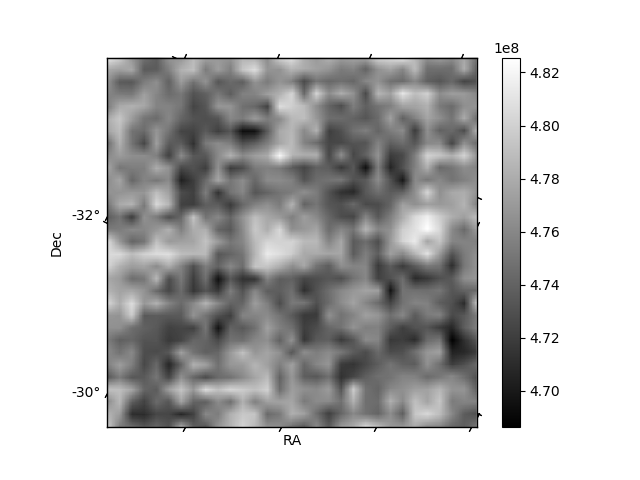
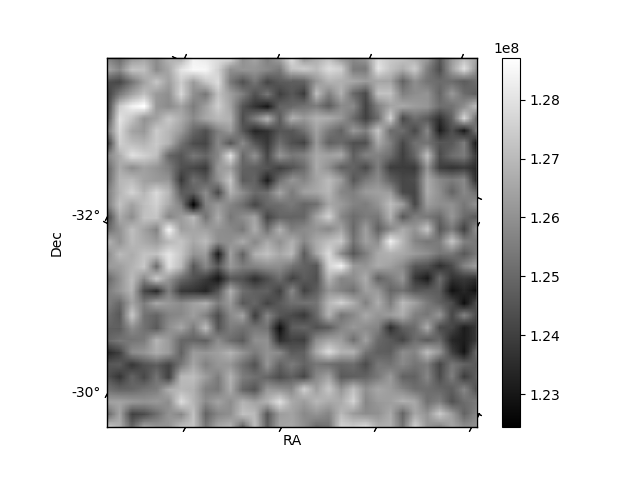
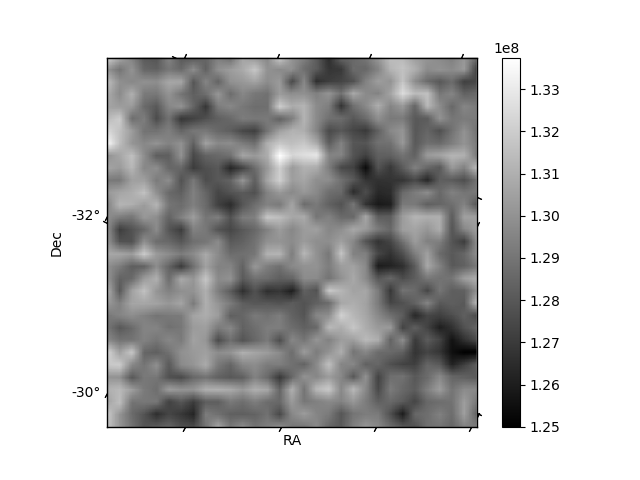
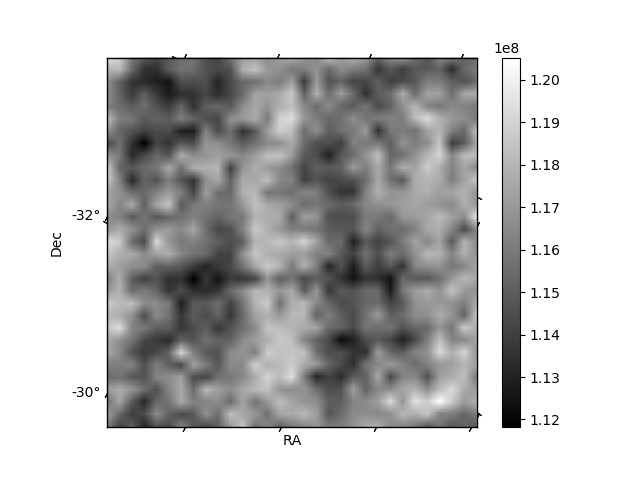
Histogram calculated using DETX and DETY for each event in the final _common_clean file
| Quadrant A | 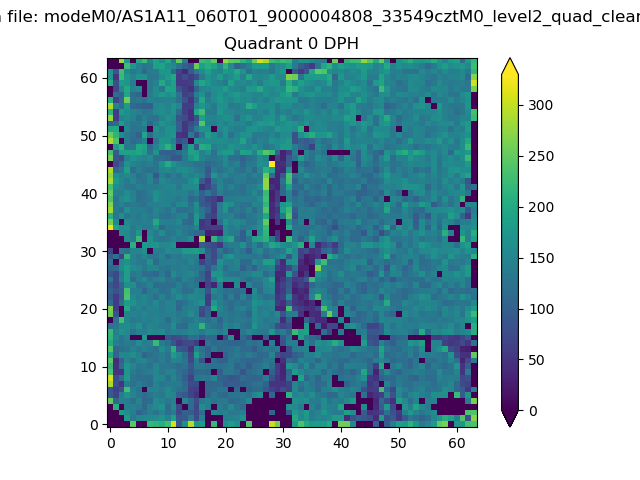 |
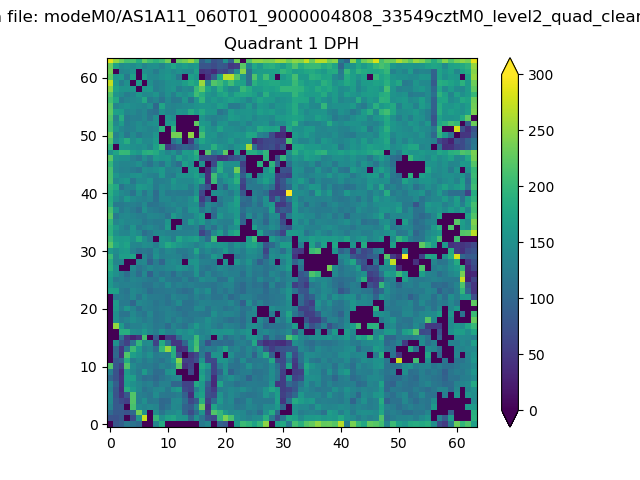 |
Quadrant B |
|---|---|---|---|
| Quadrant D | 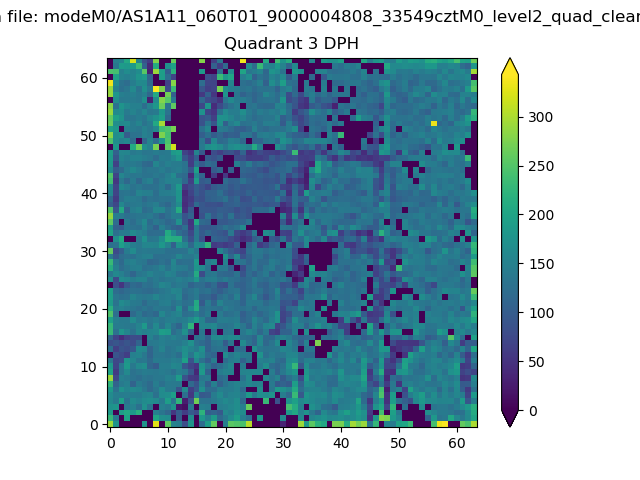 |
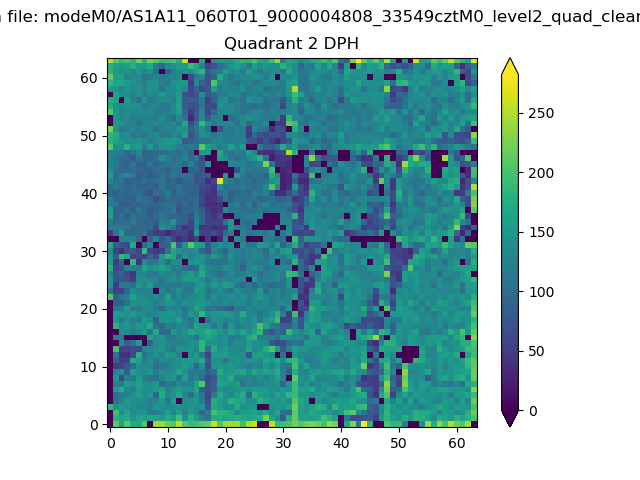 |
Quadrant C |
| Plot type | Count rate plots | Images |
|---|---|---|
| Comparison with Poisson distribution Blue bars denote a histogram of data divided into 1 sec bins. Red curve is a Poisson curve with rate = median count rate of data. |
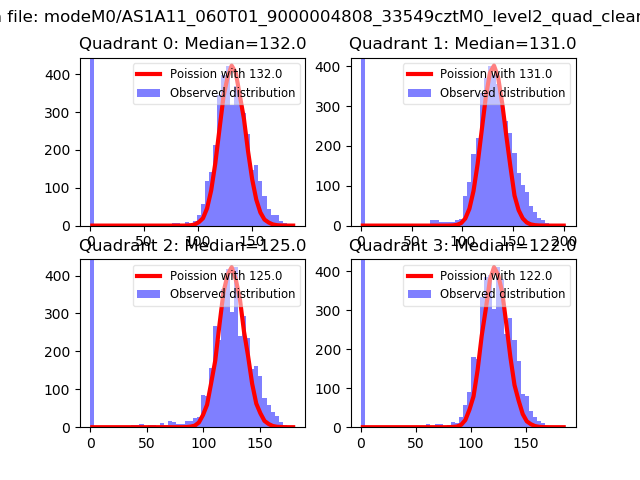 |
 |
| Quadrant-wise count rates Data is divided into 100 sec bins |
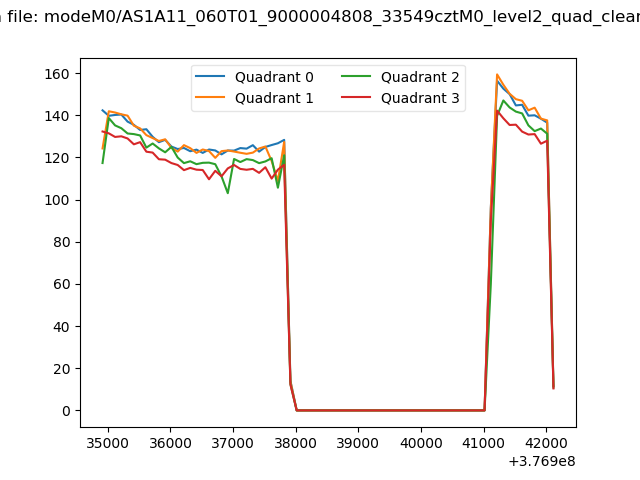 |
|
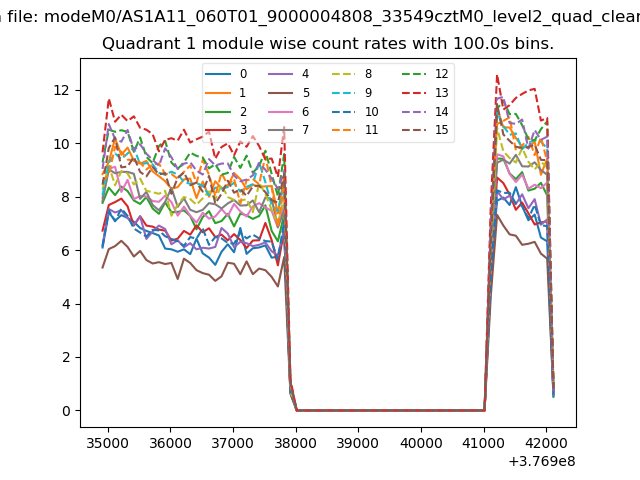
| Module-wise count rates for Quadrant A Data is divided into 100 sec bins |
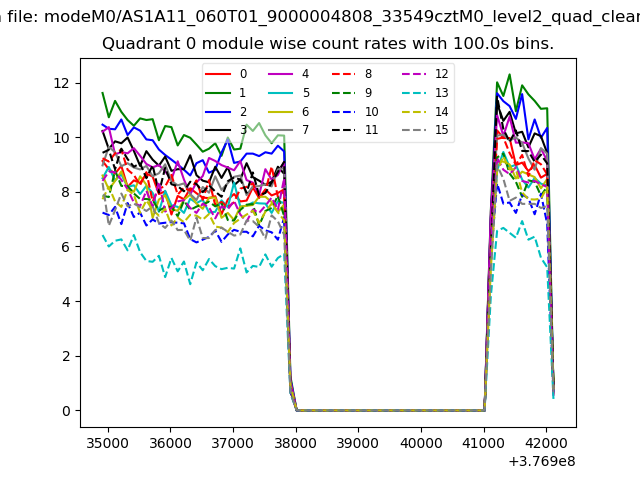 |
 |
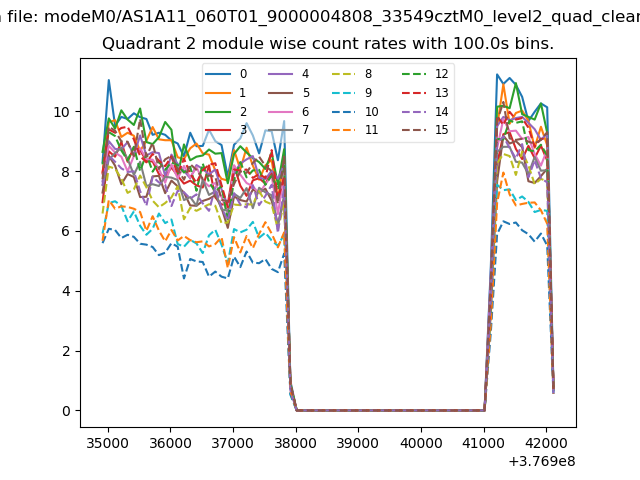
| Module-wise count rates for Quadrant B Data is divided into 100 sec bins |
 |
 |
| Module-wise count rates for Quadrant C Data is divided into 100 sec bins |
 |
 |
| Module-wise count rates for Quadrant D Data is divided into 100 sec bins |
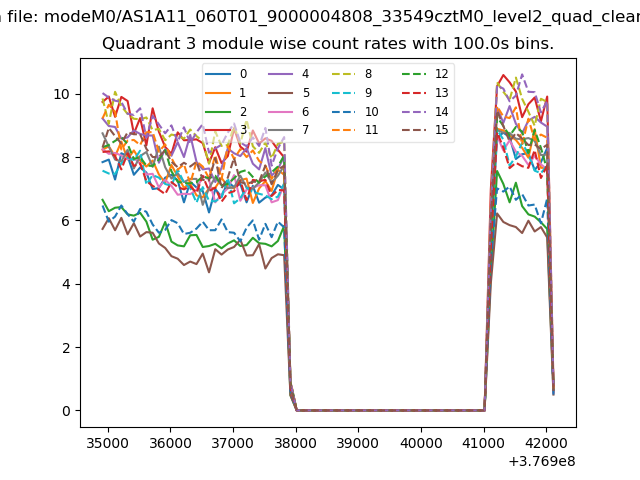 |
 |
| Parameter | Plot |
|---|---|
| CZT HV Monitor | 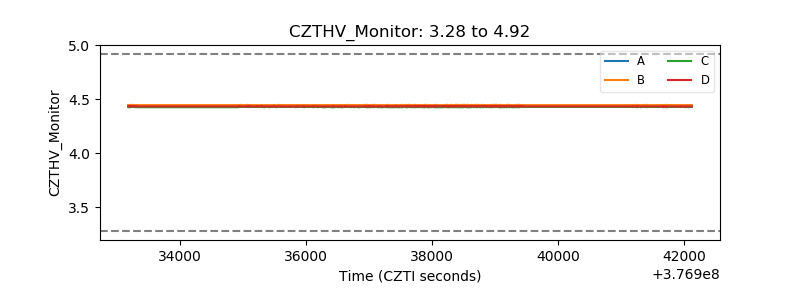 |
| D_VDD | 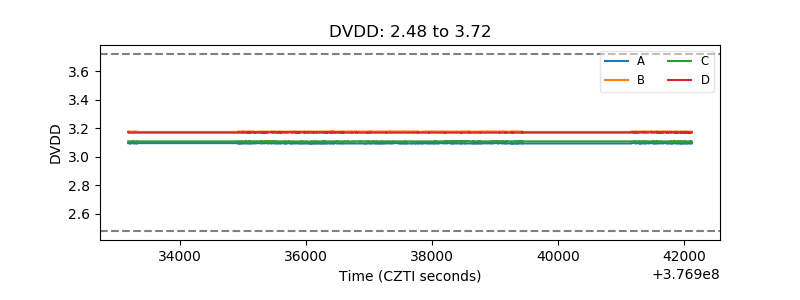 |
| Temperature 1 | 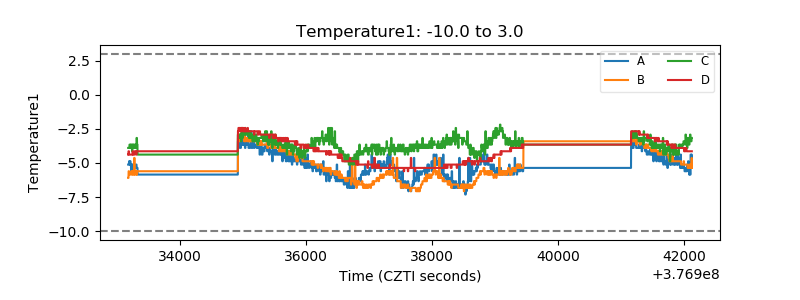 |
| Veto HV Monitor |  |
| Veto LLD | 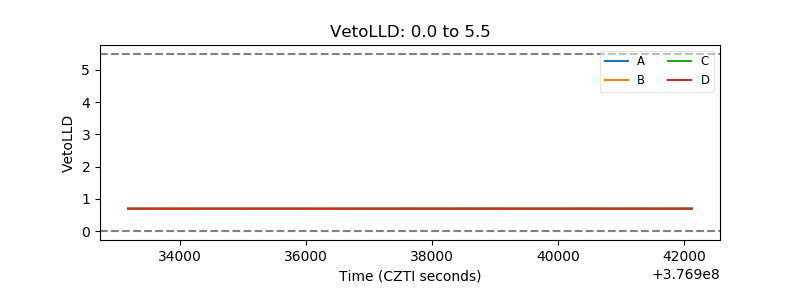 |
| Alpha Counter | 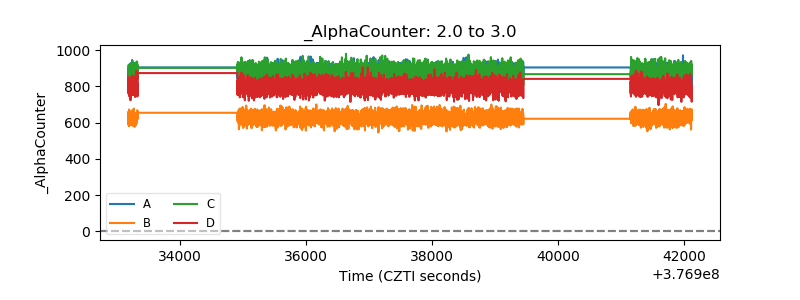 |
| _CPM_Rate | 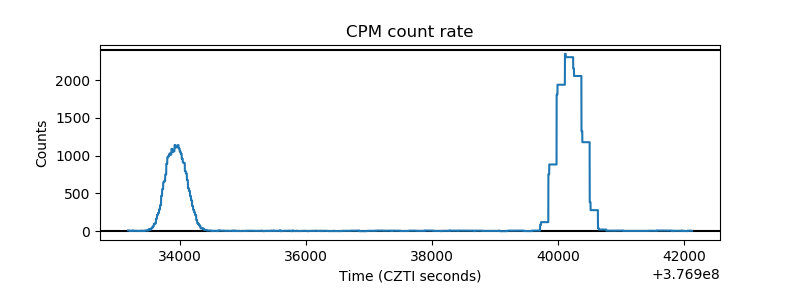 |
| CZT Counter | 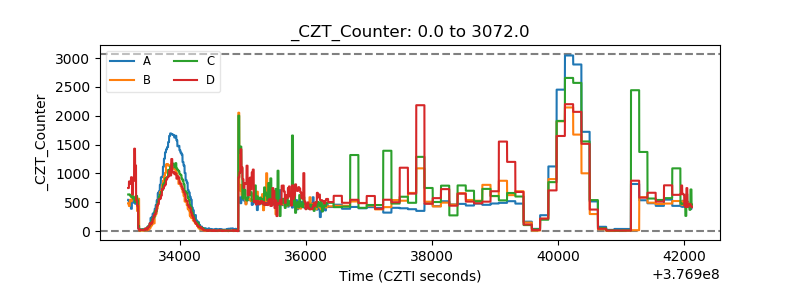 |
| +2.5 Volts monitor | 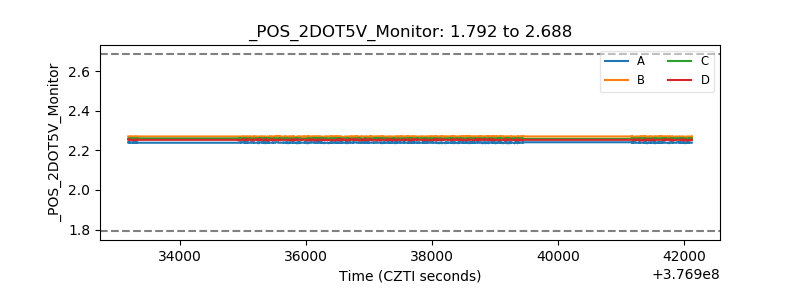 |
| +5 Volts monitor |  |
| _ROLL_ROT | 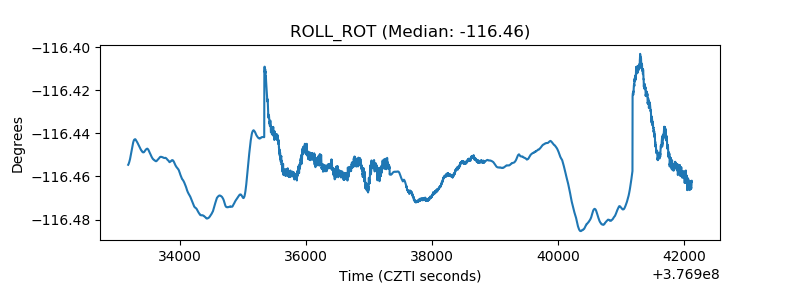 |
| _Roll_DEC | 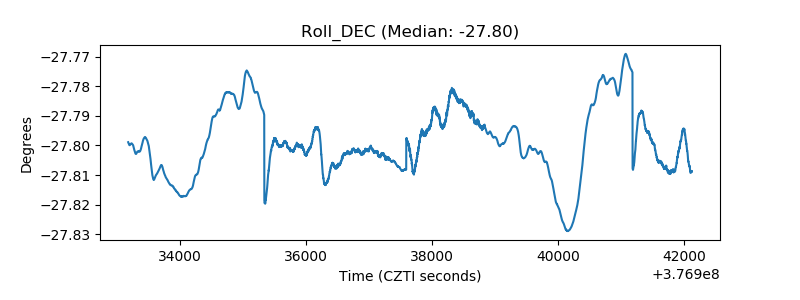 |
| _Roll_RA | 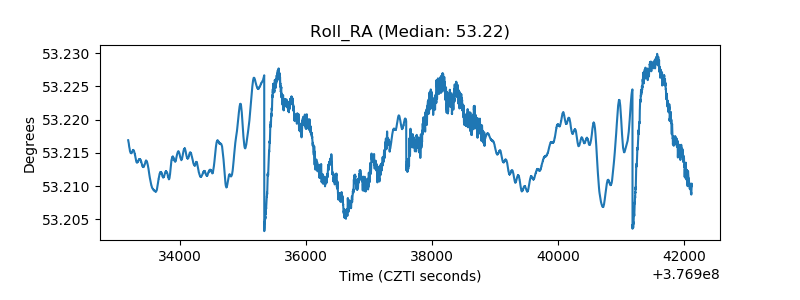 |
| Veto Counter | 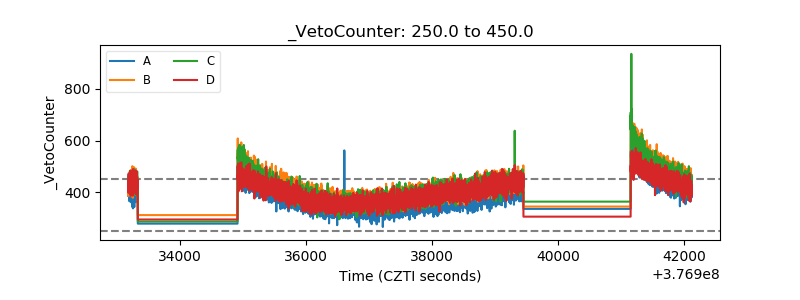 |