| Param | Original file | Final file |
|---|---|---|
| Filename | modeM0/AS1A11_060T01_9000004808_33552cztM0_level2.evt | modeM0/AS1A11_060T01_9000004808_33552cztM0_level2_quad_clean.evt |
| Size (bytes) | 443,044,800 | 69,010,560 |
| Size | 422.5 MB | 65.8 MB |
| Events in quadrant A | 3,062,062 | 441,683 |
| Events in quadrant B | 2,743,836 | 459,313 |
| Events in quadrant C | 3,795,899 | 416,952 |
| Events in quadrant D | 3,466,571 | 410,884 |
| Mode M0 | |||
|---|---|---|---|
| Quadrant | BADHDUFLAG | Total packets | Discarded packets |
| A | 0 | 12293 | 3 |
| B | 0 | 11126 | 2 |
| C | 0 | 14639 | 2 |
| D | 0 | 13950 | 2 |
| Mode M9 | |||
|---|---|---|---|
| Quadrant | BADHDUFLAG | Total packets | Discarded packets |
| A | 0 | 28 | 0 |
| B | 0 | 28 | 0 |
| C | 0 | 28 | 0 |
| D | 0 | 29 | 0 |
| Mode SS | |||
|---|---|---|---|
| Quadrant | BADHDUFLAG | Total packets | Discarded packets |
| A | 0 | 106 | 0 |
| B | 0 | 106 | 0 |
| C | 0 | 106 | 0 |
| D | 0 | 106 | 0 |
| Quadrant | Total seconds | Saturated seconds | Saturation percentage |
|---|---|---|---|
| A | 5144 | 57 | 1.108087% |
| B | 5144 | 31 | 0.602644% |
| C | 5144 | 255 | 4.957232% |
| D | 5144 | 51 | 0.991446% |
Noise dominated data is calculated using 1-second bins in cleaned event files. If a bin has >2000 counts, and if more than 50% of those come from <1% of pixels, then it is considered to be noise-dominated and hence unusable.
| Quadrant | # 1 sec bins | Bins with >0 counts | Bins with >2000 counts | High rate bins dominated by noise | Noise dominated (total time) | Noise dominated (detector-on time) | Marked lightcurve |
|---|---|---|---|---|---|---|---|
| A | 7088 | 5145 | 56 | 56 | 0.79% | 1.09% | 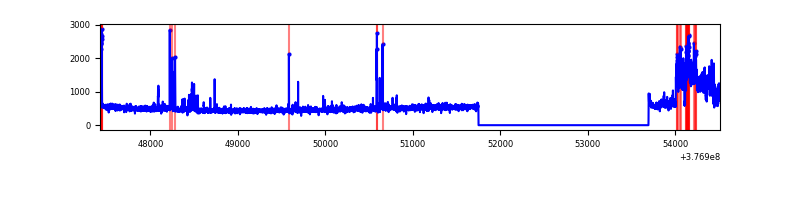 |
| B | 7088 | 5145 | 17 | 17 | 0.24% | 0.33% | 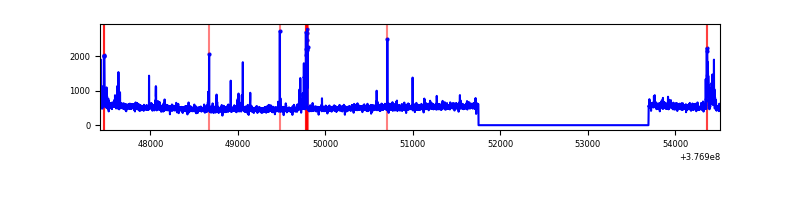 |
| C | 7088 | 5145 | 259 | 259 | 3.65% | 5.03% | 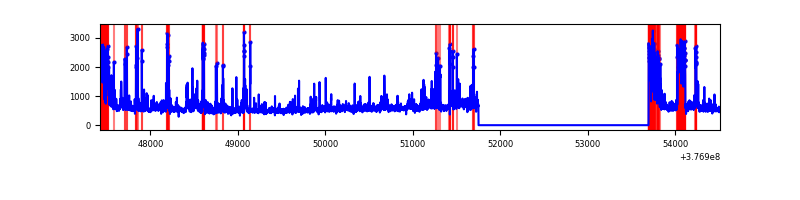 |
| D | 7088 | 5145 | 37 | 37 | 0.52% | 0.72% |  |
Top three noisy pixels from each quadrant. If the there are fewer than three noisy pixels in the level2.evt file, extra rows are filled as -1
| Pixel properties | Quadrant properties | ||||||
|---|---|---|---|---|---|---|---|
| Quadrant | DetID | PixID | Counts | Sigma | Mean | Median | Sigma |
| A | 15 | 169 | 605826 | 4846.2 | 634 | 624 | 124.9 |
| A | 13 | 254 | 8582 | 63.72 | 634 | 624 | 124.9 |
| A | 3 | 137 | 5889 | 42.16 | 634 | 624 | 124.9 |
| B | 5 | 172 | 87021 | 705.33 | 644 | 628 | 122.5 |
| B | 4 | 251 | 43423 | 349.39 | 644 | 628 | 122.5 |
| B | 0 | 190 | 30685 | 245.39 | 644 | 628 | 122.5 |
| C | 0 | 10 | 377353 | 2676.58 | 611 | 615 | 140.8 |
| C | 3 | 233 | 340838 | 2417.16 | 611 | 615 | 140.8 |
| C | 14 | 254 | 233400 | 1653.85 | 611 | 615 | 140.8 |
| D | 8 | 195 | 754040 | 5075.74 | 615 | 600 | 148.4 |
| D | 2 | 250 | 141854 | 951.59 | 615 | 600 | 148.4 |
| D | 13 | 249 | 75613 | 505.34 | 615 | 600 | 148.4 |
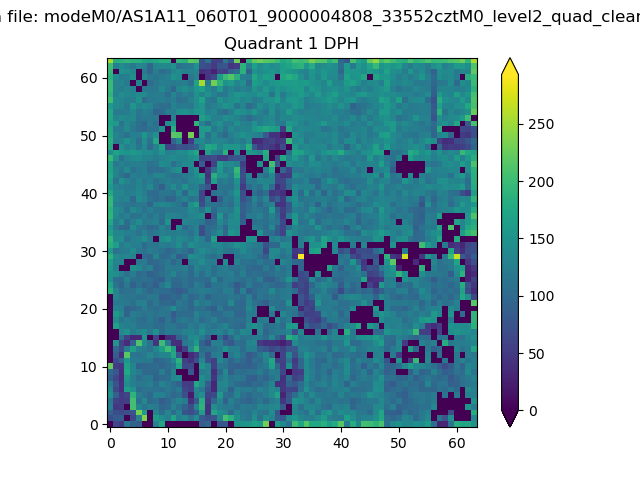
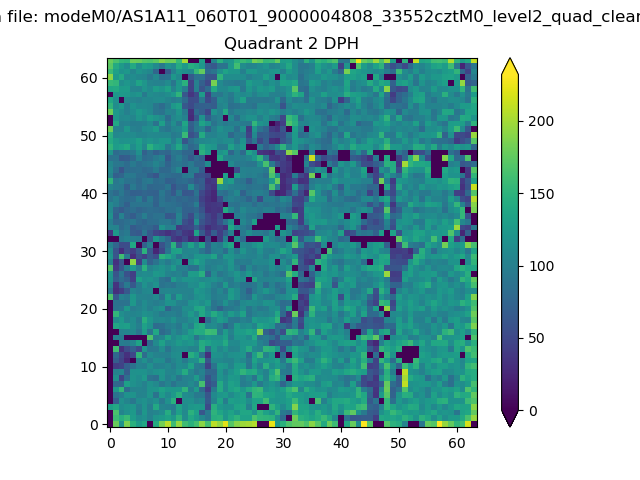
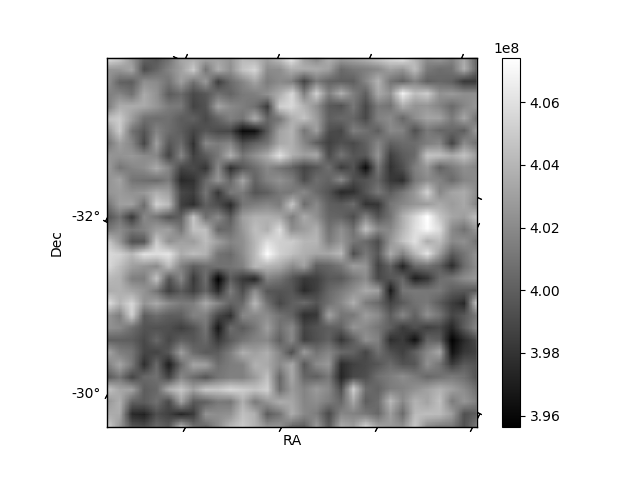
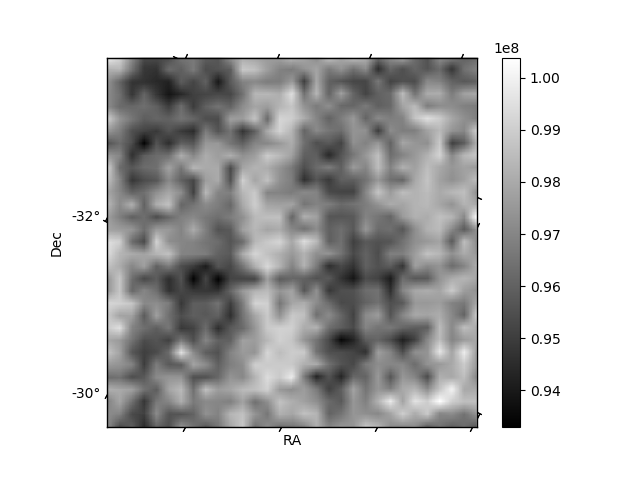
Histogram calculated using DETX and DETY for each event in the final _common_clean file
| Quadrant A | 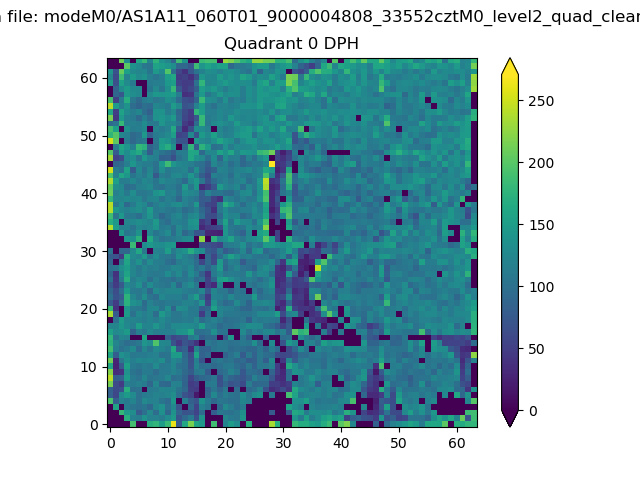 |
 |
Quadrant B |
|---|---|---|---|
| Quadrant D | 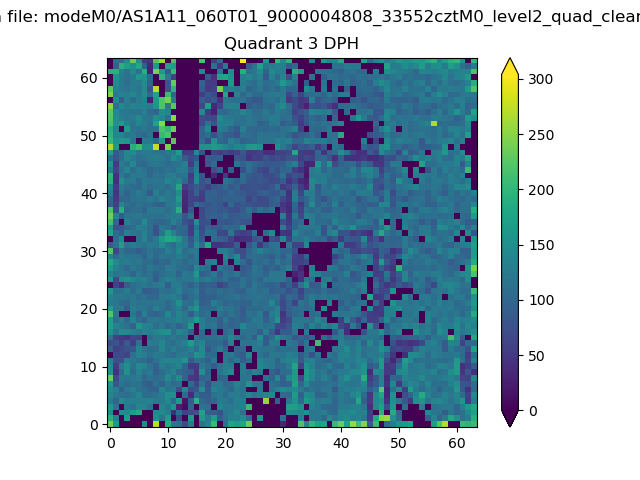 |
 |
Quadrant C |
| Plot type | Count rate plots | Images |
|---|---|---|
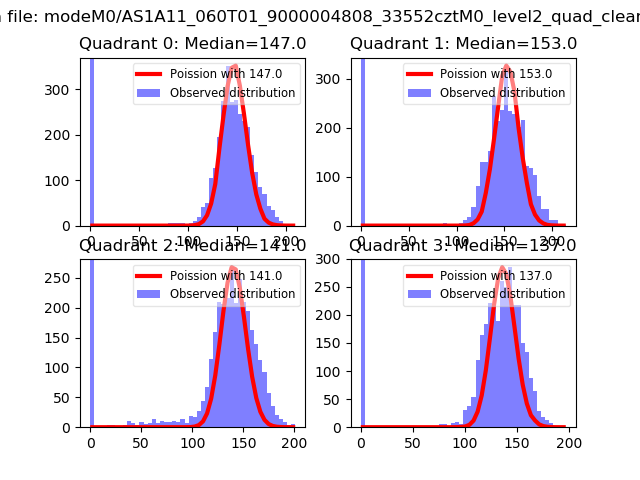
| Comparison with Poisson distribution Blue bars denote a histogram of data divided into 1 sec bins. Red curve is a Poisson curve with rate = median count rate of data. |
 |
 |
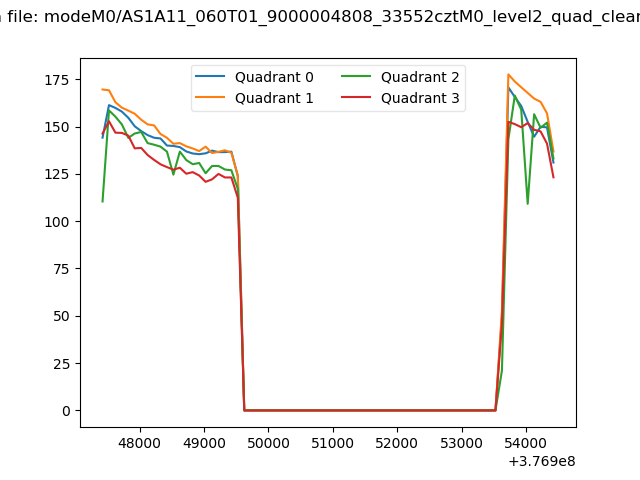
| Quadrant-wise count rates Data is divided into 100 sec bins |
 |
|
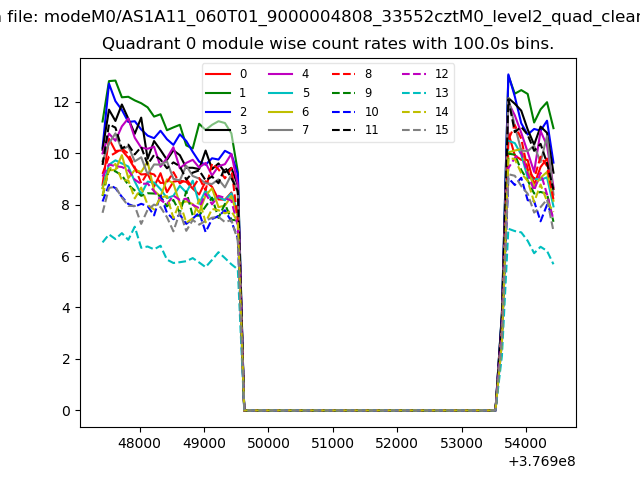
| Module-wise count rates for Quadrant A Data is divided into 100 sec bins |
 |
 |
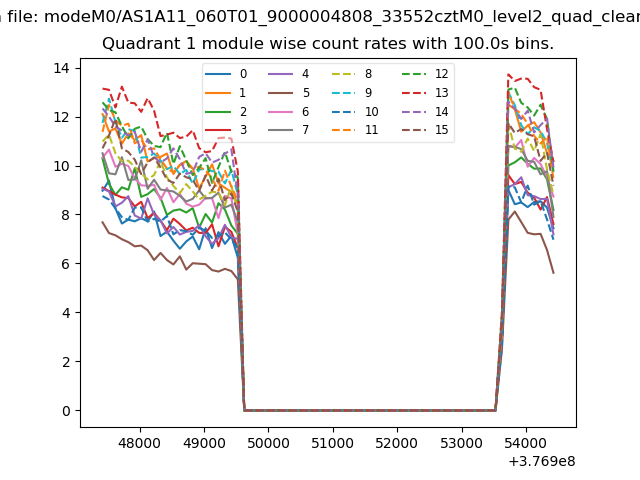
| Module-wise count rates for Quadrant B Data is divided into 100 sec bins |
 |
 |
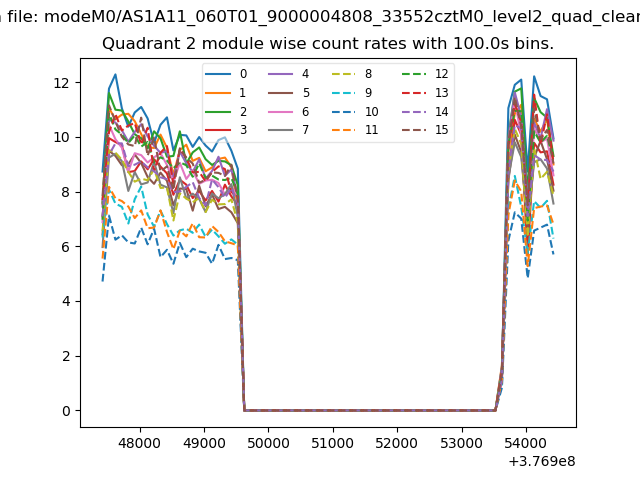
| Module-wise count rates for Quadrant C Data is divided into 100 sec bins |
 |
 |
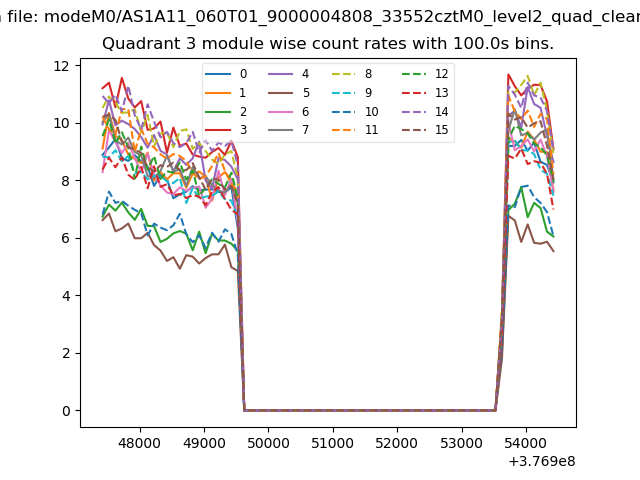
| Module-wise count rates for Quadrant D Data is divided into 100 sec bins |
 |
 |
| Parameter | Plot |
|---|---|
| CZT HV Monitor | 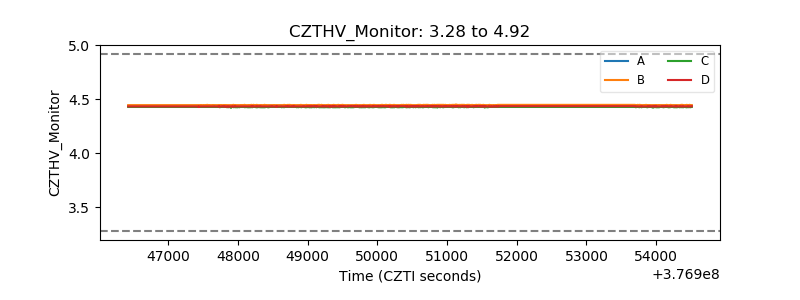 |
| D_VDD |  |
| Temperature 1 | 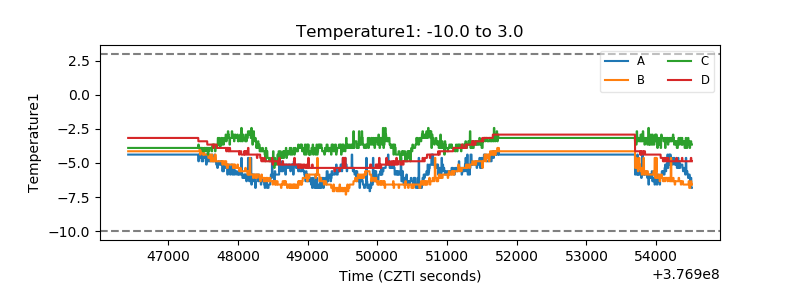 |
| Veto HV Monitor | 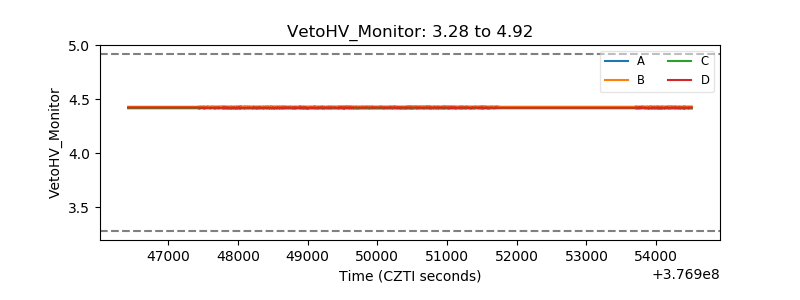 |
| Veto LLD | 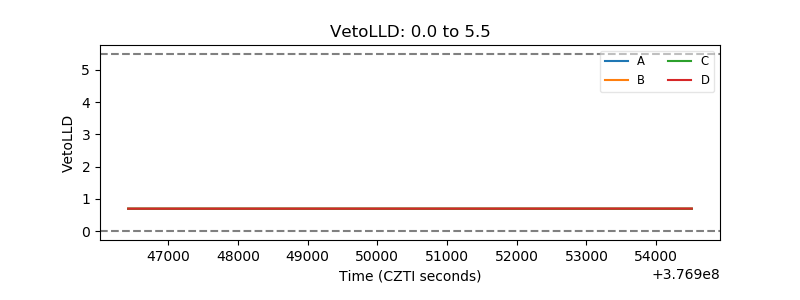 |
| Alpha Counter | 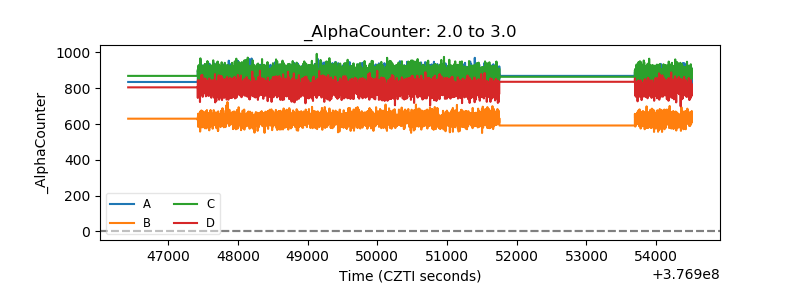 |
| _CPM_Rate | 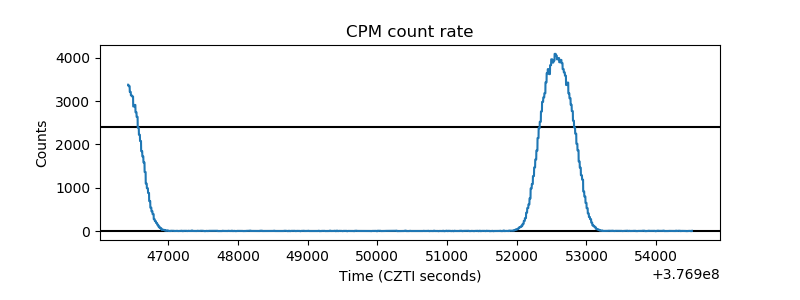 |
| CZT Counter | 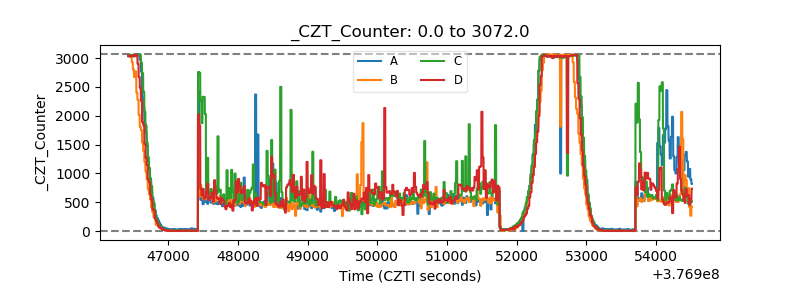 |
| +2.5 Volts monitor |  |
| +5 Volts monitor |  |
| _ROLL_ROT | 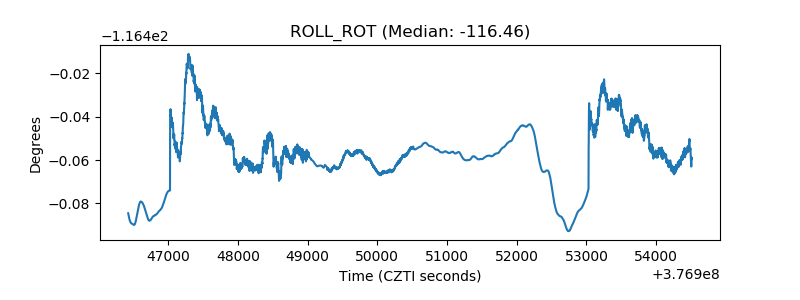 |
| _Roll_DEC | 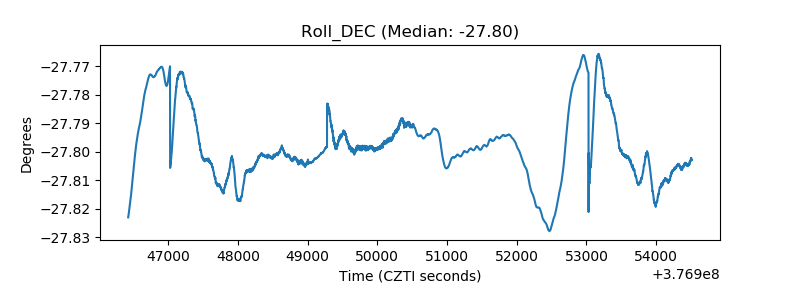 |
| _Roll_RA | 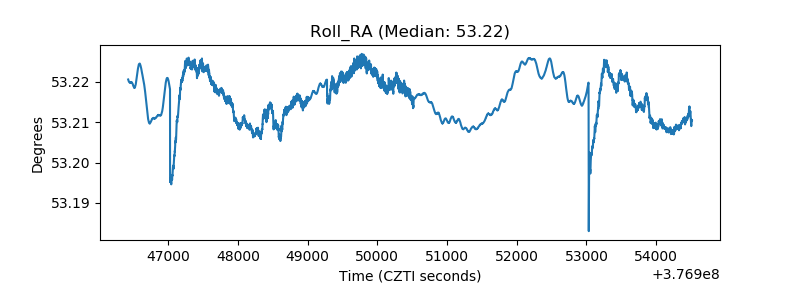 |
| Veto Counter | 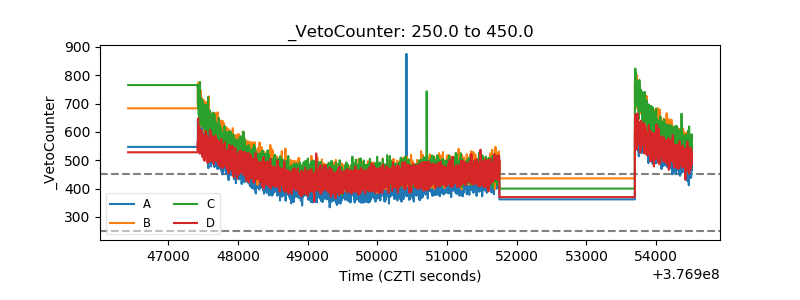 |