| Param | Original file | Final file |
|---|---|---|
| Filename | modeM0/AS1A11_060T01_9000004808_33553cztM0_level2.evt | modeM0/AS1A11_060T01_9000004808_33553cztM0_level2_quad_clean.evt |
| Size (bytes) | 592,680,960 | 69,963,840 |
| Size | 565.2 MB | 66.7 MB |
| Events in quadrant A | 5,851,466 | 444,899 |
| Events in quadrant B | 3,528,685 | 459,064 |
| Events in quadrant C | 4,012,535 | 438,291 |
| Events in quadrant D | 4,206,766 | 412,454 |
| Mode M0 | |||
|---|---|---|---|
| Quadrant | BADHDUFLAG | Total packets | Discarded packets |
| A | 0 | 20821 | 3 |
| B | 0 | 13586 | 2 |
| C | 0 | 15217 | 2 |
| D | 0 | 16056 | 2 |
| Mode M9 | |||
|---|---|---|---|
| Quadrant | BADHDUFLAG | Total packets | Discarded packets |
| A | 0 | 36 | 0 |
| B | 0 | 36 | 0 |
| C | 0 | 36 | 0 |
| D | 0 | 37 | 0 |
| Mode SS | |||
|---|---|---|---|
| Quadrant | BADHDUFLAG | Total packets | Discarded packets |
| A | 0 | 106 | 0 |
| B | 0 | 106 | 0 |
| C | 0 | 106 | 0 |
| D | 0 | 106 | 0 |
| Quadrant | Total seconds | Saturated seconds | Saturation percentage |
|---|---|---|---|
| A | 5186 | 372 | 7.173159% |
| B | 5186 | 216 | 4.165060% |
| C | 5186 | 299 | 5.765523% |
| D | 5186 | 289 | 5.572696% |
Noise dominated data is calculated using 1-second bins in cleaned event files. If a bin has >2000 counts, and if more than 50% of those come from <1% of pixels, then it is considered to be noise-dominated and hence unusable.
| Quadrant | # 1 sec bins | Bins with >0 counts | Bins with >2000 counts | High rate bins dominated by noise | Noise dominated (total time) | Noise dominated (detector-on time) | Marked lightcurve |
|---|---|---|---|---|---|---|---|
| A | 7249 | 5187 | 390 | 390 | 5.38% | 7.52% | 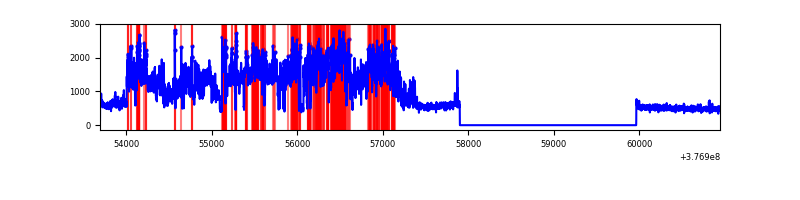 |
| B | 7249 | 5187 | 187 | 187 | 2.58% | 3.61% | 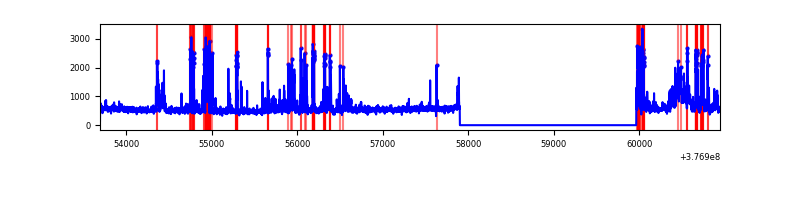 |
| C | 7249 | 5187 | 280 | 280 | 3.86% | 5.40% | 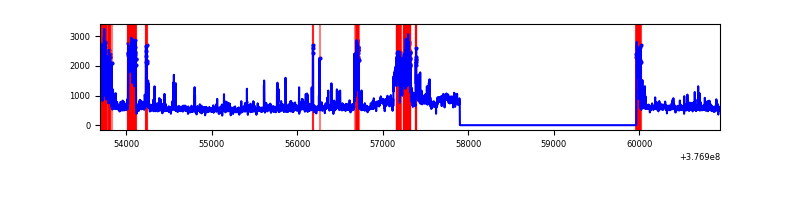 |
| D | 7249 | 5186 | 294 | 294 | 4.06% | 5.67% | 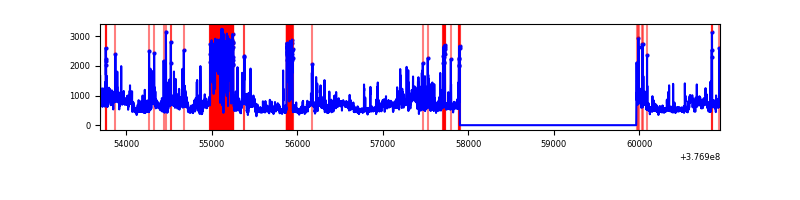 |
Top three noisy pixels from each quadrant. If the there are fewer than three noisy pixels in the level2.evt file, extra rows are filled as -1
| Pixel properties | Quadrant properties | ||||||
|---|---|---|---|---|---|---|---|
| Quadrant | DetID | PixID | Counts | Sigma | Mean | Median | Sigma |
| A | 15 | 169 | 3336435 | 26130.84 | 645 | 637 | 127.7 |
| A | 13 | 6 | 12749 | 94.88 | 645 | 637 | 127.7 |
| A | 13 | 254 | 7948 | 57.27 | 645 | 637 | 127.7 |
| B | 5 | 172 | 515074 | 4164.95 | 652 | 636 | 123.5 |
| B | 15 | 222 | 136760 | 1102.08 | 652 | 636 | 123.5 |
| B | 4 | 251 | 129653 | 1044.54 | 652 | 636 | 123.5 |
| C | 1 | 23 | 465550 | 3197.56 | 636 | 643 | 145.4 |
| C | 0 | 10 | 338314 | 2322.45 | 636 | 643 | 145.4 |
| C | 3 | 233 | 311702 | 2139.41 | 636 | 643 | 145.4 |
| D | 8 | 195 | 678798 | 4505.07 | 627 | 612 | 150.5 |
| D | 15 | 0 | 420281 | 2787.79 | 627 | 612 | 150.5 |
| D | 2 | 250 | 224064 | 1484.35 | 627 | 612 | 150.5 |
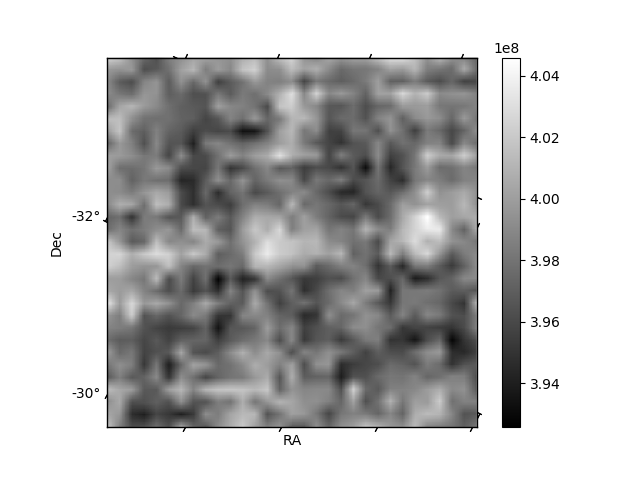
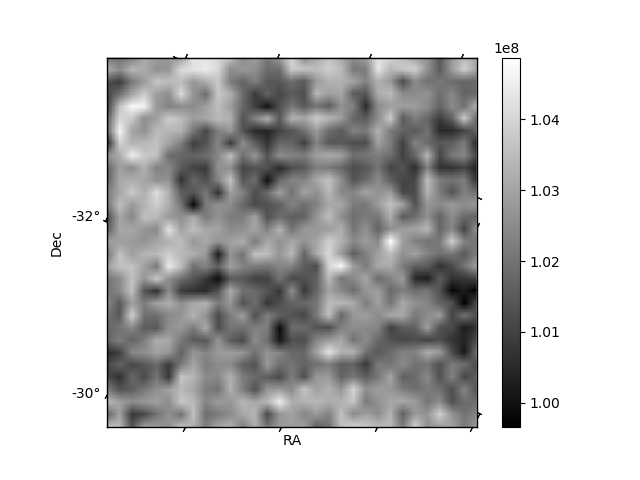
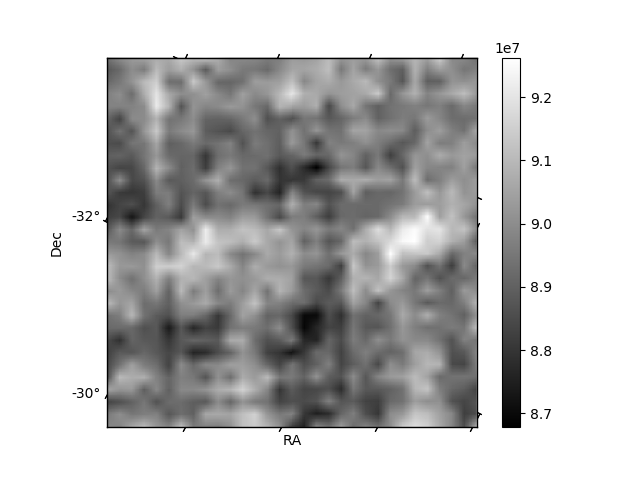
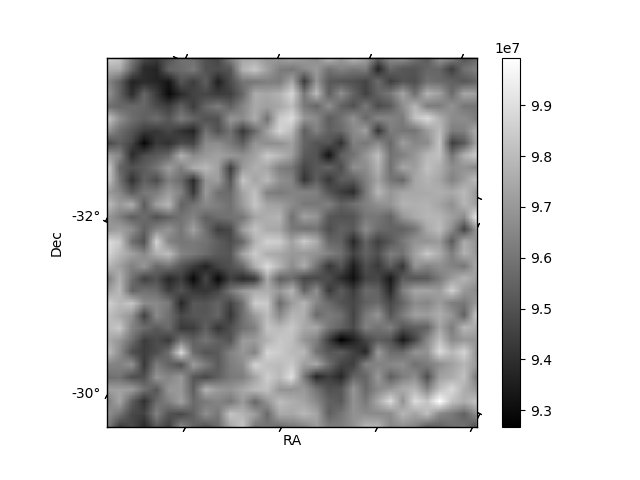
Histogram calculated using DETX and DETY for each event in the final _common_clean file
| Quadrant A | 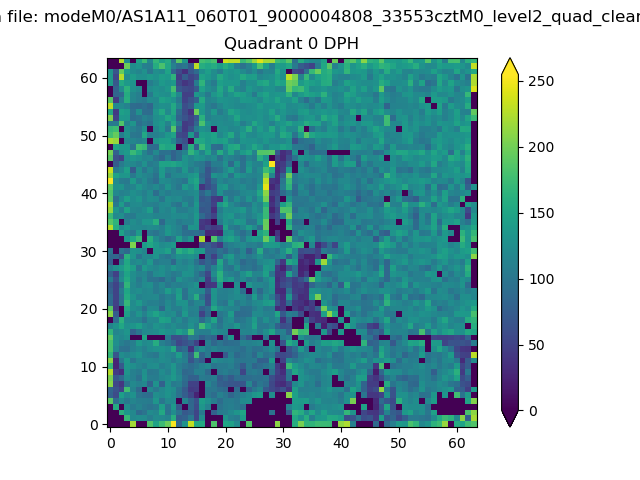 |
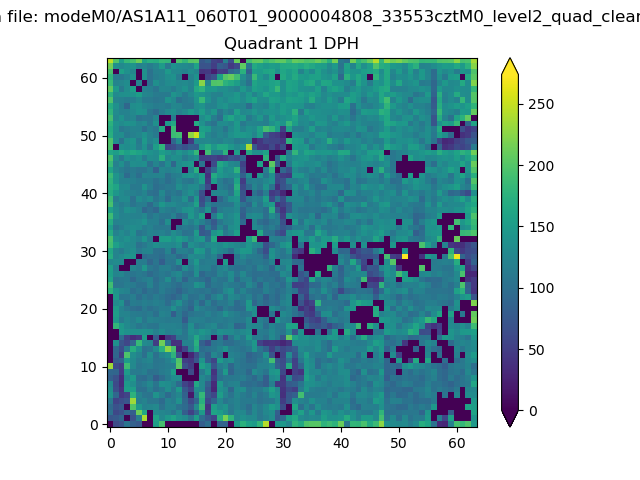 |
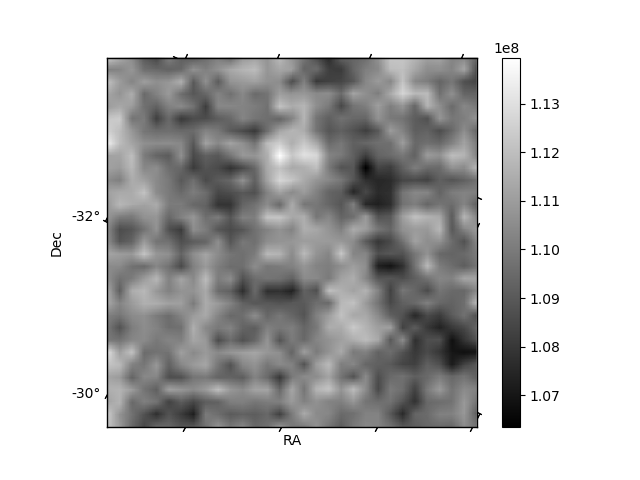
Quadrant B |
|---|---|---|---|
| Quadrant D | 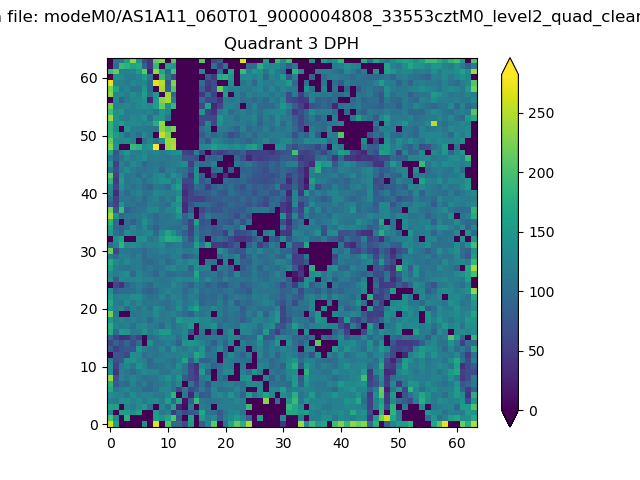 |
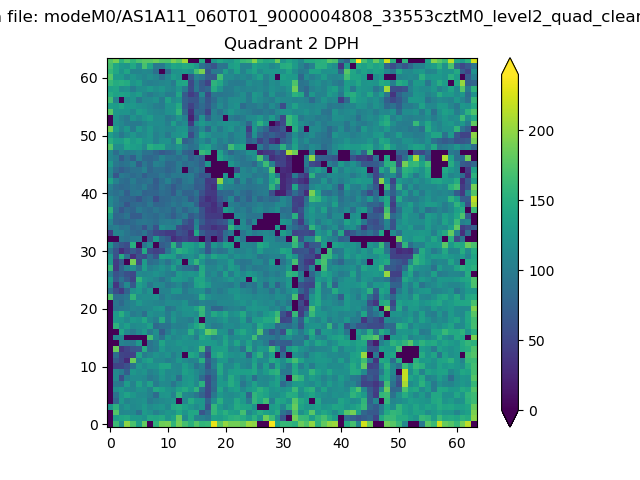 |
Quadrant C |
| Plot type | Count rate plots | Images |
|---|---|---|
| Comparison with Poisson distribution Blue bars denote a histogram of data divided into 1 sec bins. Red curve is a Poisson curve with rate = median count rate of data. |
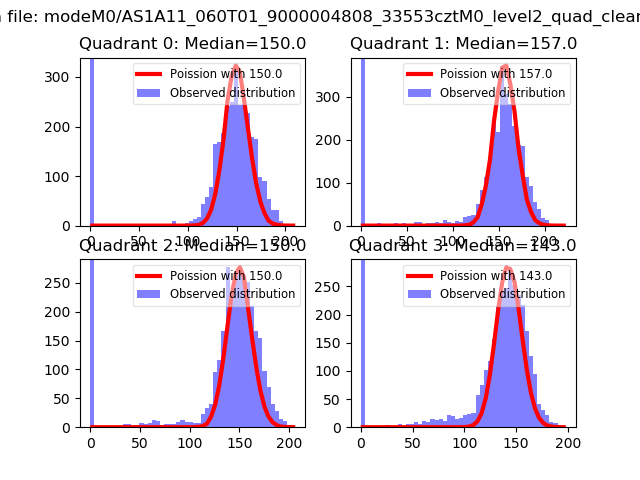 |
 |
| Quadrant-wise count rates Data is divided into 100 sec bins |
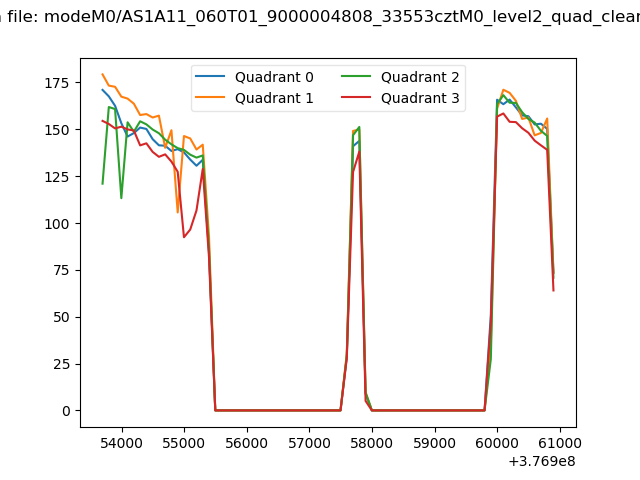 |
|
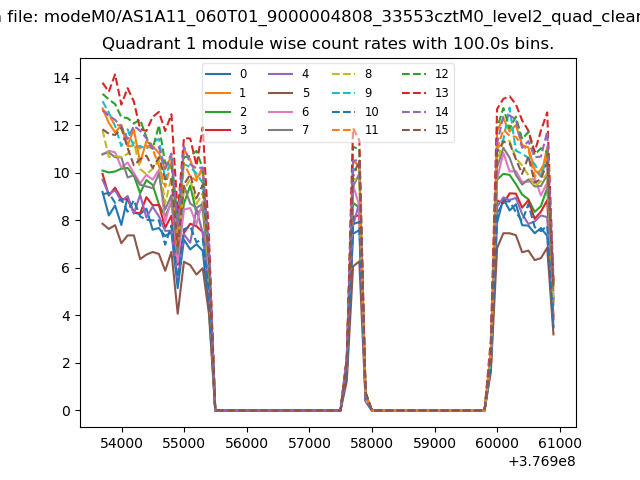
| Module-wise count rates for Quadrant A Data is divided into 100 sec bins |
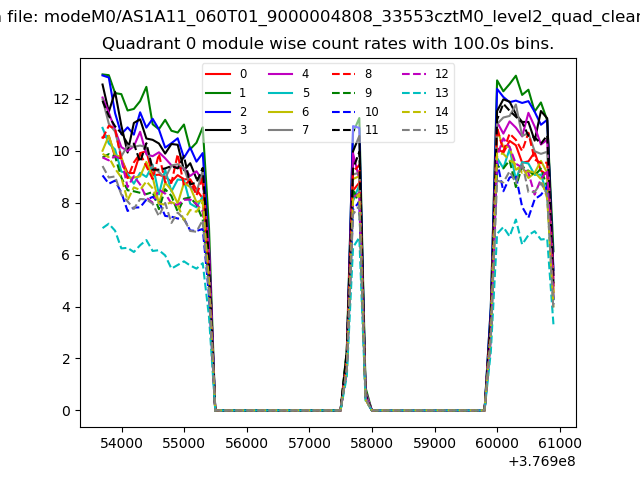 |
 |
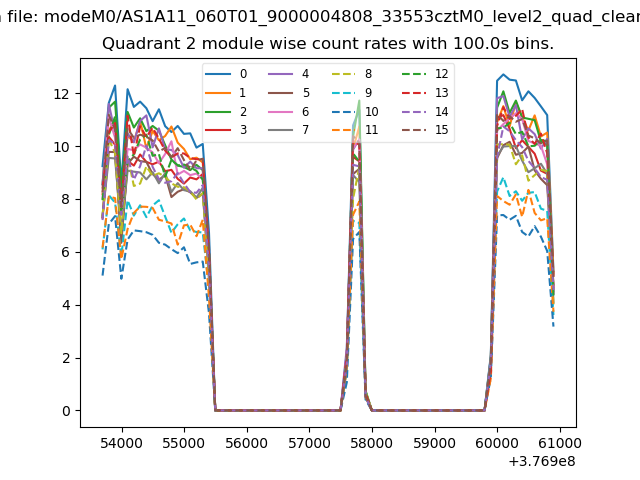
| Module-wise count rates for Quadrant B Data is divided into 100 sec bins |
 |
 |
| Module-wise count rates for Quadrant C Data is divided into 100 sec bins |
 |
 |
| Module-wise count rates for Quadrant D Data is divided into 100 sec bins |
 |
 |
| Parameter | Plot |
|---|---|
| CZT HV Monitor | 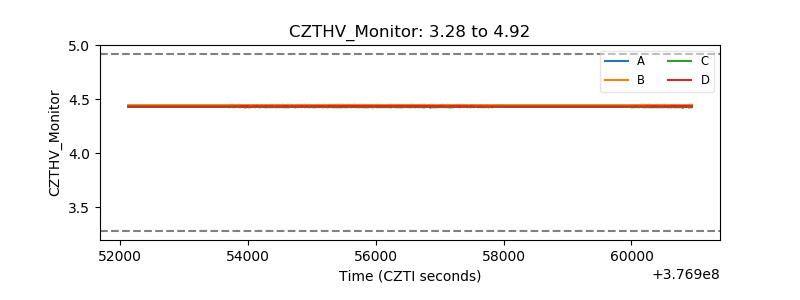 |
| D_VDD | 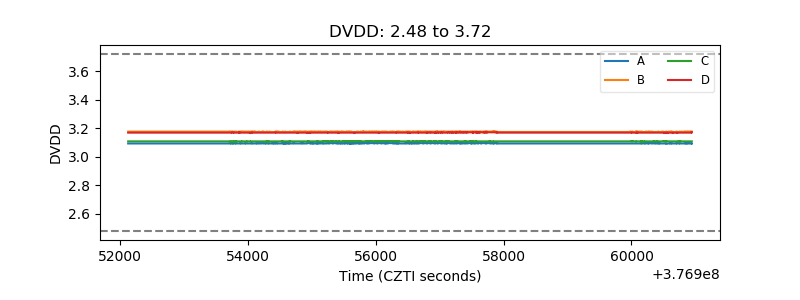 |
| Temperature 1 |  |
| Veto HV Monitor | 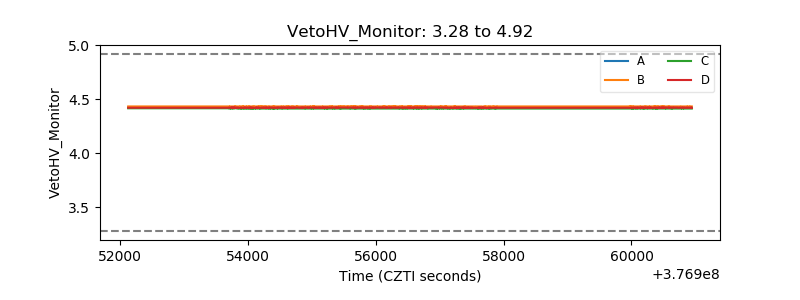 |
| Veto LLD | 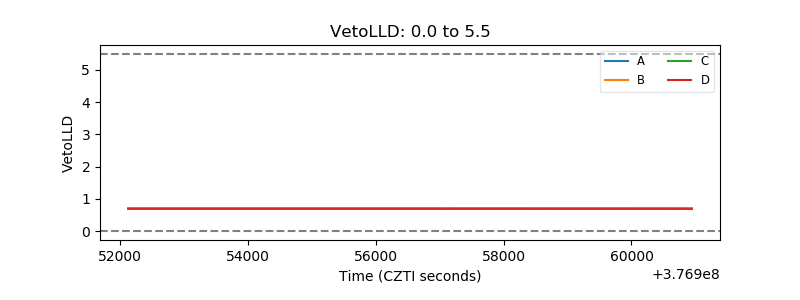 |
| Alpha Counter | 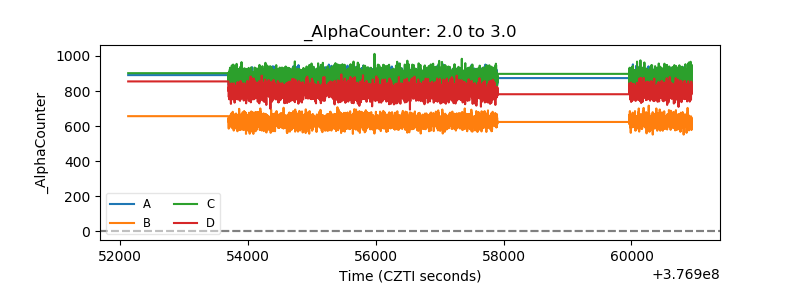 |
| _CPM_Rate | 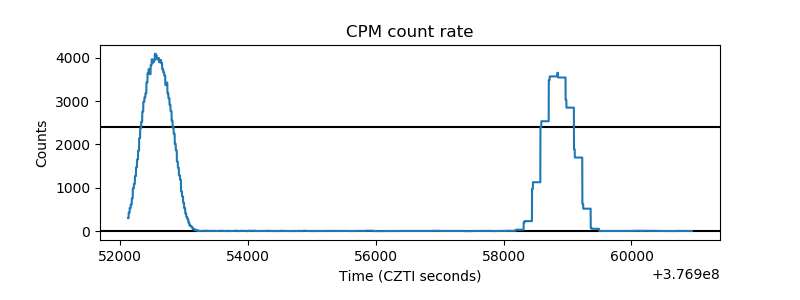 |
| CZT Counter | 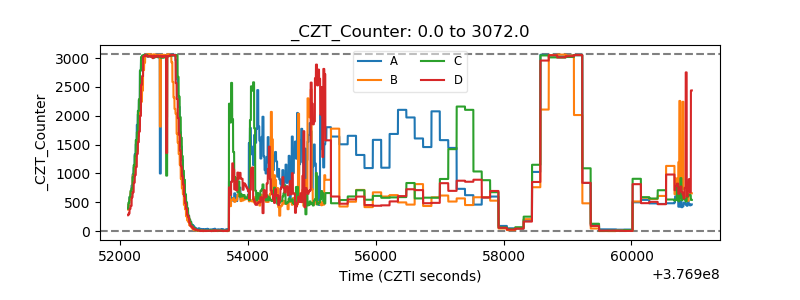 |
| +2.5 Volts monitor |  |
| +5 Volts monitor |  |
| _ROLL_ROT | 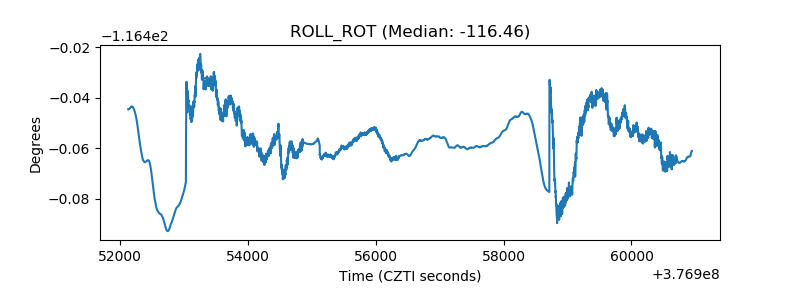 |
| _Roll_DEC | 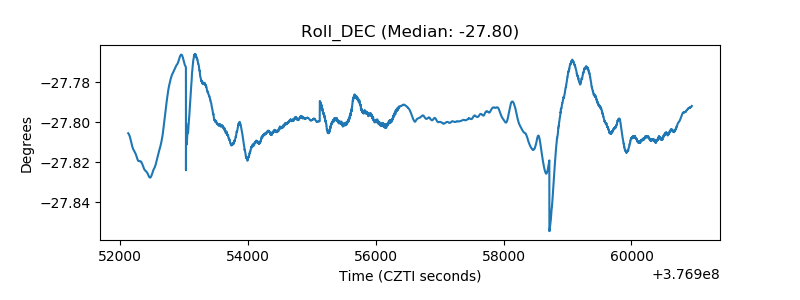 |
| _Roll_RA | 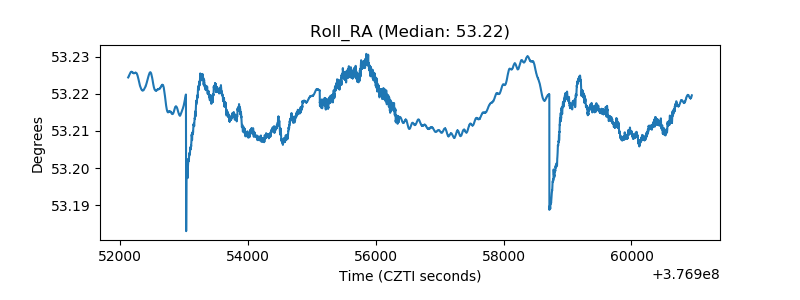 |
| Veto Counter |  |