| Param | Original file | Final file |
|---|---|---|
| Filename | modeM0/AS1A11_060T01_9000004808_33554cztM0_level2.evt | modeM0/AS1A11_060T01_9000004808_33554cztM0_level2_quad_clean.evt |
| Size (bytes) | 596,376,000 | 65,733,120 |
| Size | 568.7 MB | 62.7 MB |
| Events in quadrant A | 2,892,903 | 430,535 |
| Events in quadrant B | 4,618,123 | 402,700 |
| Events in quadrant C | 3,564,923 | 422,539 |
| Events in quadrant D | 6,634,435 | 370,645 |
| Mode M0 | |||
|---|---|---|---|
| Quadrant | BADHDUFLAG | Total packets | Discarded packets |
| A | 0 | 11742 | 3 |
| B | 0 | 17014 | 2 |
| C | 0 | 14054 | 2 |
| D | 0 | 23203 | 2 |
| Mode M9 | |||
|---|---|---|---|
| Quadrant | BADHDUFLAG | Total packets | Discarded packets |
| A | 0 | 38 | 0 |
| B | 0 | 38 | 0 |
| C | 0 | 38 | 0 |
| D | 0 | 39 | 0 |
| Mode SS | |||
|---|---|---|---|
| Quadrant | BADHDUFLAG | Total packets | Discarded packets |
| A | 0 | 104 | 0 |
| B | 0 | 104 | 0 |
| C | 0 | 104 | 0 |
| D | 0 | 104 | 0 |
| Quadrant | Total seconds | Saturated seconds | Saturation percentage |
|---|---|---|---|
| A | 5195 | 59 | 1.135707% |
| B | 5195 | 688 | 13.243503% |
| C | 5195 | 126 | 2.425409% |
| D | 5195 | 1345 | 25.890279% |
Noise dominated data is calculated using 1-second bins in cleaned event files. If a bin has >2000 counts, and if more than 50% of those come from <1% of pixels, then it is considered to be noise-dominated and hence unusable.
| Quadrant | # 1 sec bins | Bins with >0 counts | Bins with >2000 counts | High rate bins dominated by noise | Noise dominated (total time) | Noise dominated (detector-on time) | Marked lightcurve |
|---|---|---|---|---|---|---|---|
| A | 7318 | 5196 | 37 | 37 | 0.51% | 0.71% | 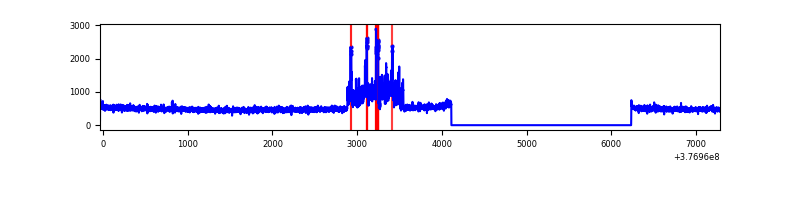 |
| B | 7318 | 5196 | 574 | 574 | 7.84% | 11.05% | 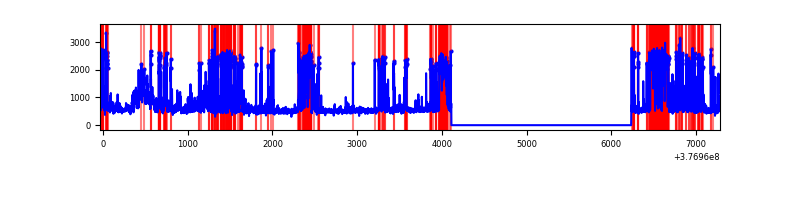 |
| C | 7318 | 5196 | 106 | 106 | 1.45% | 2.04% | 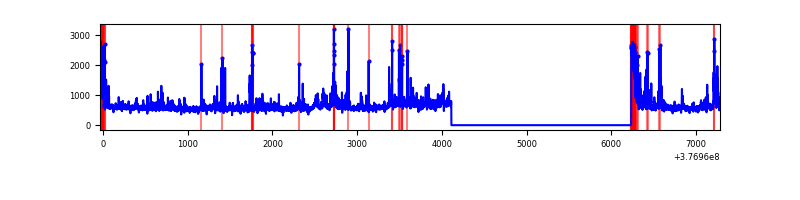 |
| D | 7318 | 5196 | 1308 | 1308 | 17.87% | 25.17% | 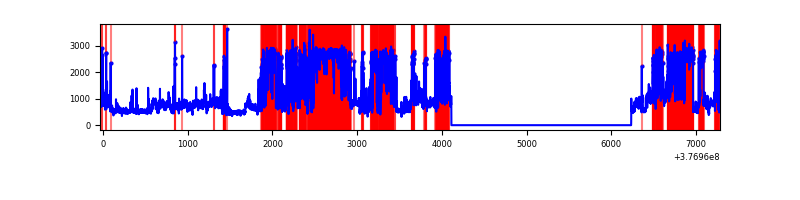 |
Top three noisy pixels from each quadrant. If the there are fewer than three noisy pixels in the level2.evt file, extra rows are filled as -1
| Pixel properties | Quadrant properties | ||||||
|---|---|---|---|---|---|---|---|
| Quadrant | DetID | PixID | Counts | Sigma | Mean | Median | Sigma |
| A | 15 | 169 | 379571 | 2906.36 | 650 | 638 | 130.4 |
| A | 13 | 254 | 7821 | 55.09 | 650 | 638 | 130.4 |
| A | 10 | 83 | 6251 | 43.05 | 650 | 638 | 130.4 |
| B | 5 | 172 | 1664504 | 14400.55 | 618 | 603 | 115.5 |
| B | 15 | 222 | 191732 | 1654.16 | 618 | 603 | 115.5 |
| B | 4 | 251 | 187321 | 1615.99 | 618 | 603 | 115.5 |
| C | 0 | 10 | 278307 | 1837.74 | 649 | 656 | 151.1 |
| C | 14 | 254 | 246027 | 1624.09 | 649 | 656 | 151.1 |
| C | 15 | 214 | 224350 | 1480.61 | 649 | 656 | 151.1 |
| D | 2 | 31 | 2985452 | 22324.23 | 554 | 541 | 133.7 |
| D | 8 | 195 | 870725 | 6508.13 | 554 | 541 | 133.7 |
| D | 13 | 249 | 490285 | 3662.81 | 554 | 541 | 133.7 |
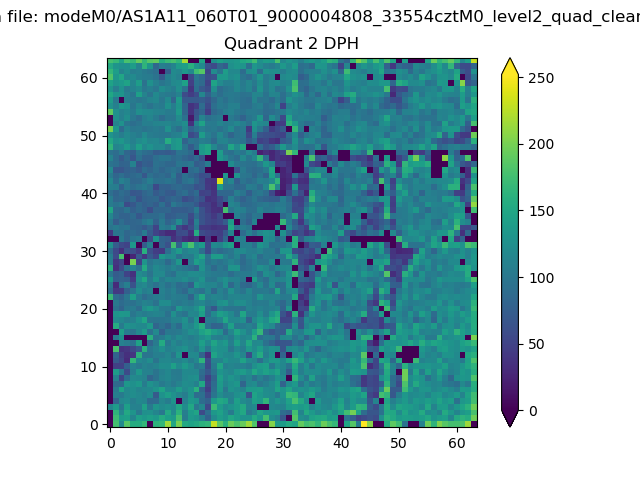
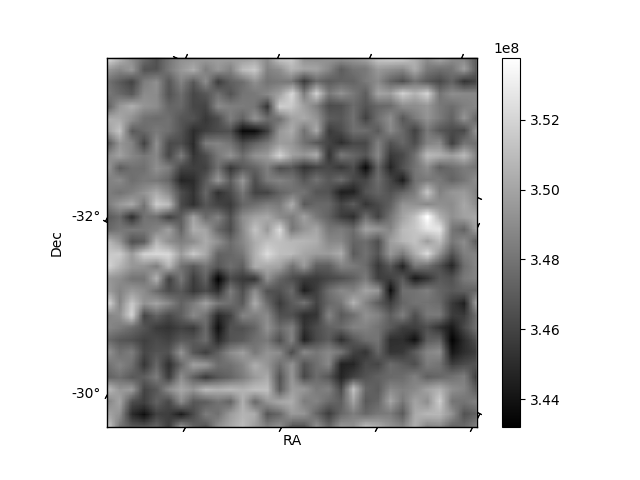
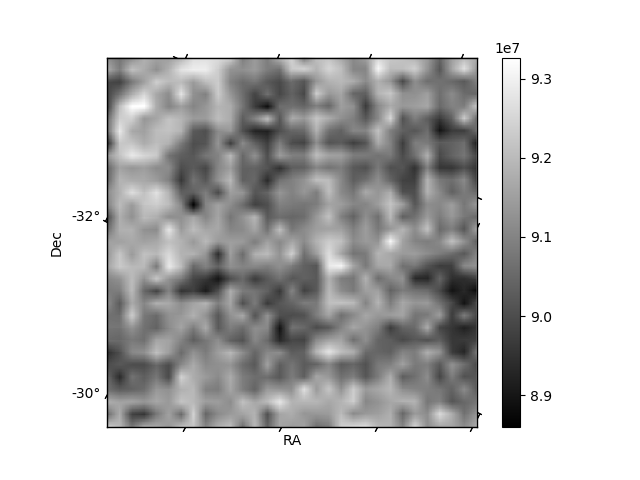
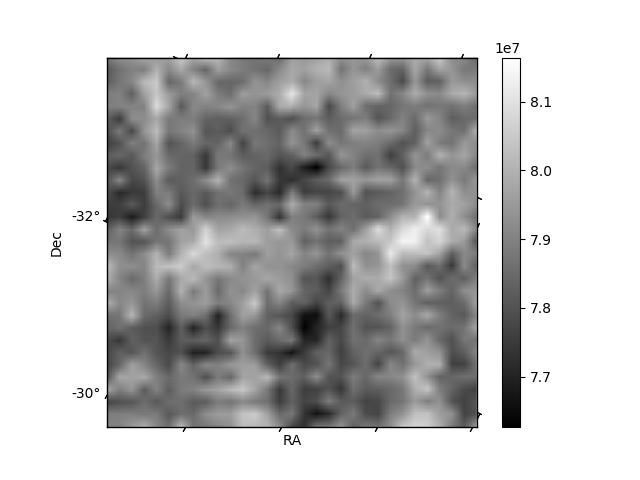
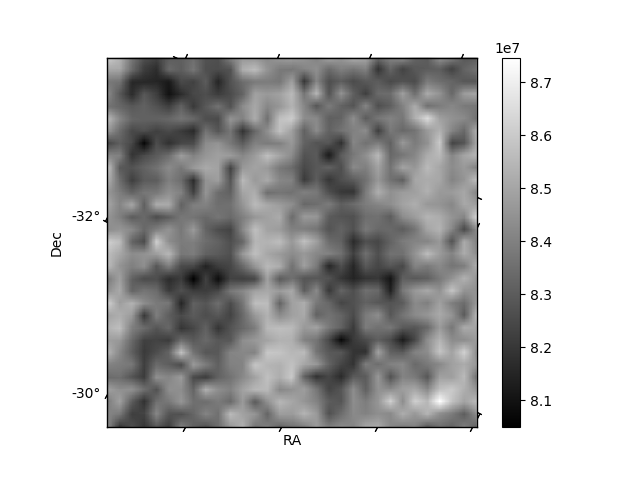
Histogram calculated using DETX and DETY for each event in the final _common_clean file
| Quadrant A | 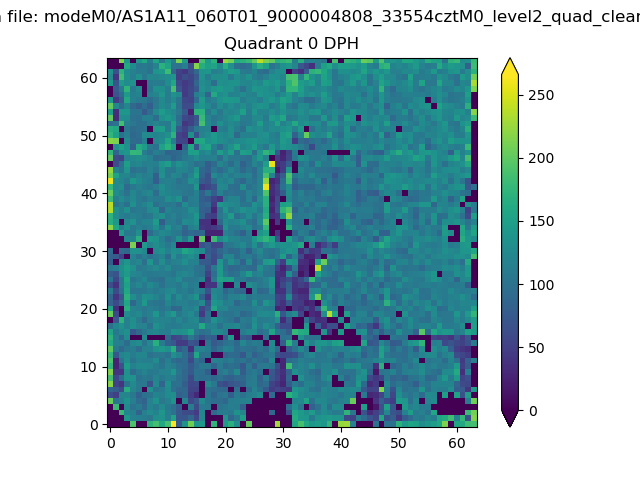 |
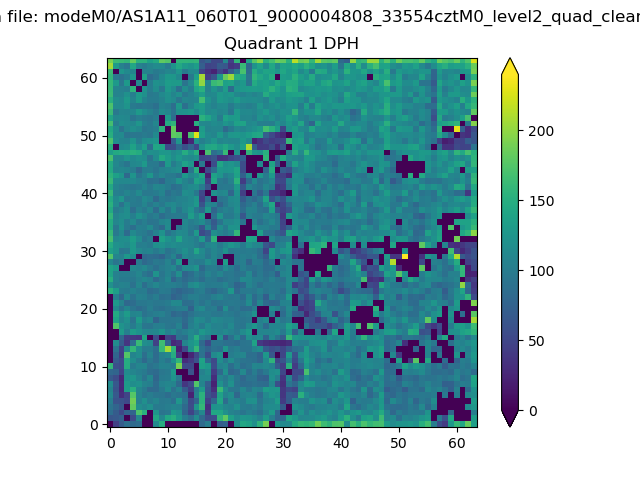 |
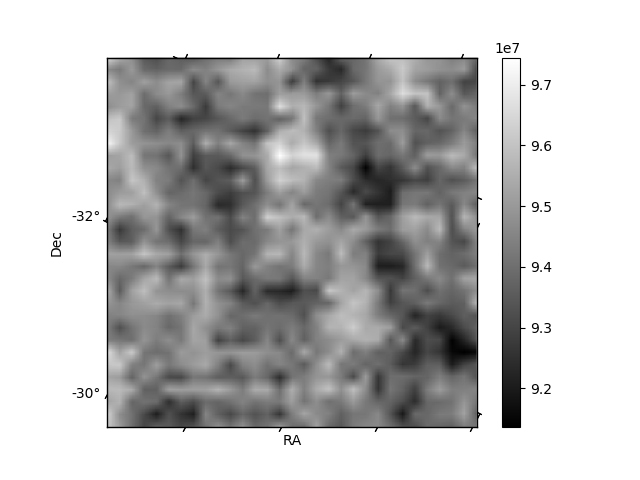
Quadrant B |
|---|---|---|---|
| Quadrant D | 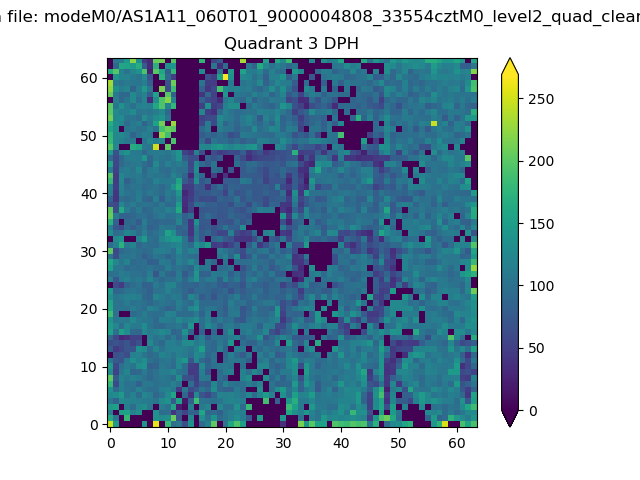 |
 |
Quadrant C |
| Plot type | Count rate plots | Images |
|---|---|---|
| Comparison with Poisson distribution Blue bars denote a histogram of data divided into 1 sec bins. Red curve is a Poisson curve with rate = median count rate of data. |
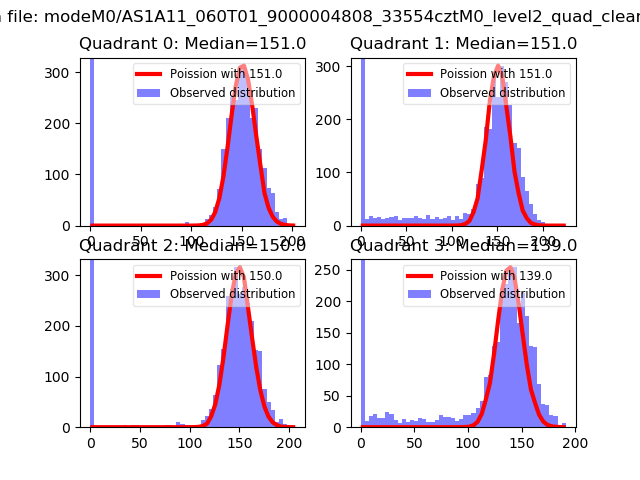 |
 |
| Quadrant-wise count rates Data is divided into 100 sec bins |
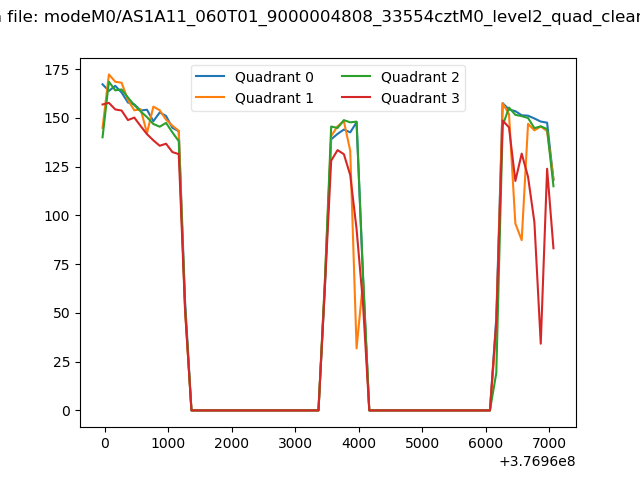 |
|
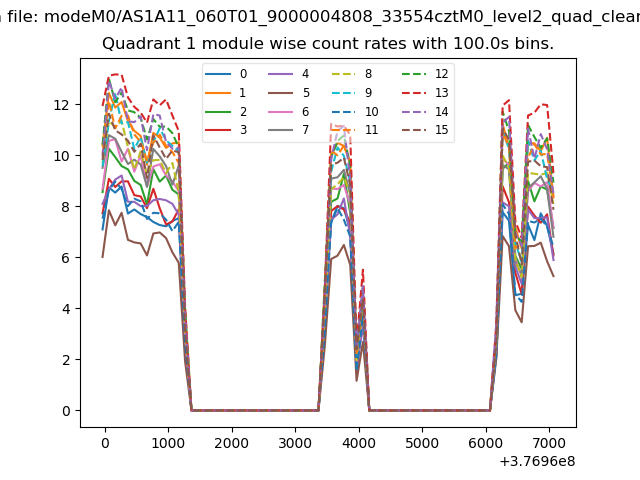
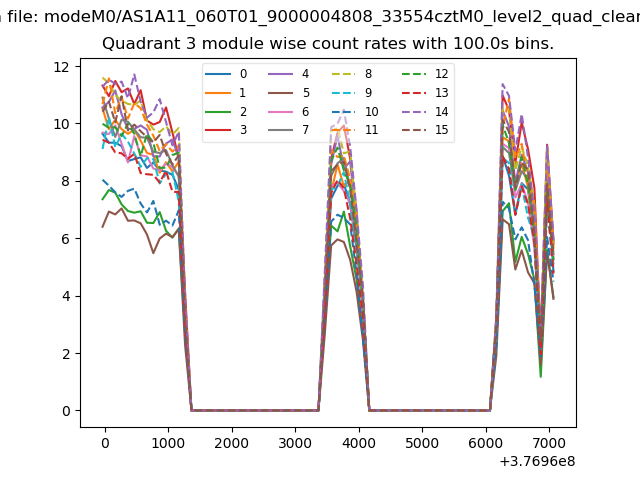
| Module-wise count rates for Quadrant A Data is divided into 100 sec bins |
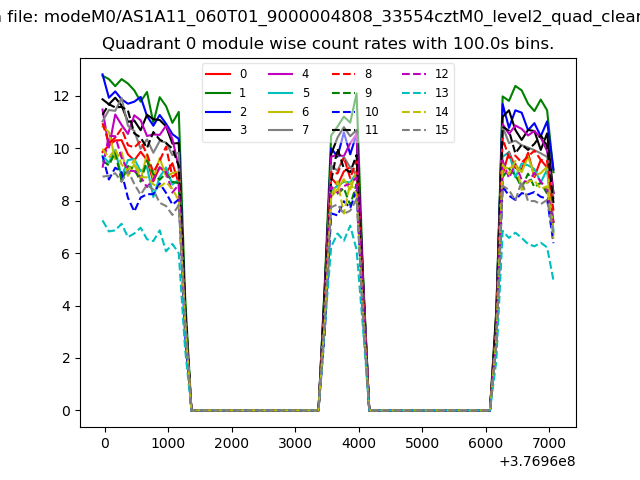 |
 |
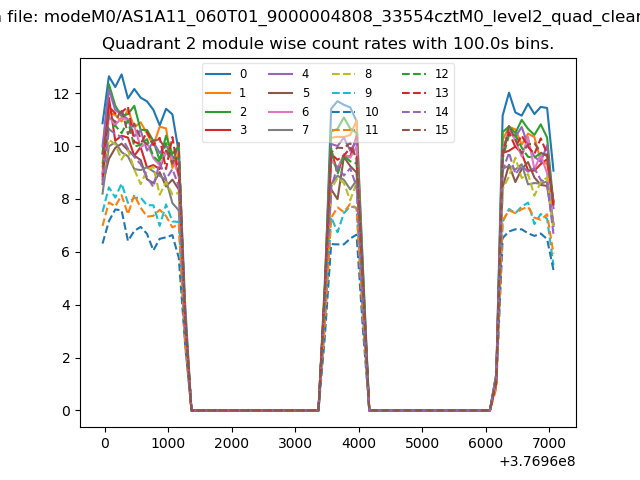
| Module-wise count rates for Quadrant B Data is divided into 100 sec bins |
 |
 |
| Module-wise count rates for Quadrant C Data is divided into 100 sec bins |
 |
 |
| Module-wise count rates for Quadrant D Data is divided into 100 sec bins |
 |
 |
| Parameter | Plot |
|---|---|
| CZT HV Monitor | 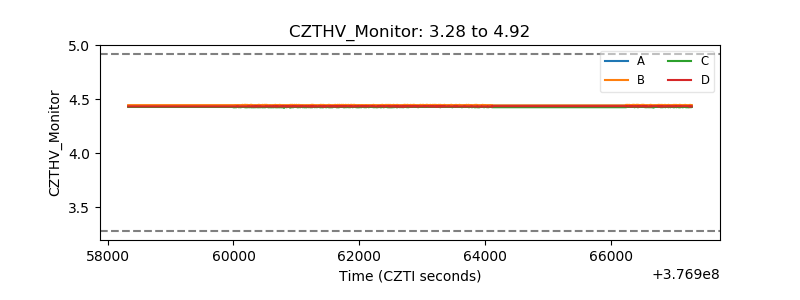 |
| D_VDD | 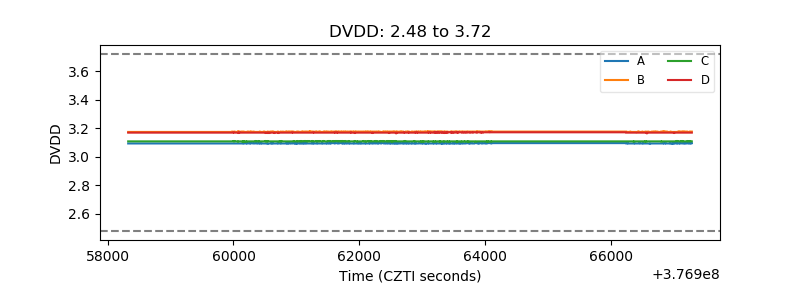 |
| Temperature 1 |  |
| Veto HV Monitor | 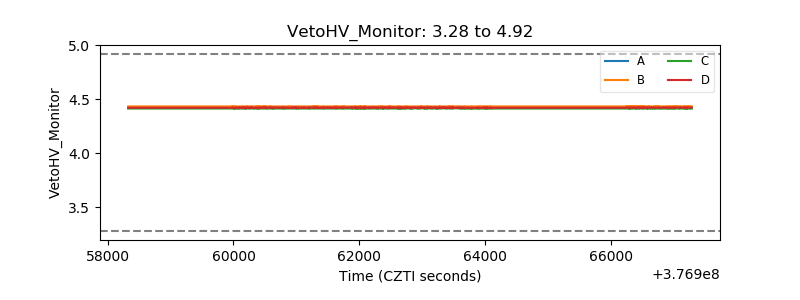 |
| Veto LLD | 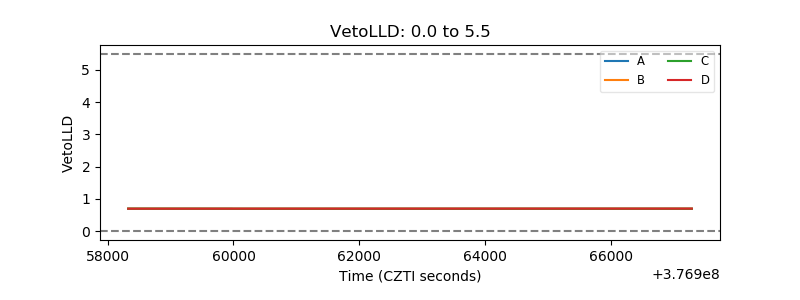 |
| Alpha Counter | 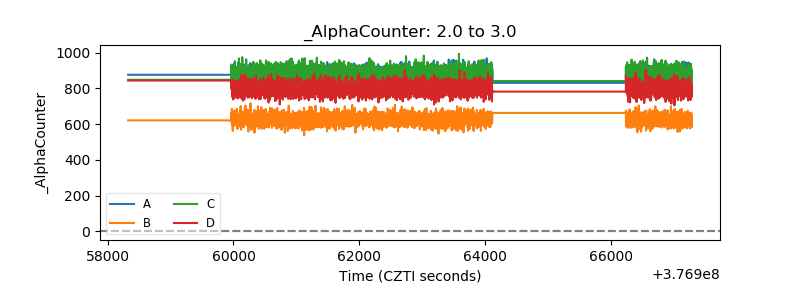 |
| _CPM_Rate | 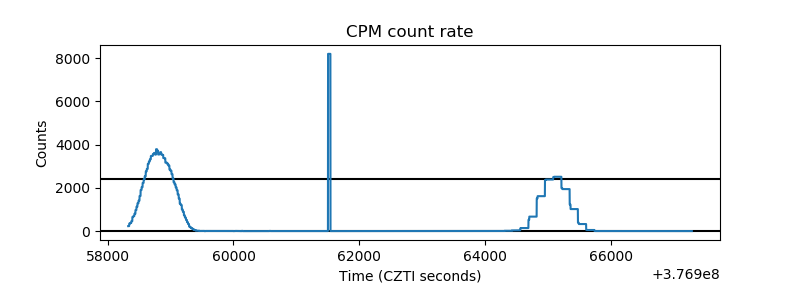 |
| CZT Counter | 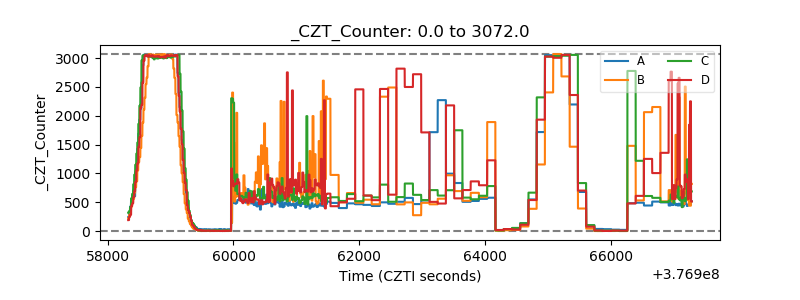 |
| +2.5 Volts monitor |  |
| +5 Volts monitor |  |
| _ROLL_ROT | 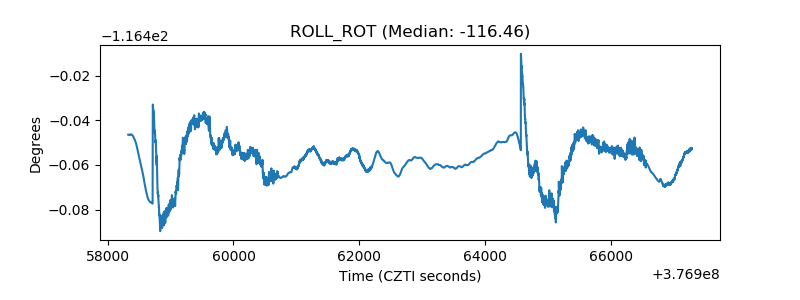 |
| _Roll_DEC |  |
| _Roll_RA | 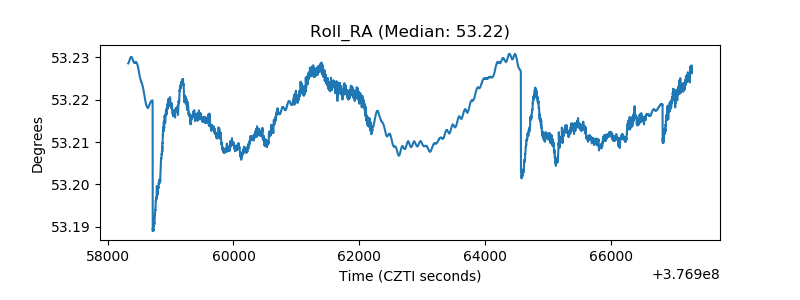 |
| Veto Counter | 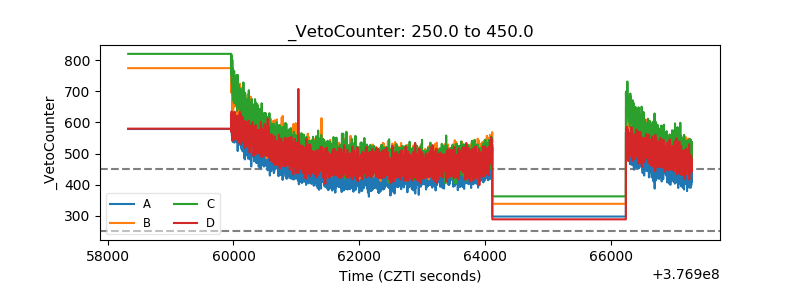 |