| Param | Original file | Final file |
|---|---|---|
| Filename | modeM0/AS1A11_060T01_9000004808_33555cztM0_level2.evt | modeM0/AS1A11_060T01_9000004808_33555cztM0_level2_quad_clean.evt |
| Size (bytes) | 552,816,000 | 54,619,200 |
| Size | 527.2 MB | 52.1 MB |
| Events in quadrant A | 2,434,731 | 348,842 |
| Events in quadrant B | 4,116,352 | 329,735 |
| Events in quadrant C | 3,963,685 | 331,389 |
| Events in quadrant D | 5,885,548 | 288,944 |
| Mode M0 | |||
|---|---|---|---|
| Quadrant | BADHDUFLAG | Total packets | Discarded packets |
| A | 0 | 10268 | 3 |
| B | 0 | 15472 | 2 |
| C | 0 | 14993 | 2 |
| D | 0 | 20882 | 2 |
| Mode M9 | |||
|---|---|---|---|
| Quadrant | BADHDUFLAG | Total packets | Discarded packets |
| A | 0 | 26 | 0 |
| B | 0 | 26 | 0 |
| C | 0 | 26 | 0 |
| D | 0 | 27 | 0 |
| Mode SS | |||
|---|---|---|---|
| Quadrant | BADHDUFLAG | Total packets | Discarded packets |
| A | 0 | 102 | 0 |
| B | 0 | 102 | 0 |
| C | 0 | 102 | 0 |
| D | 0 | 102 | 0 |
| Quadrant | Total seconds | Saturated seconds | Saturation percentage |
|---|---|---|---|
| A | 5054 | 5 | 0.098932% |
| B | 5054 | 457 | 9.042343% |
| C | 5054 | 279 | 5.520380% |
| D | 5054 | 938 | 18.559557% |
Noise dominated data is calculated using 1-second bins in cleaned event files. If a bin has >2000 counts, and if more than 50% of those come from <1% of pixels, then it is considered to be noise-dominated and hence unusable.
| Quadrant | # 1 sec bins | Bins with >0 counts | Bins with >2000 counts | High rate bins dominated by noise | Noise dominated (total time) | Noise dominated (detector-on time) | Marked lightcurve |
|---|---|---|---|---|---|---|---|
| A | 7177 | 5055 | 0 | 0 | 0.00% | 0.00% | 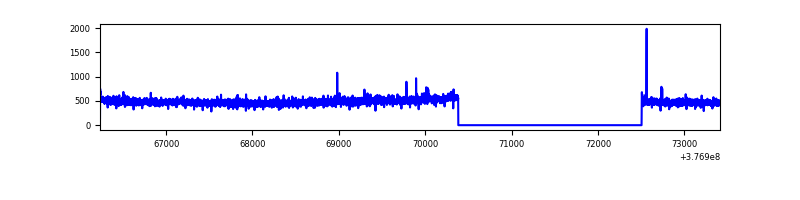 |
| B | 7177 | 5055 | 370 | 370 | 5.16% | 7.32% | 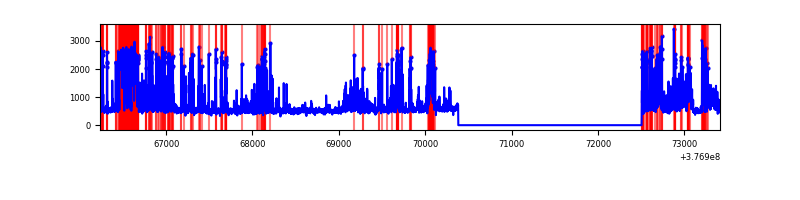 |
| C | 7177 | 5054 | 275 | 275 | 3.83% | 5.44% | 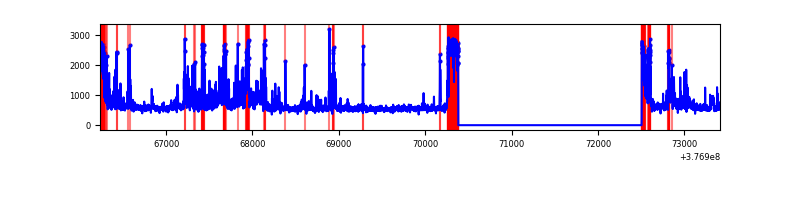 |
| D | 7177 | 5055 | 961 | 961 | 13.39% | 19.01% | 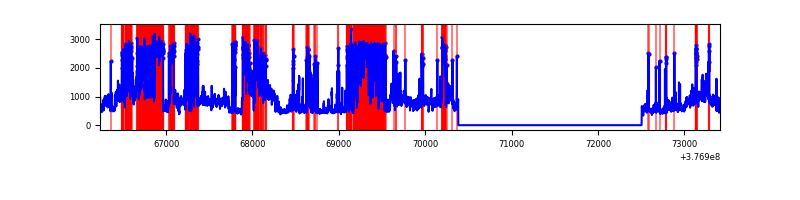 |
Top three noisy pixels from each quadrant. If the there are fewer than three noisy pixels in the level2.evt file, extra rows are filled as -1
| Pixel properties | Quadrant properties | ||||||
|---|---|---|---|---|---|---|---|
| Quadrant | DetID | PixID | Counts | Sigma | Mean | Median | Sigma |
| A | 15 | 169 | 13702 | 105.15 | 624 | 614 | 124.5 |
| A | 13 | 254 | 7829 | 57.96 | 624 | 614 | 124.5 |
| A | 10 | 83 | 6092 | 44.01 | 624 | 614 | 124.5 |
| B | 5 | 172 | 1295574 | 11200.24 | 605 | 591 | 115.6 |
| B | 4 | 170 | 195624 | 1686.83 | 605 | 591 | 115.6 |
| B | 4 | 251 | 102182 | 878.66 | 605 | 591 | 115.6 |
| C | 1 | 23 | 754179 | 5350.87 | 606 | 612 | 140.8 |
| C | 0 | 10 | 303123 | 2148.05 | 606 | 612 | 140.8 |
| C | 15 | 214 | 215686 | 1527.18 | 606 | 612 | 140.8 |
| D | 2 | 31 | 2279546 | 16660.52 | 556 | 541 | 136.8 |
| D | 8 | 195 | 1001255 | 7315.66 | 556 | 541 | 136.8 |
| D | 15 | 0 | 236894 | 1727.84 | 556 | 541 | 136.8 |
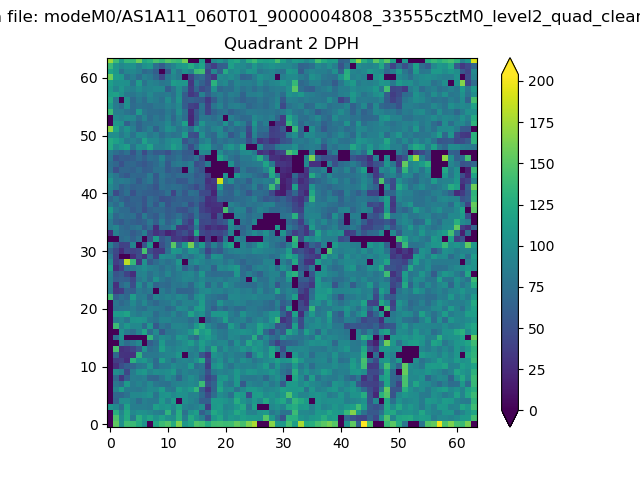
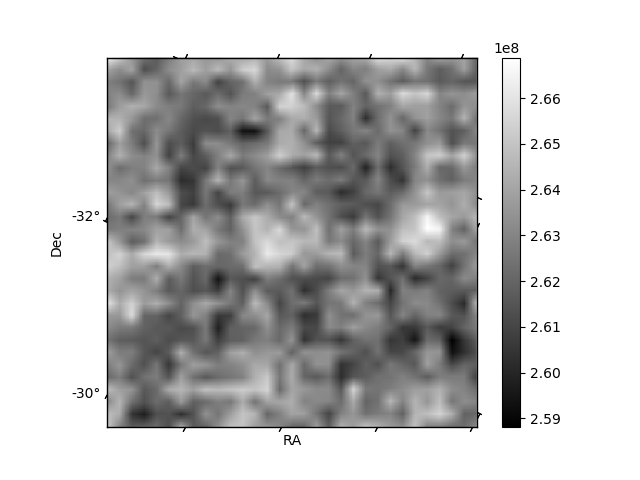
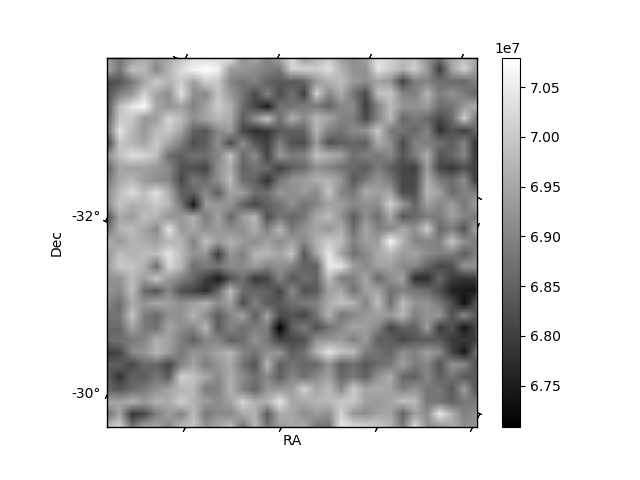
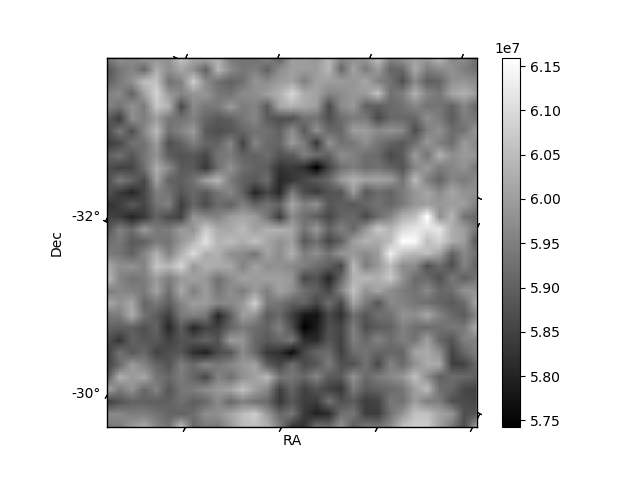
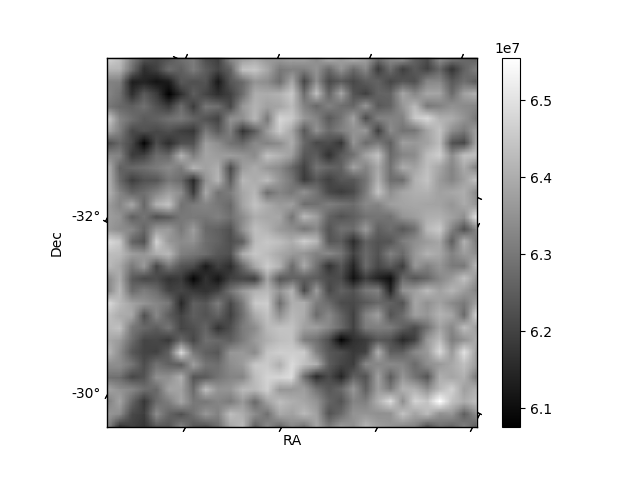
Histogram calculated using DETX and DETY for each event in the final _common_clean file
| Quadrant A | 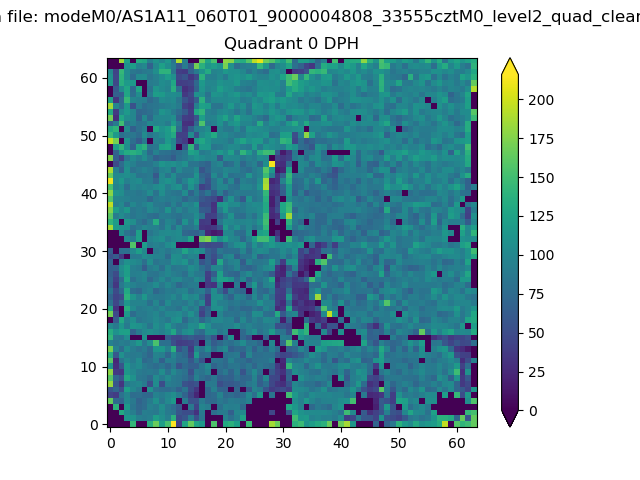 |
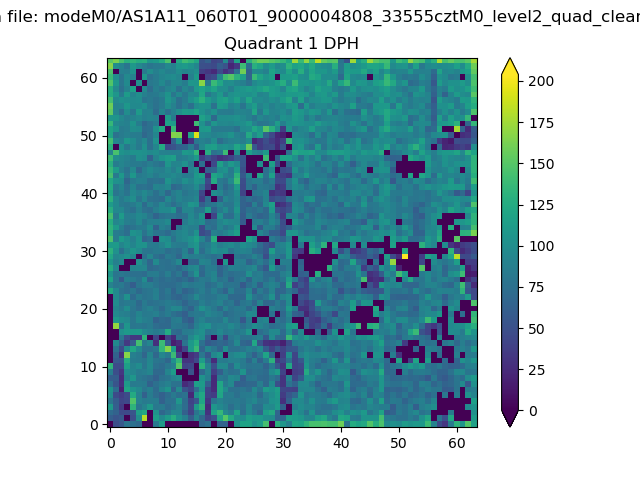 |
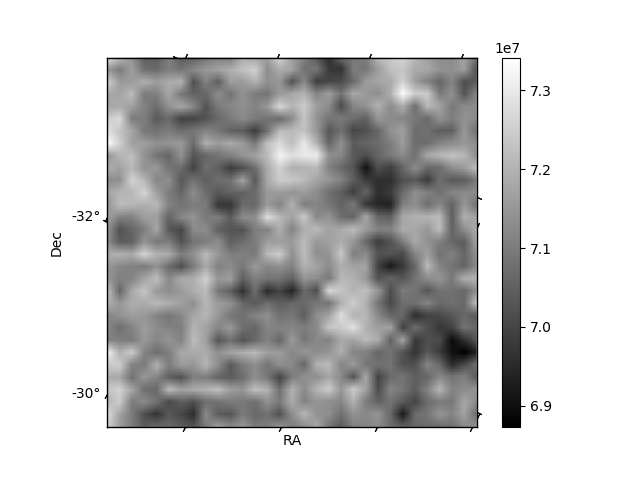
Quadrant B |
|---|---|---|---|
| Quadrant D | 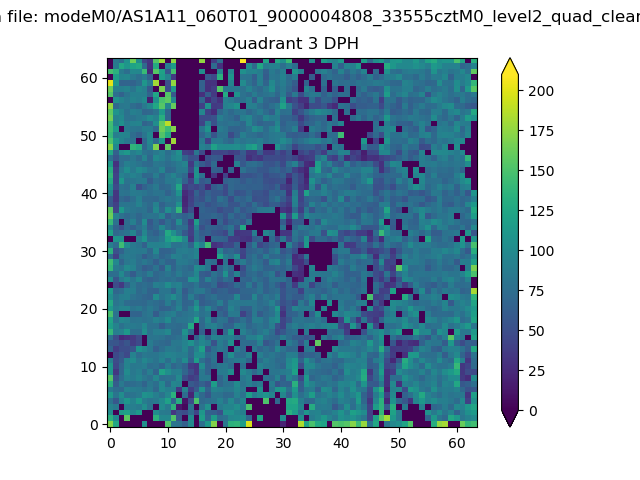 |
 |
Quadrant C |
| Plot type | Count rate plots | Images |
|---|---|---|
| Comparison with Poisson distribution Blue bars denote a histogram of data divided into 1 sec bins. Red curve is a Poisson curve with rate = median count rate of data. |
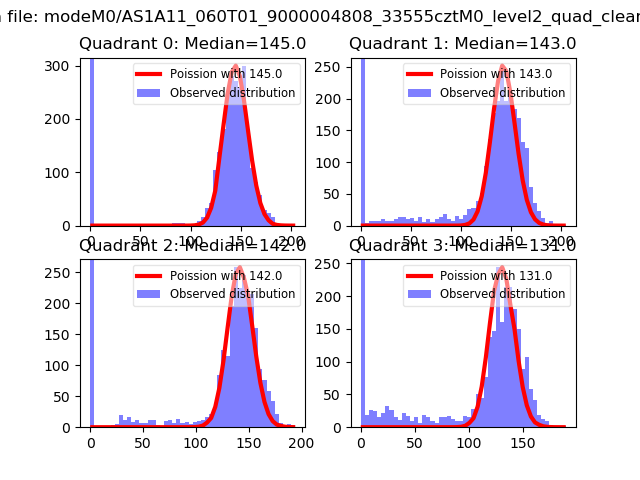 |
 |
| Quadrant-wise count rates Data is divided into 100 sec bins |
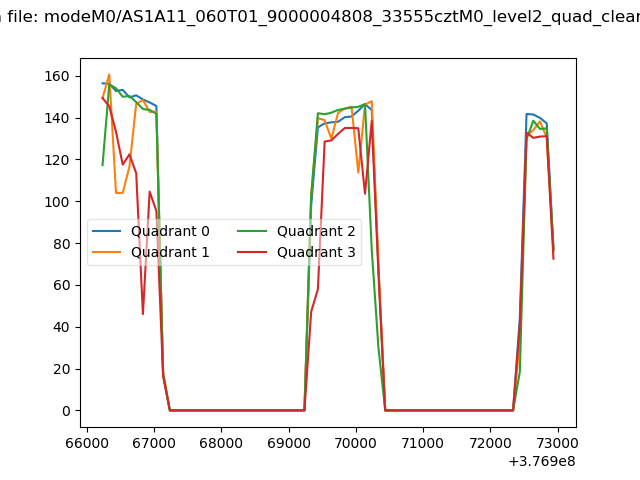 |
|
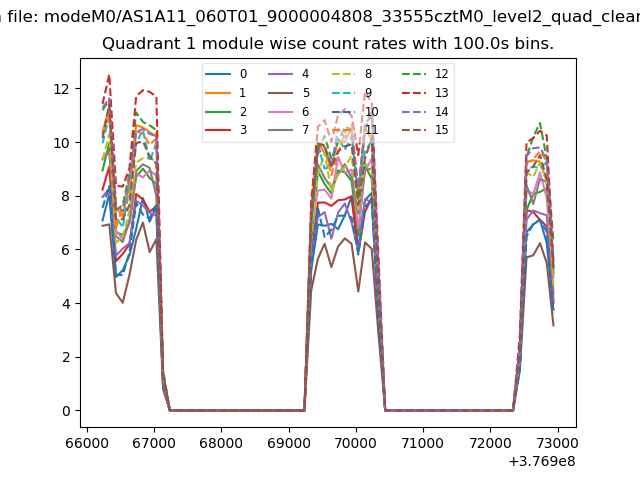
| Module-wise count rates for Quadrant A Data is divided into 100 sec bins |
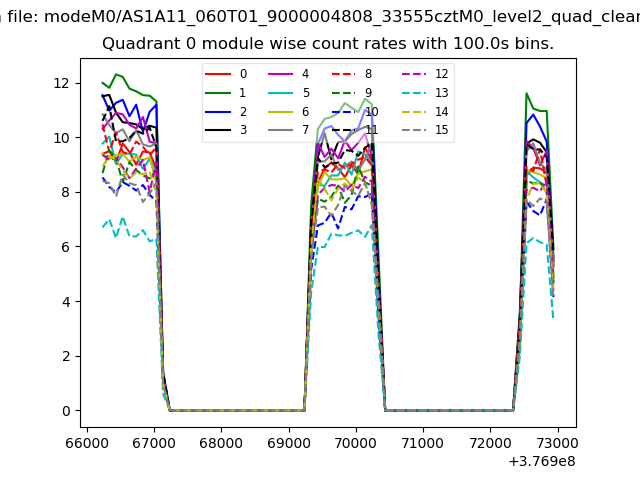 |
 |
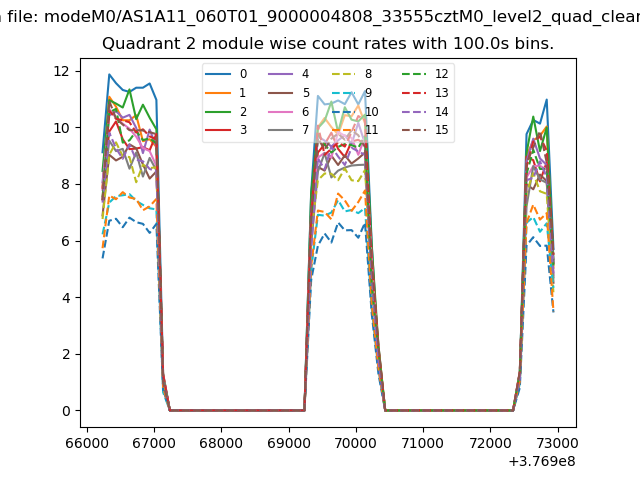
| Module-wise count rates for Quadrant B Data is divided into 100 sec bins |
 |
 |
| Module-wise count rates for Quadrant C Data is divided into 100 sec bins |
 |
 |
| Module-wise count rates for Quadrant D Data is divided into 100 sec bins |
 |
 |
| Parameter | Plot |
|---|---|
| CZT HV Monitor | 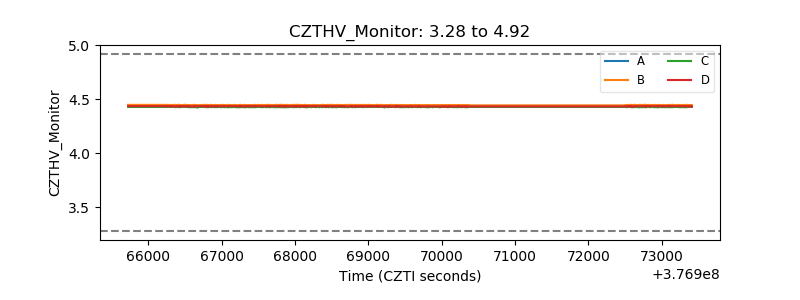 |
| D_VDD | 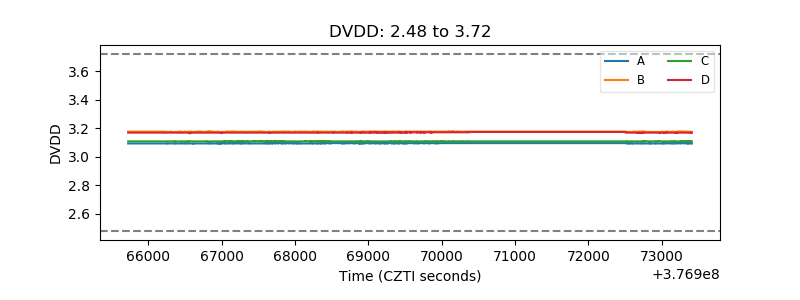 |
| Temperature 1 | 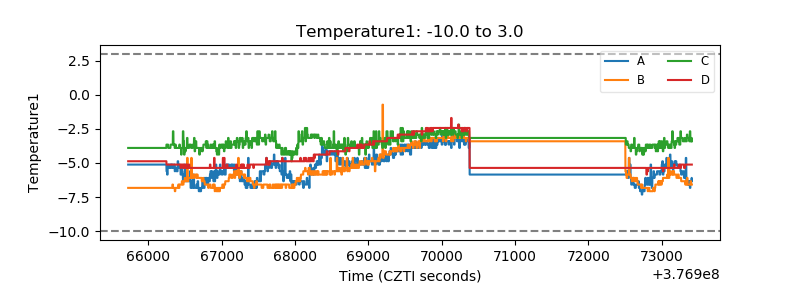 |
| Veto HV Monitor | 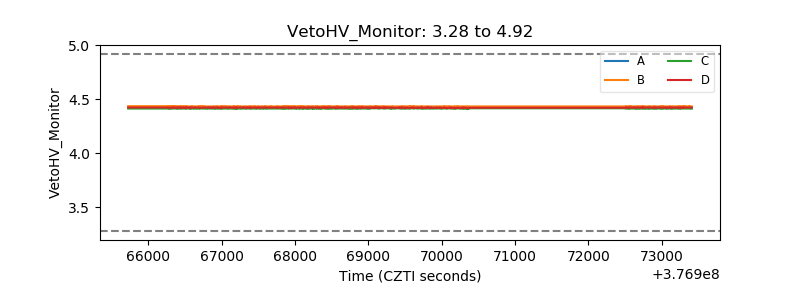 |
| Veto LLD |  |
| Alpha Counter | 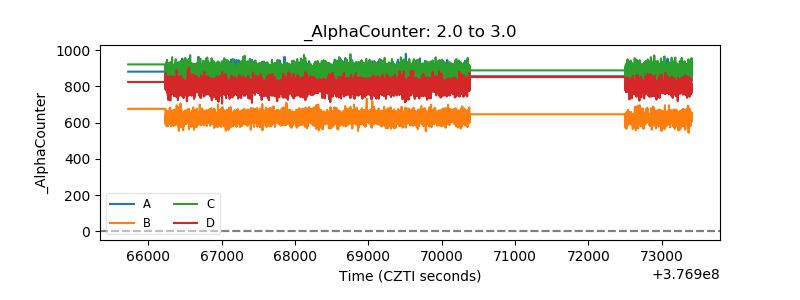 |
| _CPM_Rate | 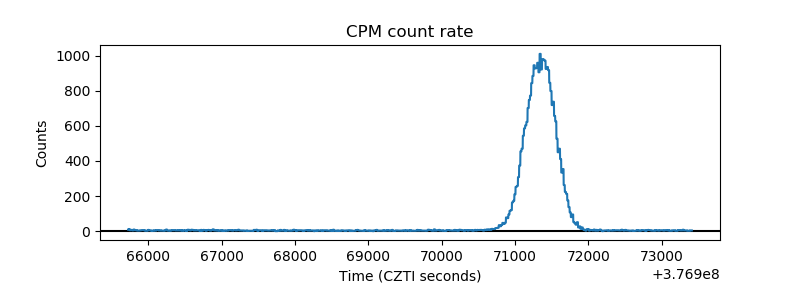 |
| CZT Counter | 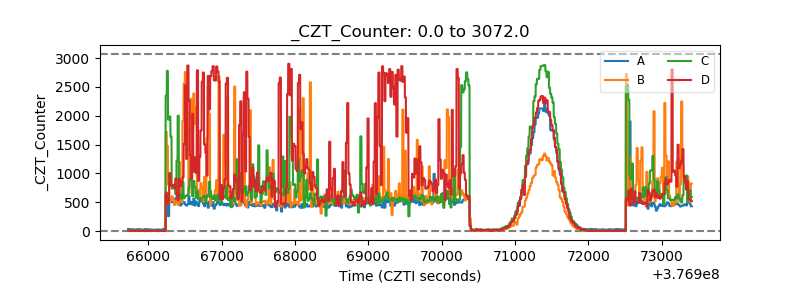 |
| +2.5 Volts monitor |  |
| +5 Volts monitor |  |
| _ROLL_ROT |  |
| _Roll_DEC | 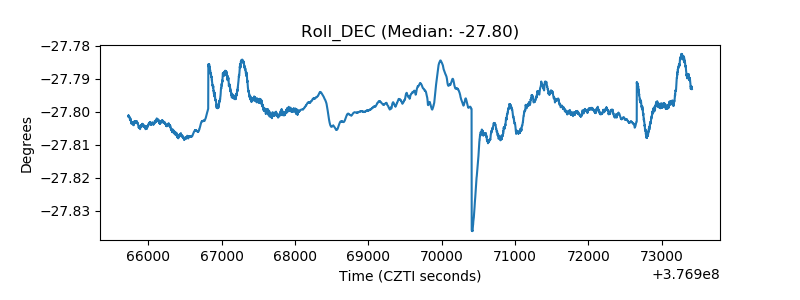 |
| _Roll_RA | 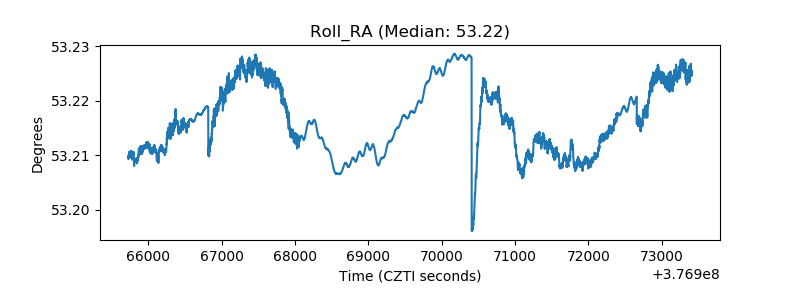 |
| Veto Counter | 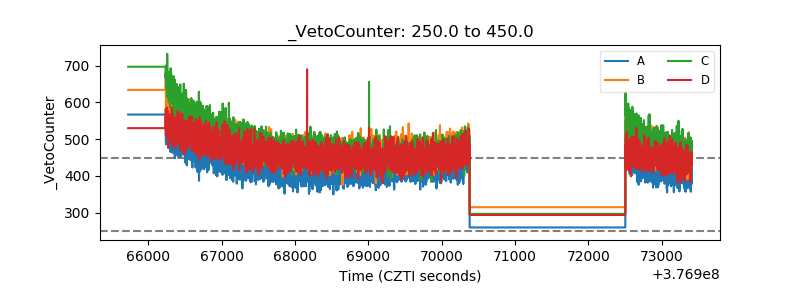 |