| Param | Original file | Final file |
|---|---|---|
| Filename | modeM0/AS1A11_060T01_9000004808_33557cztM0_level2.evt | modeM0/AS1A11_060T01_9000004808_33557cztM0_level2_quad_clean.evt |
| Size (bytes) | 511,974,720 | 53,248,320 |
| Size | 488.3 MB | 50.8 MB |
| Events in quadrant A | 2,483,128 | 315,663 |
| Events in quadrant B | 4,571,812 | 305,356 |
| Events in quadrant C | 3,789,044 | 309,431 |
| Events in quadrant D | 4,291,890 | 300,197 |
| Mode M0 | |||
|---|---|---|---|
| Quadrant | BADHDUFLAG | Total packets | Discarded packets |
| A | 0 | 10938 | 3 |
| B | 0 | 17036 | 2 |
| C | 0 | 14661 | 2 |
| D | 0 | 16501 | 2 |
| Mode M9 | |||
|---|---|---|---|
| Quadrant | BADHDUFLAG | Total packets | Discarded packets |
| A | 0 | 25 | 0 |
| B | 0 | 25 | 0 |
| C | 0 | 25 | 0 |
| D | 0 | 26 | 0 |
| Mode SS | |||
|---|---|---|---|
| Quadrant | BADHDUFLAG | Total packets | Discarded packets |
| A | 0 | 110 | 0 |
| B | 0 | 110 | 0 |
| C | 0 | 110 | 0 |
| D | 0 | 110 | 0 |
| Quadrant | Total seconds | Saturated seconds | Saturation percentage |
|---|---|---|---|
| A | 5450 | 7 | 0.128440% |
| B | 5450 | 692 | 12.697248% |
| C | 5450 | 143 | 2.623853% |
| D | 5450 | 165 | 3.027523% |
Noise dominated data is calculated using 1-second bins in cleaned event files. If a bin has >2000 counts, and if more than 50% of those come from <1% of pixels, then it is considered to be noise-dominated and hence unusable.
| Quadrant | # 1 sec bins | Bins with >0 counts | Bins with >2000 counts | High rate bins dominated by noise | Noise dominated (total time) | Noise dominated (detector-on time) | Marked lightcurve |
|---|---|---|---|---|---|---|---|
| A | 7093 | 5451 | 0 | 0 | 0.00% | 0.00% | 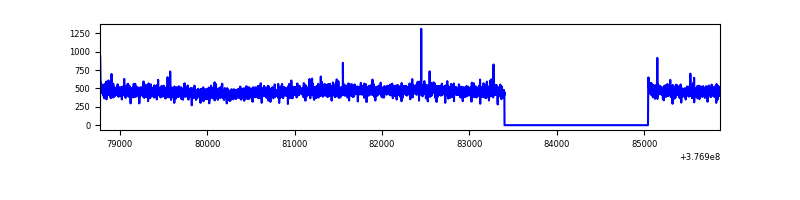 |
| B | 7093 | 5451 | 586 | 586 | 8.26% | 10.75% | 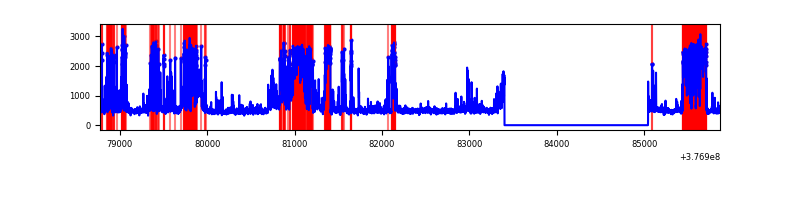 |
| C | 7093 | 5451 | 141 | 141 | 1.99% | 2.59% | 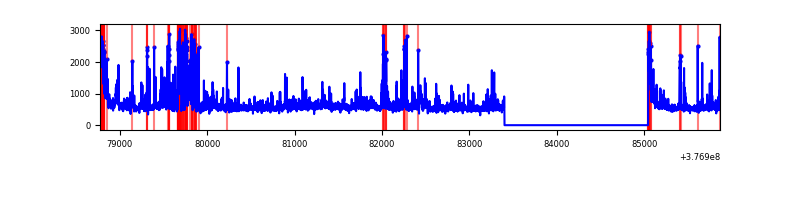 |
| D | 7093 | 5451 | 150 | 150 | 2.11% | 2.75% | 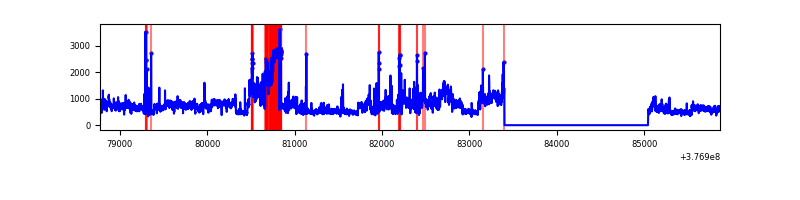 |
Top three noisy pixels from each quadrant. If the there are fewer than three noisy pixels in the level2.evt file, extra rows are filled as -1
| Pixel properties | Quadrant properties | ||||||
|---|---|---|---|---|---|---|---|
| Quadrant | DetID | PixID | Counts | Sigma | Mean | Median | Sigma |
| A | 13 | 254 | 8659 | 62.78 | 640 | 627 | 127.9 |
| A | 3 | 137 | 6519 | 46.05 | 640 | 627 | 127.9 |
| A | 10 | 83 | 6434 | 45.39 | 640 | 627 | 127.9 |
| B | 5 | 172 | 1437253 | 12292.79 | 606 | 590 | 116.9 |
| B | 5 | 200 | 333731 | 2850.52 | 606 | 590 | 116.9 |
| B | 4 | 251 | 194771 | 1661.51 | 606 | 590 | 116.9 |
| C | 1 | 23 | 489178 | 3360.33 | 621 | 626 | 145.4 |
| C | 3 | 233 | 341575 | 2345.1 | 621 | 626 | 145.4 |
| C | 15 | 214 | 233189 | 1599.6 | 621 | 626 | 145.4 |
| D | 8 | 195 | 1138513 | 7472.46 | 615 | 597 | 152.3 |
| D | 15 | 0 | 494038 | 3240.32 | 615 | 597 | 152.3 |
| D | 1 | 52 | 111030 | 725.19 | 615 | 597 | 152.3 |
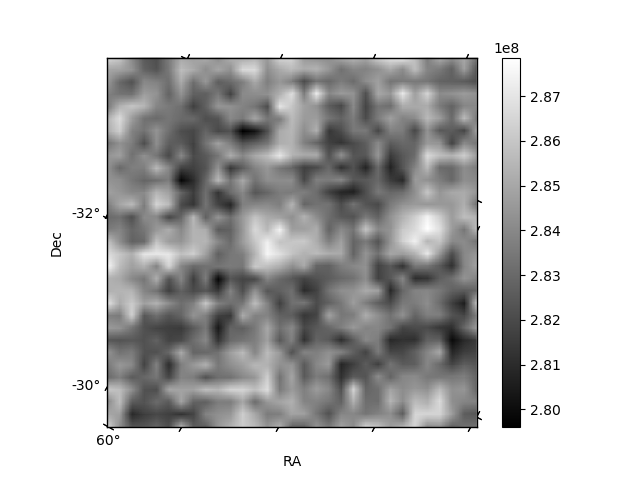
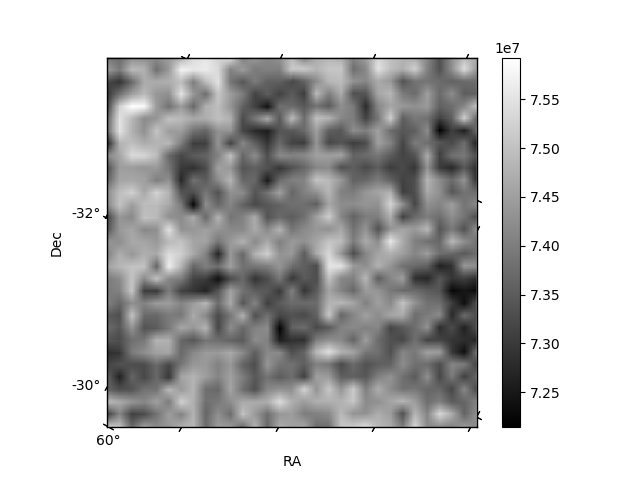
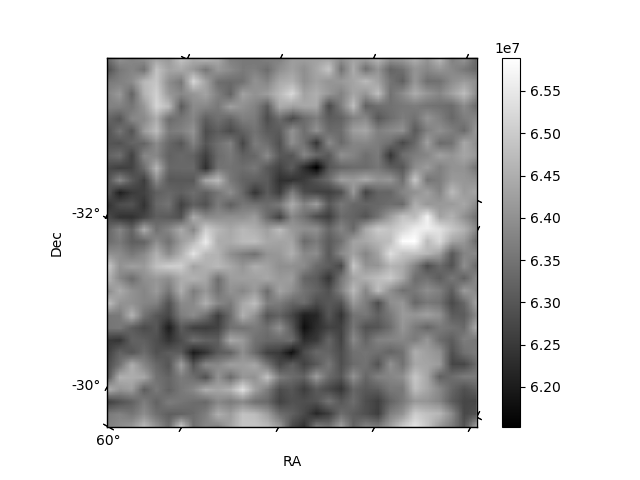
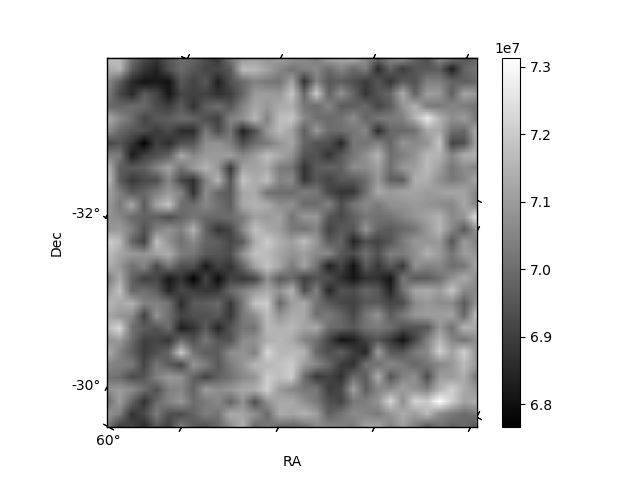
Histogram calculated using DETX and DETY for each event in the final _common_clean file
| Quadrant A | 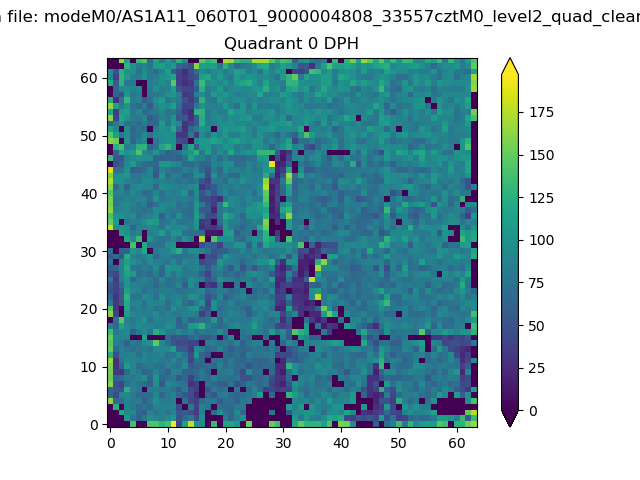 |
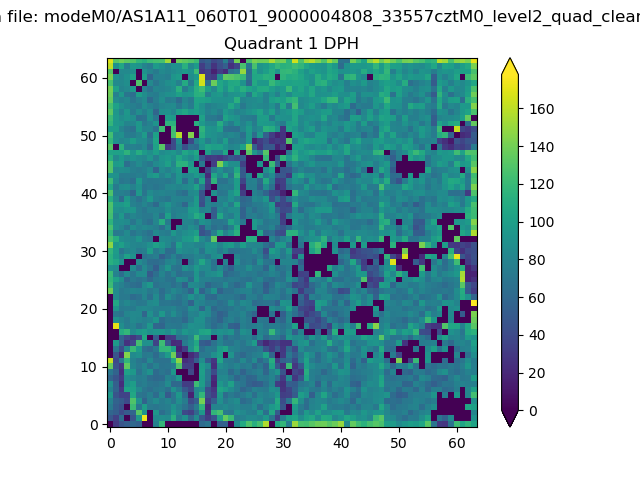 |
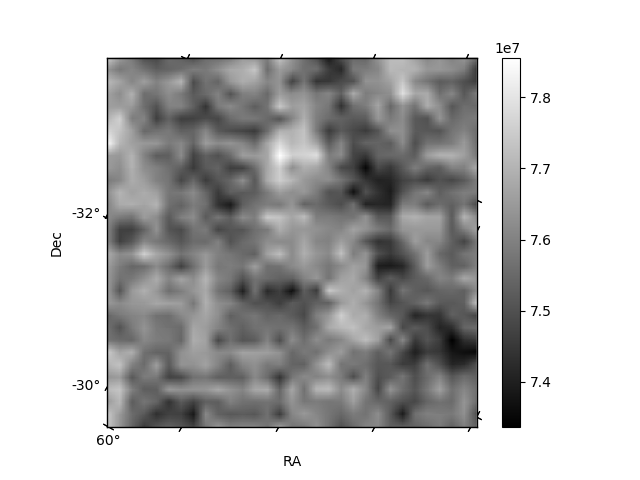
Quadrant B |
|---|---|---|---|
| Quadrant D | 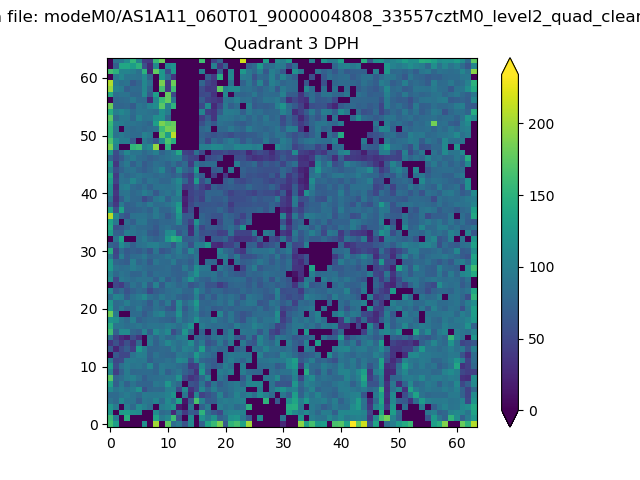 |
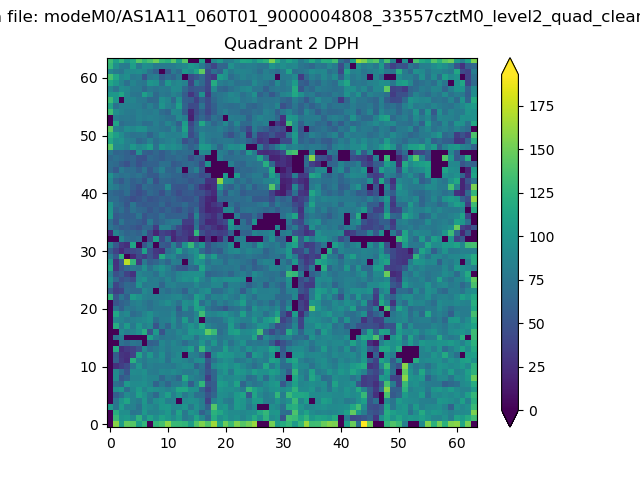 |
Quadrant C |
| Plot type | Count rate plots | Images |
|---|---|---|
| Comparison with Poisson distribution Blue bars denote a histogram of data divided into 1 sec bins. Red curve is a Poisson curve with rate = median count rate of data. |
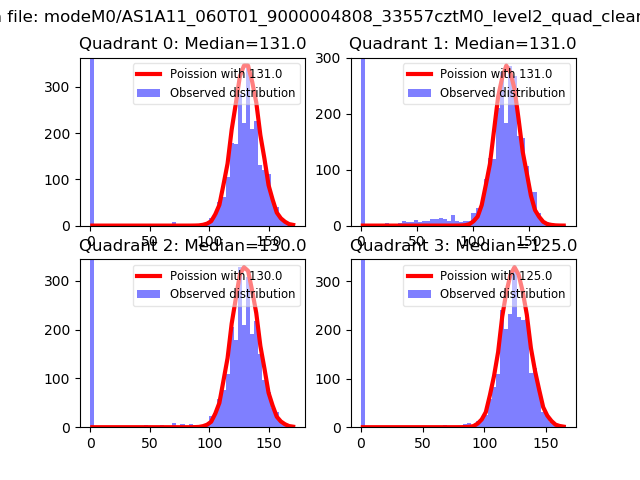 |
 |
| Quadrant-wise count rates Data is divided into 100 sec bins |
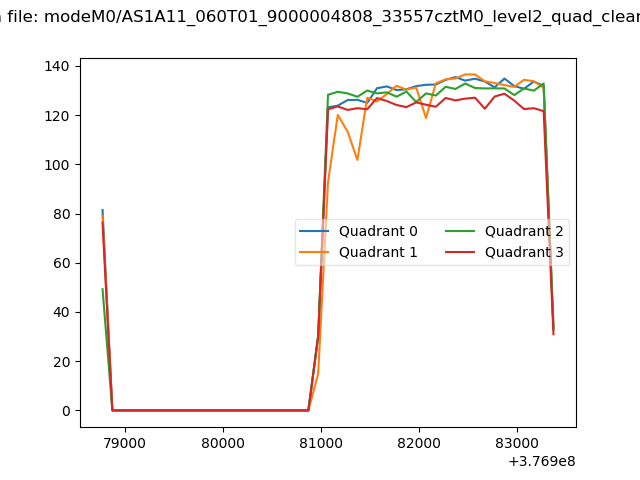 |
|
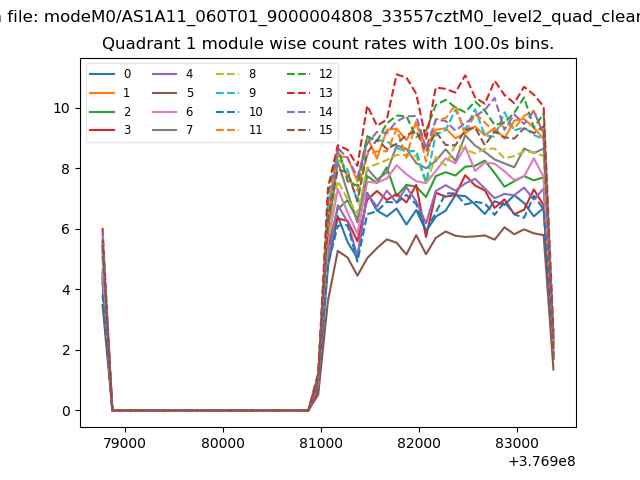
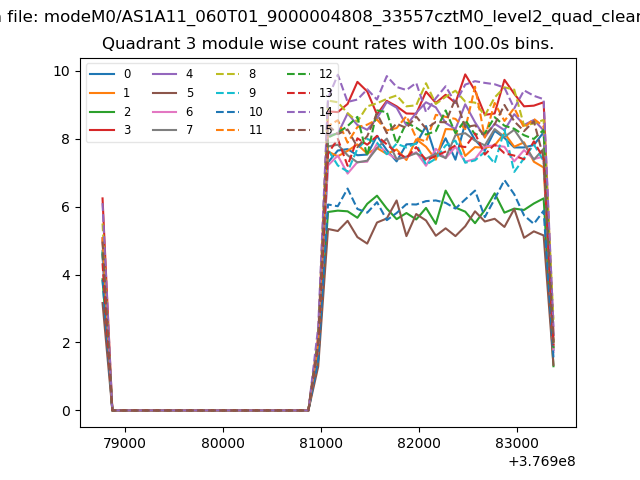
| Module-wise count rates for Quadrant A Data is divided into 100 sec bins |
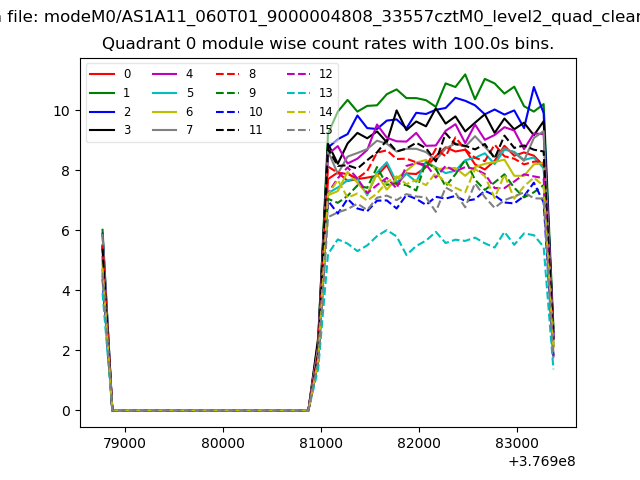 |
 |
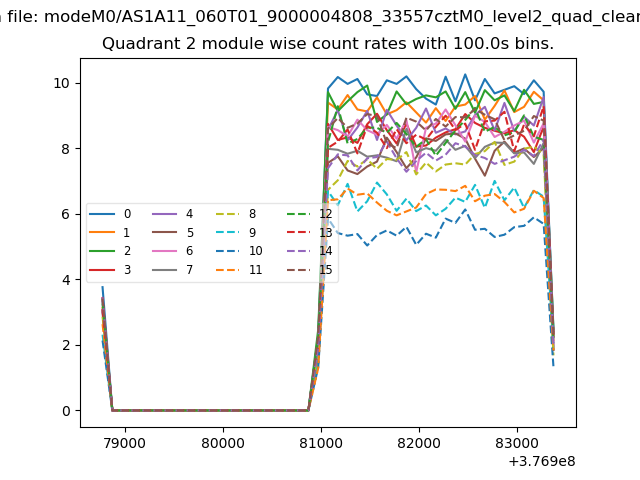
| Module-wise count rates for Quadrant B Data is divided into 100 sec bins |
 |
 |
| Module-wise count rates for Quadrant C Data is divided into 100 sec bins |
 |
 |
| Module-wise count rates for Quadrant D Data is divided into 100 sec bins |
 |
 |
| Parameter | Plot |
|---|---|
| CZT HV Monitor | 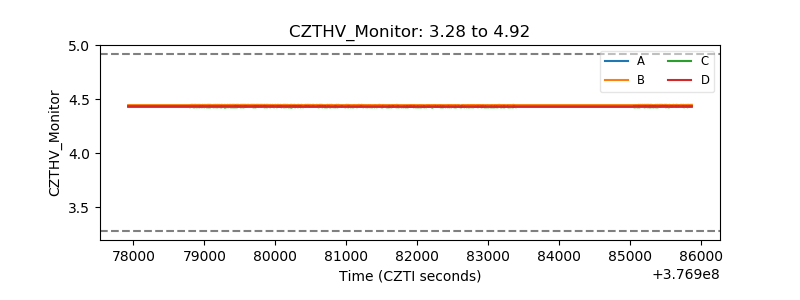 |
| D_VDD | 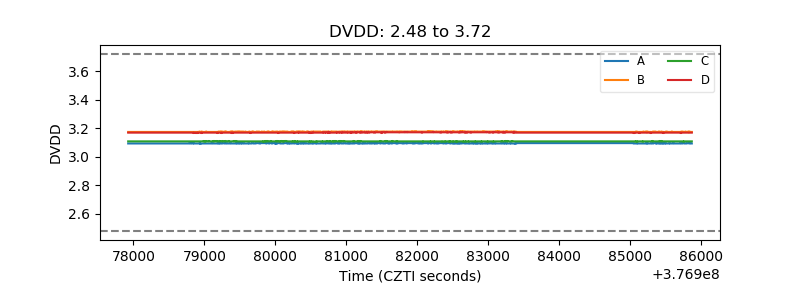 |
| Temperature 1 | 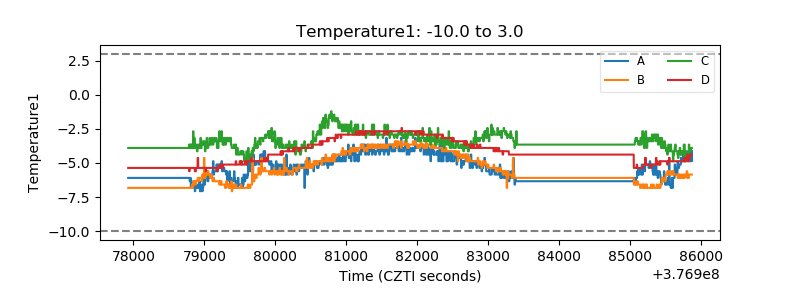 |
| Veto HV Monitor | 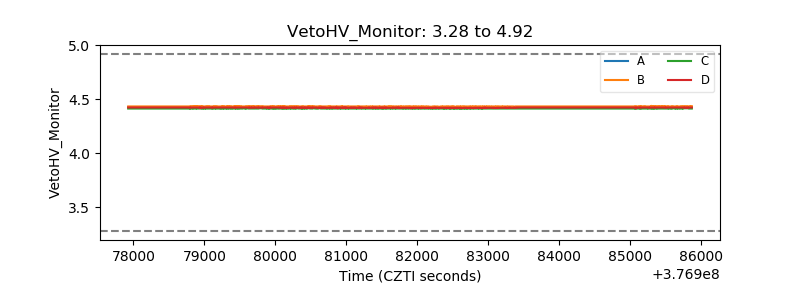 |
| Veto LLD | 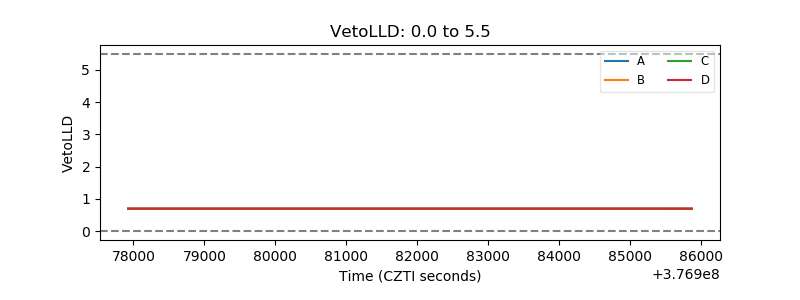 |
| Alpha Counter | 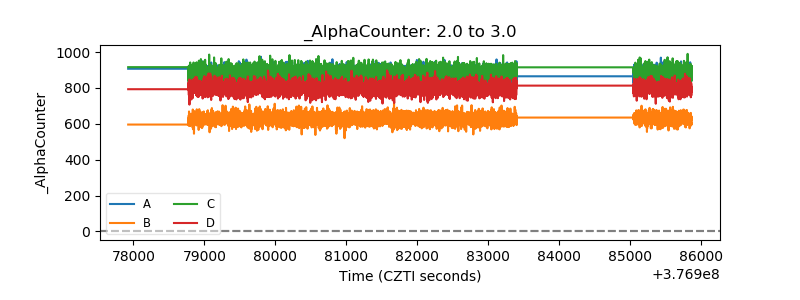 |
| _CPM_Rate | 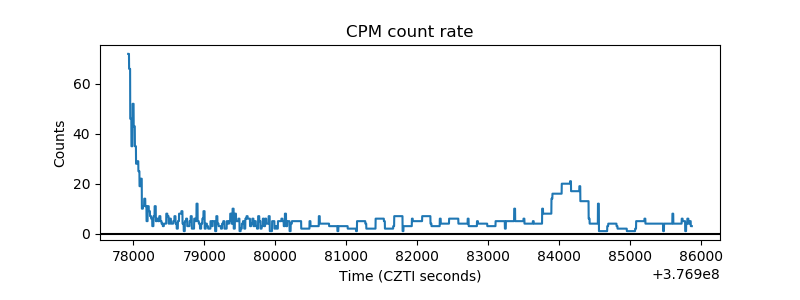 |
| CZT Counter | 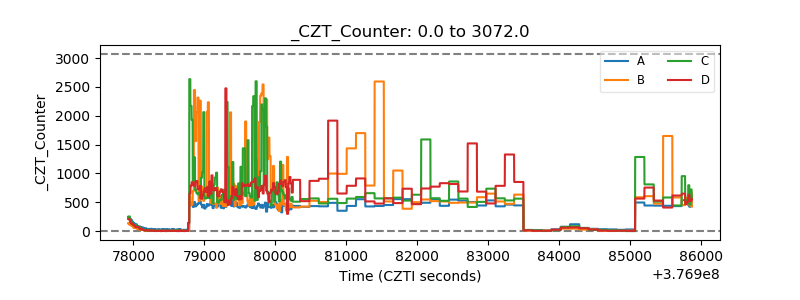 |
| +2.5 Volts monitor | 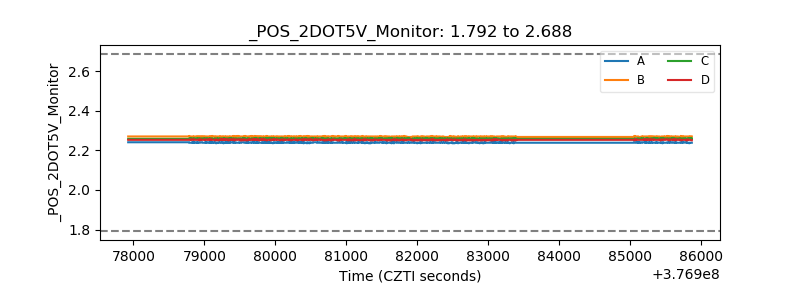 |
| +5 Volts monitor |  |
| _ROLL_ROT | 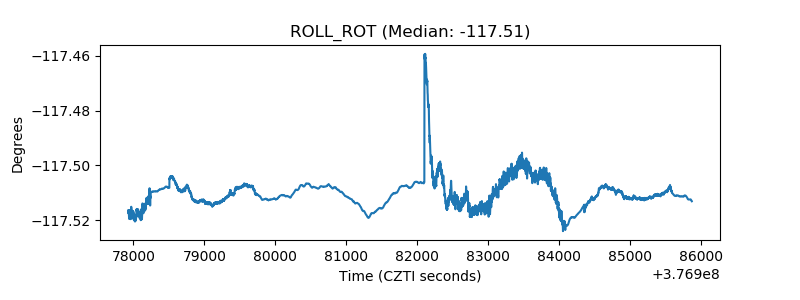 |
| _Roll_DEC | 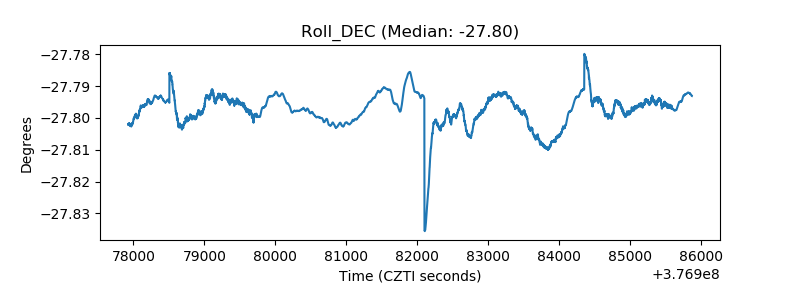 |
| _Roll_RA | 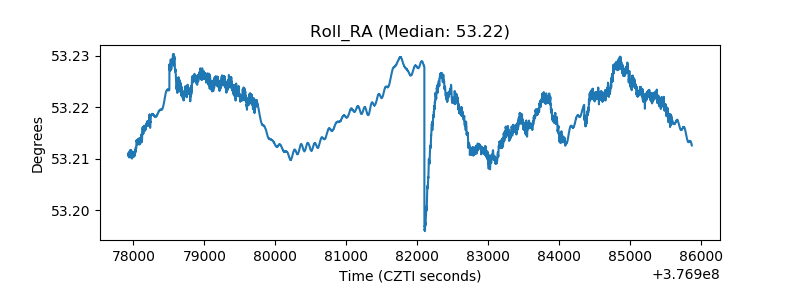 |
| Veto Counter | 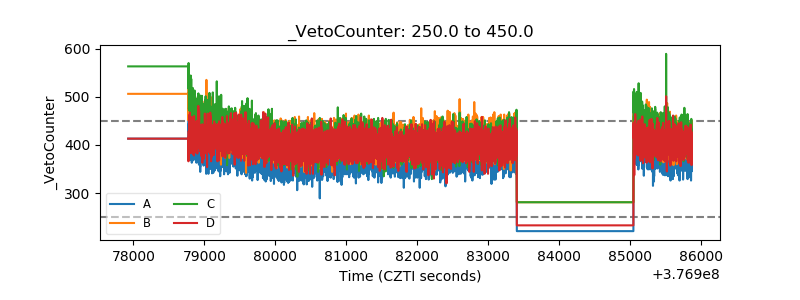 |