| Param | Original file | Final file |
|---|---|---|
| Filename | modeM0/AS1A11_060T01_9000004808_33558cztM0_level2.evt | modeM0/AS1A11_060T01_9000004808_33558cztM0_level2_quad_clean.evt |
| Size (bytes) | 576,918,720 | 70,041,600 |
| Size | 550.2 MB | 66.8 MB |
| Events in quadrant A | 2,779,193 | 441,268 |
| Events in quadrant B | 4,886,490 | 423,262 |
| Events in quadrant C | 3,810,329 | 438,291 |
| Events in quadrant D | 5,578,182 | 386,861 |
| Mode M0 | |||
|---|---|---|---|
| Quadrant | BADHDUFLAG | Total packets | Discarded packets |
| A | 0 | 12364 | 3 |
| B | 0 | 18395 | 2 |
| C | 0 | 15046 | 2 |
| D | 0 | 20792 | 2 |
| Mode M9 | |||
|---|---|---|---|
| Quadrant | BADHDUFLAG | Total packets | Discarded packets |
| A | 0 | 30 | 0 |
| B | 0 | 30 | 0 |
| C | 0 | 30 | 0 |
| D | 0 | 30 | 0 |
| Mode SS | |||
|---|---|---|---|
| Quadrant | BADHDUFLAG | Total packets | Discarded packets |
| A | 0 | 128 | 0 |
| B | 0 | 128 | 0 |
| C | 0 | 128 | 0 |
| D | 0 | 128 | 0 |
| Quadrant | Total seconds | Saturated seconds | Saturation percentage |
|---|---|---|---|
| A | 6168 | 4 | 0.064851% |
| B | 6168 | 694 | 11.251621% |
| C | 6168 | 80 | 1.297017% |
| D | 6168 | 560 | 9.079118% |
Noise dominated data is calculated using 1-second bins in cleaned event files. If a bin has >2000 counts, and if more than 50% of those come from <1% of pixels, then it is considered to be noise-dominated and hence unusable.
| Quadrant | # 1 sec bins | Bins with >0 counts | Bins with >2000 counts | High rate bins dominated by noise | Noise dominated (total time) | Noise dominated (detector-on time) | Marked lightcurve |
|---|---|---|---|---|---|---|---|
| A | 9184 | 6170 | 0 | 0 | 0.00% | 0.00% |  |
| B | 9184 | 6170 | 543 | 543 | 5.91% | 8.80% |  |
| C | 9184 | 6170 | 65 | 65 | 0.71% | 1.05% |  |
| D | 9184 | 6170 | 561 | 561 | 6.11% | 9.09% |  |
Top three noisy pixels from each quadrant. If the there are fewer than three noisy pixels in the level2.evt file, extra rows are filled as -1
| Pixel properties | Quadrant properties | ||||||
|---|---|---|---|---|---|---|---|
| Quadrant | DetID | PixID | Counts | Sigma | Mean | Median | Sigma |
| A | 13 | 254 | 9001 | 57.55 | 718 | 704 | 144.2 |
| A | 3 | 137 | 7436 | 46.69 | 718 | 704 | 144.2 |
| A | 10 | 83 | 6600 | 40.9 | 718 | 704 | 144.2 |
| B | 5 | 172 | 1718252 | 12970.68 | 684 | 664 | 132.4 |
| B | 5 | 255 | 197816 | 1488.83 | 684 | 664 | 132.4 |
| B | 4 | 251 | 94288 | 707.02 | 684 | 664 | 132.4 |
| C | 3 | 233 | 466555 | 2859.33 | 701 | 704 | 162.9 |
| C | 15 | 214 | 265997 | 1628.33 | 701 | 704 | 162.9 |
| C | 14 | 254 | 151373 | 924.79 | 701 | 704 | 162.9 |
| D | 15 | 0 | 1413675 | 8554.01 | 672 | 652 | 165.2 |
| D | 8 | 195 | 1108853 | 6708.71 | 672 | 652 | 165.2 |
| D | 2 | 249 | 266783 | 1611.08 | 672 | 652 | 165.2 |
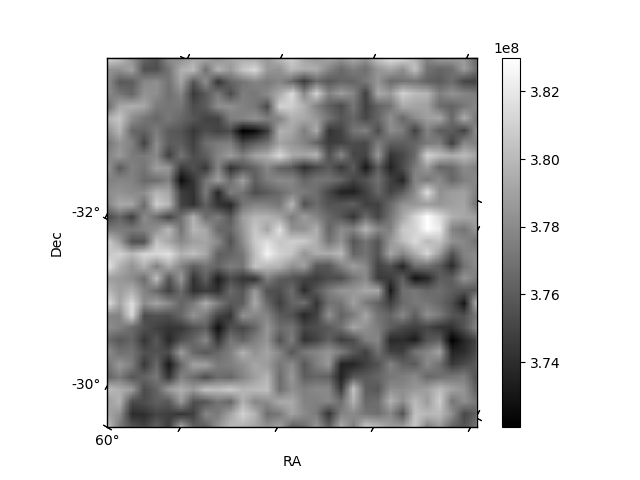
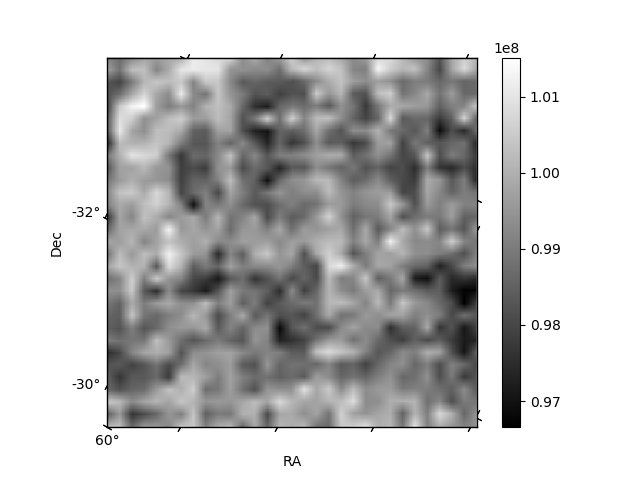
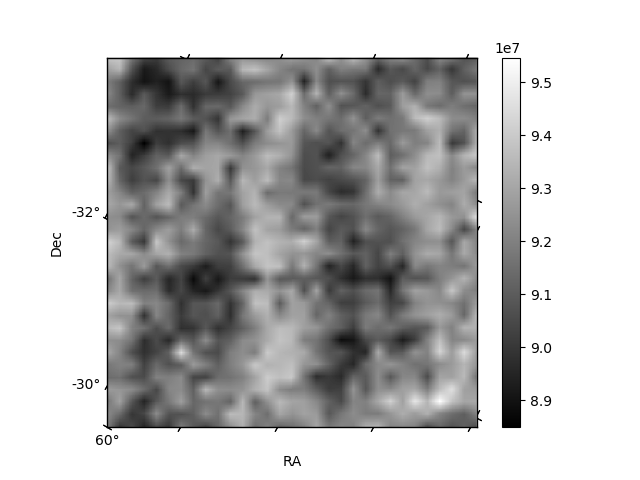
Histogram calculated using DETX and DETY for each event in the final _common_clean file
| Quadrant A | 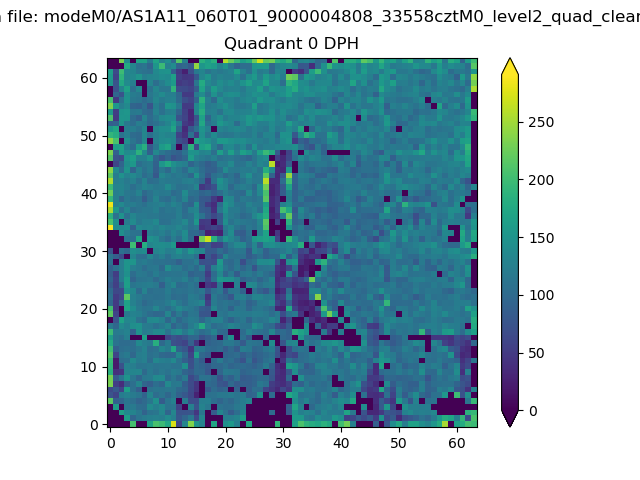 |
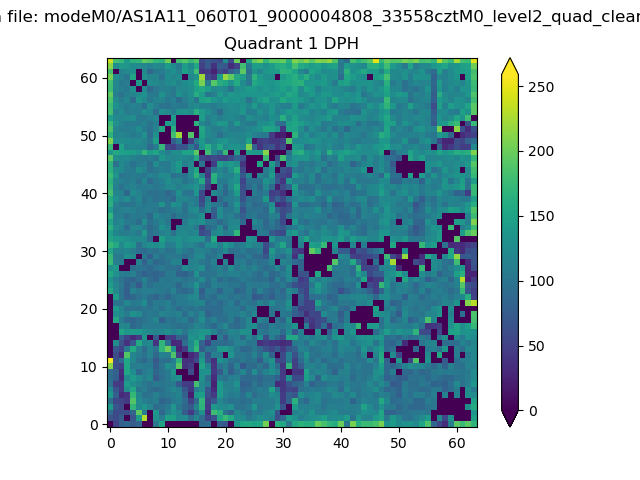 |
Quadrant B |
|---|---|---|---|
| Quadrant D | 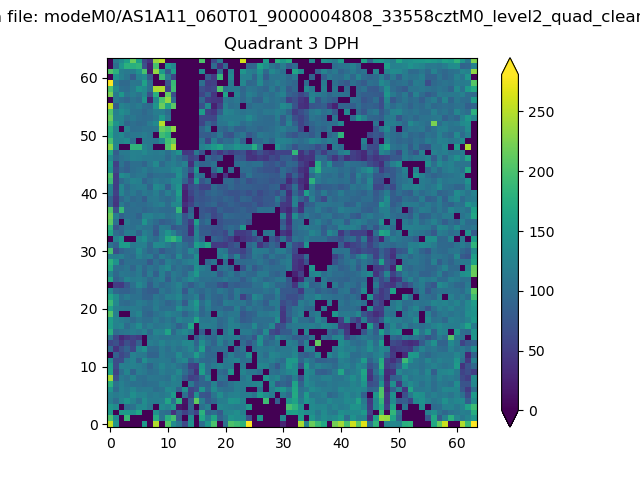 |
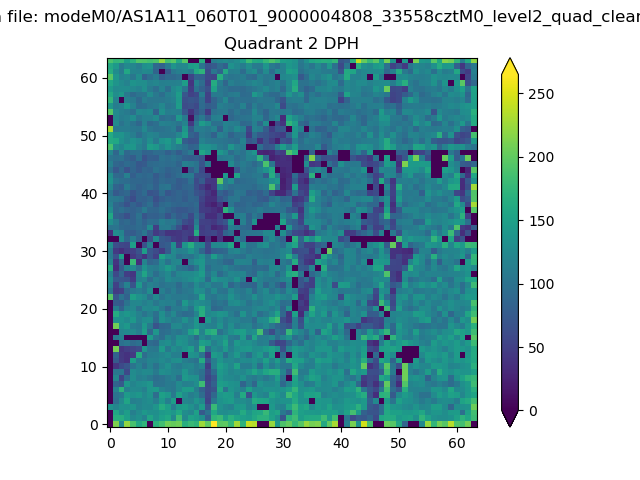 |
Quadrant C |
| Plot type | Count rate plots | Images |
|---|---|---|
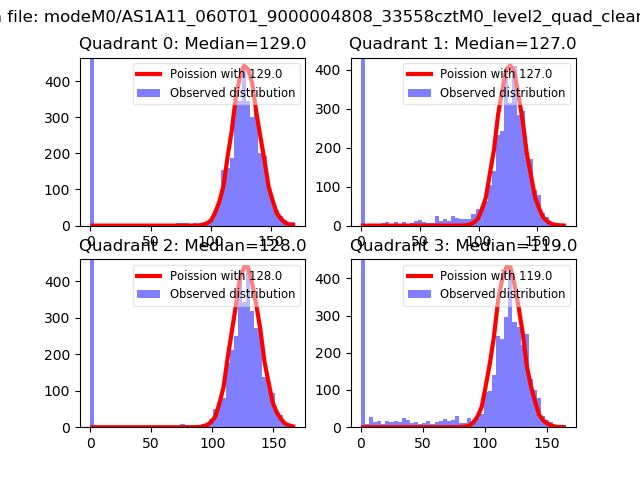
| Comparison with Poisson distribution Blue bars denote a histogram of data divided into 1 sec bins. Red curve is a Poisson curve with rate = median count rate of data. |
 |
 |
| Quadrant-wise count rates Data is divided into 100 sec bins |
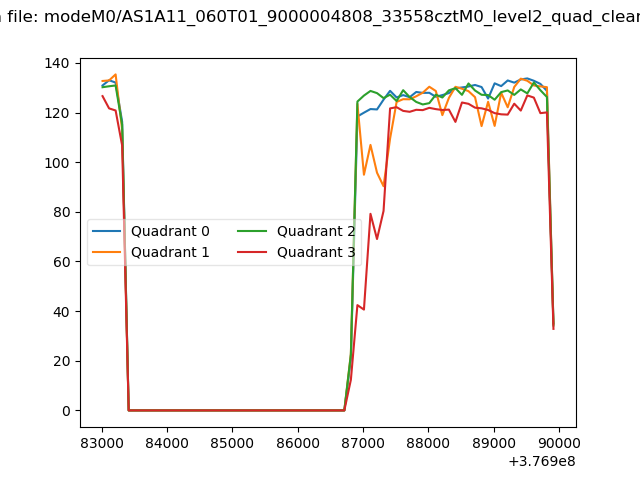 |
|
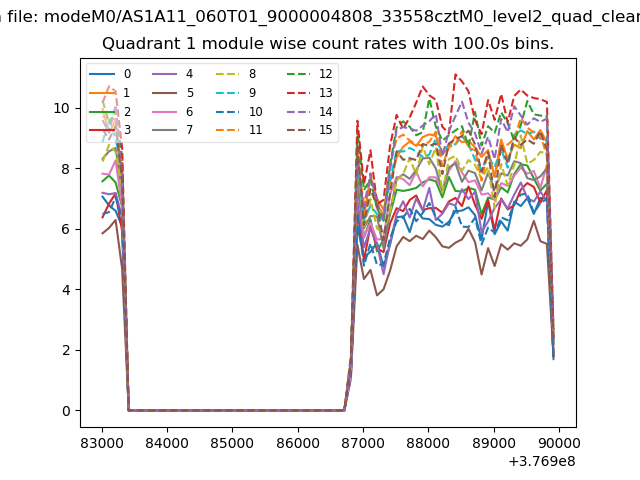
| Module-wise count rates for Quadrant A Data is divided into 100 sec bins |
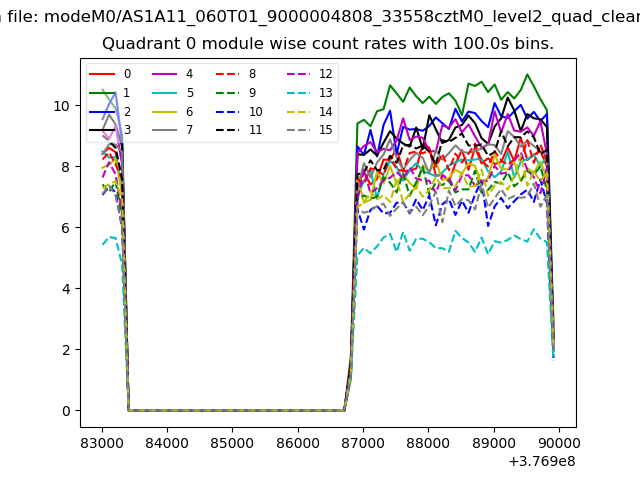 |
 |
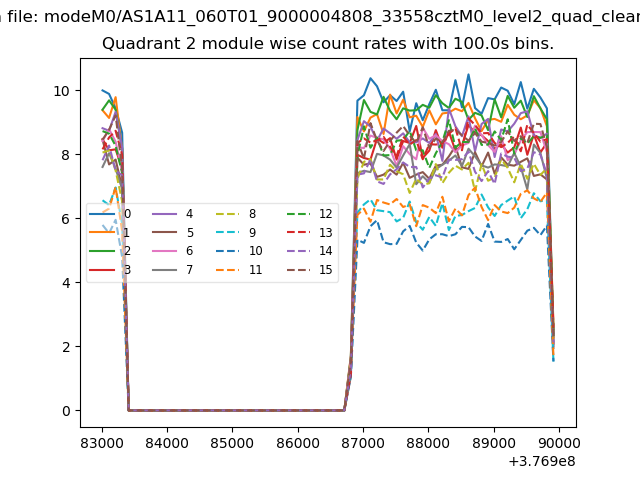
| Module-wise count rates for Quadrant B Data is divided into 100 sec bins |
 |
 |
| Module-wise count rates for Quadrant C Data is divided into 100 sec bins |
 |
 |
| Module-wise count rates for Quadrant D Data is divided into 100 sec bins |
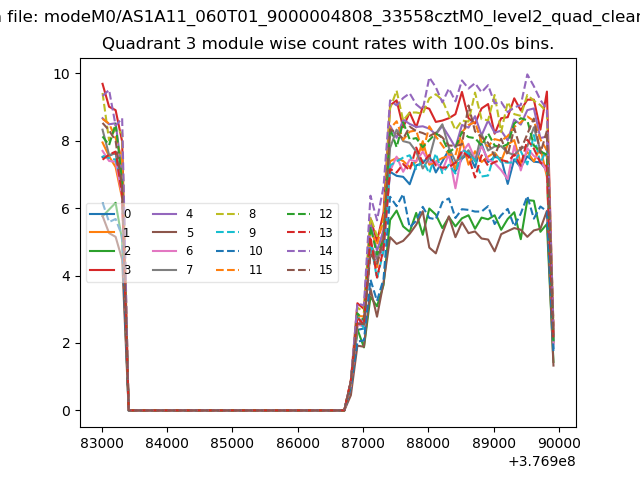 |
 |
| Parameter | Plot |
|---|---|
| CZT HV Monitor | 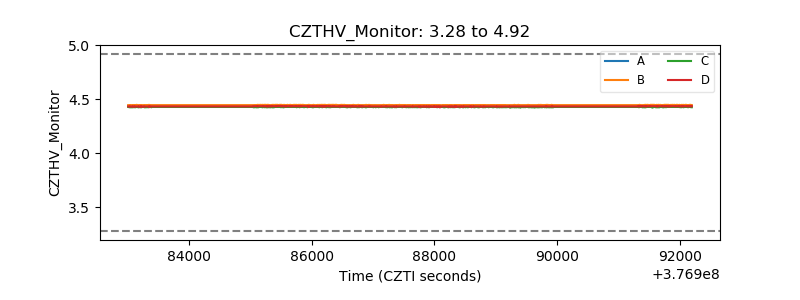 |
| D_VDD | 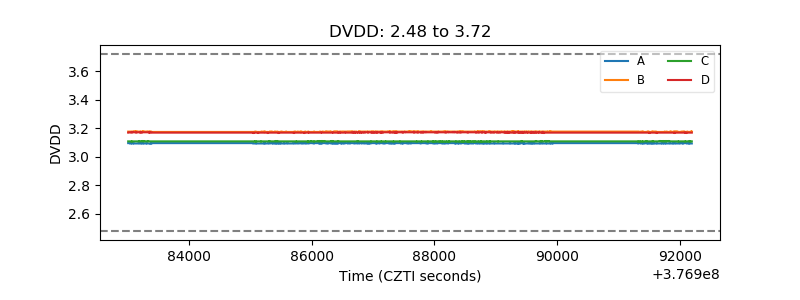 |
| Temperature 1 | 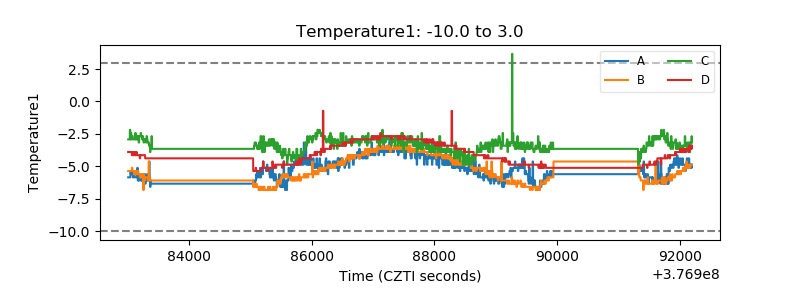 |
| Veto HV Monitor | 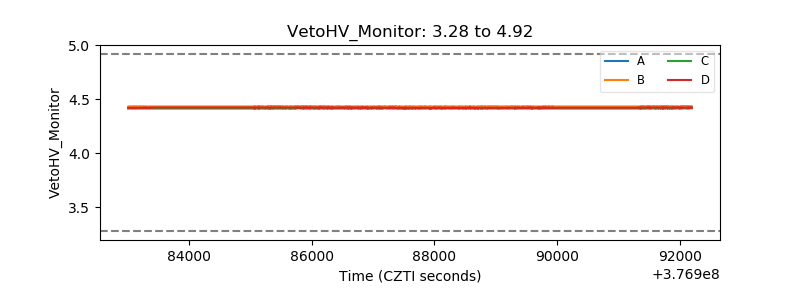 |
| Veto LLD | 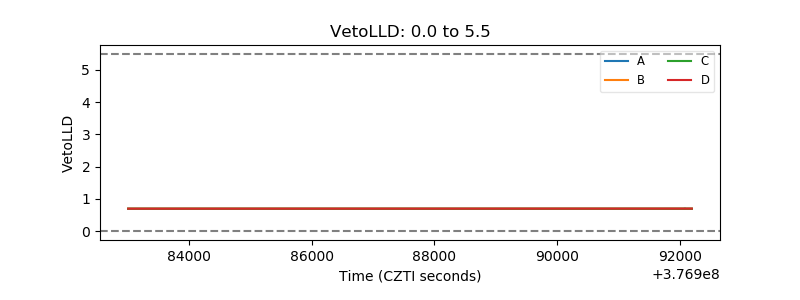 |
| Alpha Counter | 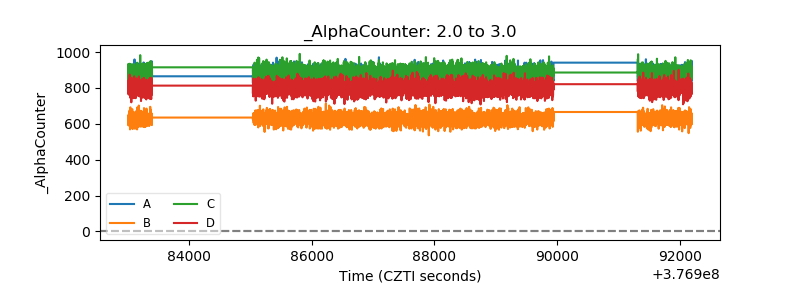 |
| _CPM_Rate | 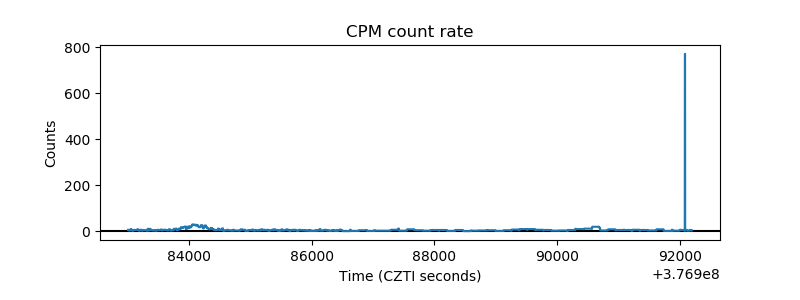 |
| CZT Counter | 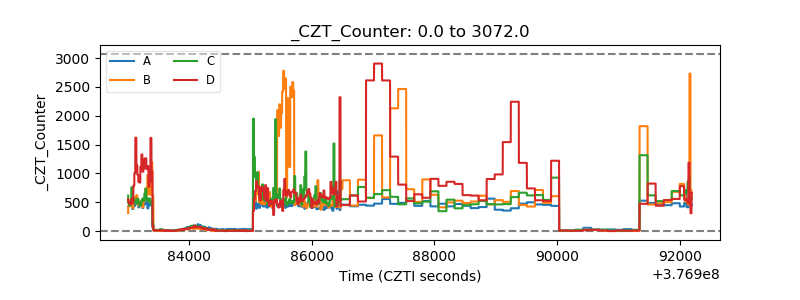 |
| +2.5 Volts monitor |  |
| +5 Volts monitor |  |
| _ROLL_ROT | 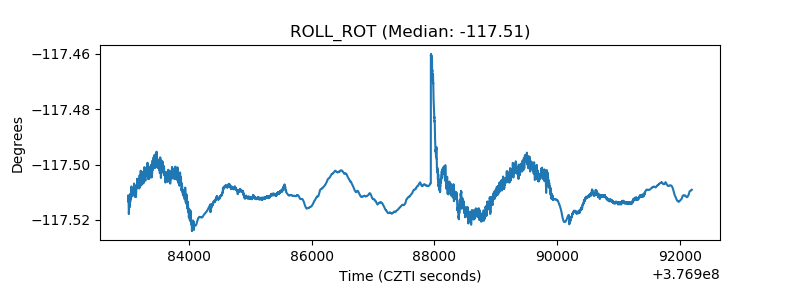 |
| _Roll_DEC | 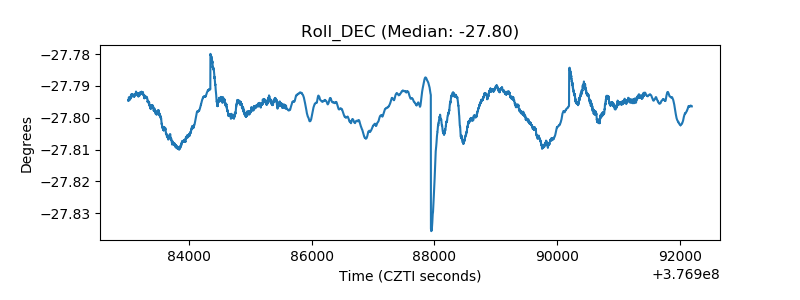 |
| _Roll_RA | 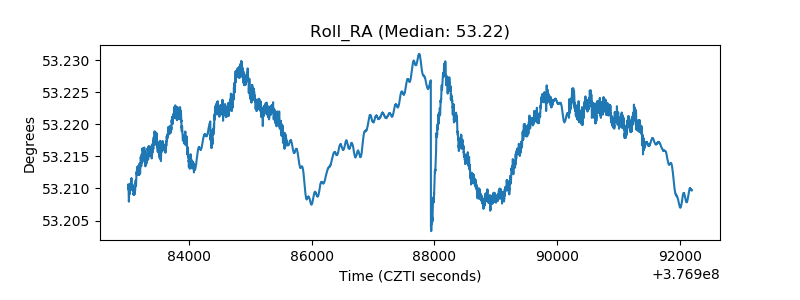 |
| Veto Counter | 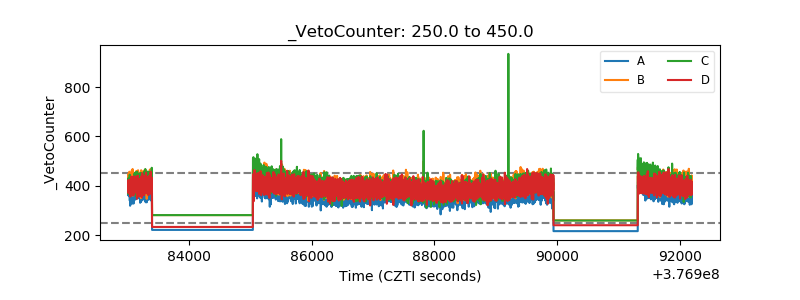 |