| Param | Original file | Final file |
|---|---|---|
| Filename | modeM0/AS1A11_060T01_9000004808_33559cztM0_level2.evt | modeM0/AS1A11_060T01_9000004808_33559cztM0_level2_quad_clean.evt |
| Size (bytes) | 543,312,000 | 72,023,040 |
| Size | 518.1 MB | 68.7 MB |
| Events in quadrant A | 2,719,791 | 453,763 |
| Events in quadrant B | 4,715,550 | 429,972 |
| Events in quadrant C | 3,935,233 | 448,291 |
| Events in quadrant D | 4,676,538 | 428,709 |
| Mode M0 | |||
|---|---|---|---|
| Quadrant | BADHDUFLAG | Total packets | Discarded packets |
| A | 0 | 12061 | 3 |
| B | 0 | 17817 | 2 |
| C | 0 | 15559 | 2 |
| D | 0 | 17921 | 2 |
| Mode M9 | |||
|---|---|---|---|
| Quadrant | BADHDUFLAG | Total packets | Discarded packets |
| A | 0 | 26 | 0 |
| B | 0 | 26 | 0 |
| C | 0 | 26 | 0 |
| D | 0 | 26 | 0 |
| Mode SS | |||
|---|---|---|---|
| Quadrant | BADHDUFLAG | Total packets | Discarded packets |
| A | 0 | 124 | 0 |
| B | 0 | 124 | 0 |
| C | 0 | 124 | 0 |
| D | 0 | 124 | 0 |
| Quadrant | Total seconds | Saturated seconds | Saturation percentage |
|---|---|---|---|
| A | 6013 | 5 | 0.083153% |
| B | 6013 | 614 | 10.211209% |
| C | 6013 | 87 | 1.446865% |
| D | 6013 | 99 | 1.646433% |
Noise dominated data is calculated using 1-second bins in cleaned event files. If a bin has >2000 counts, and if more than 50% of those come from <1% of pixels, then it is considered to be noise-dominated and hence unusable.
| Quadrant | # 1 sec bins | Bins with >0 counts | Bins with >2000 counts | High rate bins dominated by noise | Noise dominated (total time) | Noise dominated (detector-on time) | Marked lightcurve |
|---|---|---|---|---|---|---|---|
| A | 8669 | 6015 | 0 | 0 | 0.00% | 0.00% | 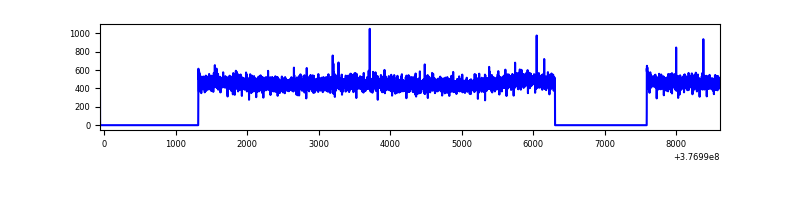 |
| B | 8669 | 6015 | 501 | 501 | 5.78% | 8.33% | 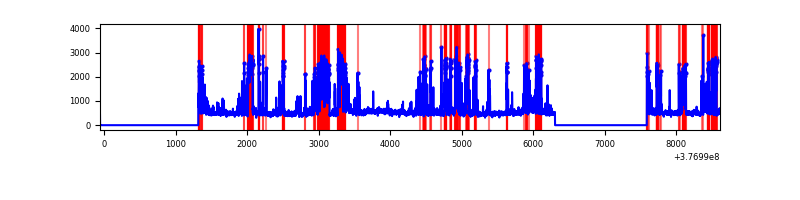 |
| C | 8669 | 6015 | 56 | 56 | 0.65% | 0.93% | 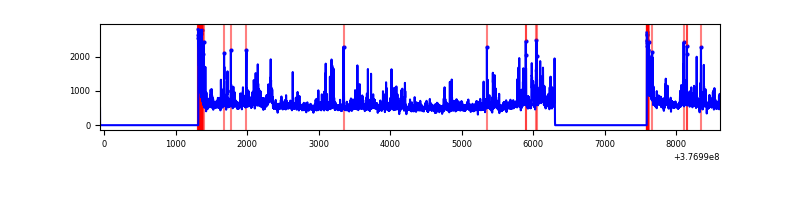 |
| D | 8669 | 6015 | 92 | 92 | 1.06% | 1.53% | 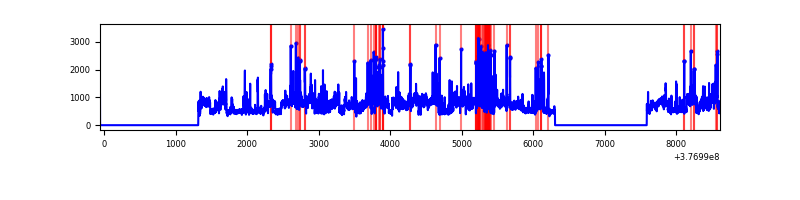 |
Top three noisy pixels from each quadrant. If the there are fewer than three noisy pixels in the level2.evt file, extra rows are filled as -1
| Pixel properties | Quadrant properties | ||||||
|---|---|---|---|---|---|---|---|
| Quadrant | DetID | PixID | Counts | Sigma | Mean | Median | Sigma |
| A | 13 | 254 | 9568 | 62.95 | 701 | 685 | 141.1 |
| A | 3 | 137 | 7235 | 46.42 | 701 | 685 | 141.1 |
| A | 10 | 83 | 6548 | 41.55 | 701 | 685 | 141.1 |
| B | 5 | 172 | 1701525 | 13159.95 | 666 | 649 | 129.2 |
| B | 4 | 251 | 265328 | 2047.86 | 666 | 649 | 129.2 |
| B | 5 | 255 | 59576 | 455.93 | 666 | 649 | 129.2 |
| C | 3 | 233 | 746250 | 4701.71 | 681 | 686 | 158.6 |
| C | 15 | 214 | 257190 | 1617.58 | 681 | 686 | 158.6 |
| C | 0 | 10 | 173967 | 1092.75 | 681 | 686 | 158.6 |
| D | 8 | 195 | 1314243 | 7818.97 | 681 | 661 | 168.0 |
| D | 2 | 250 | 233560 | 1386.31 | 681 | 661 | 168.0 |
| D | 15 | 0 | 196670 | 1166.72 | 681 | 661 | 168.0 |
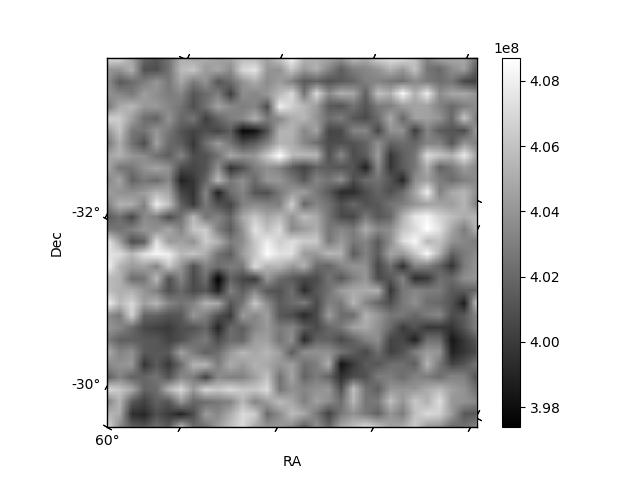
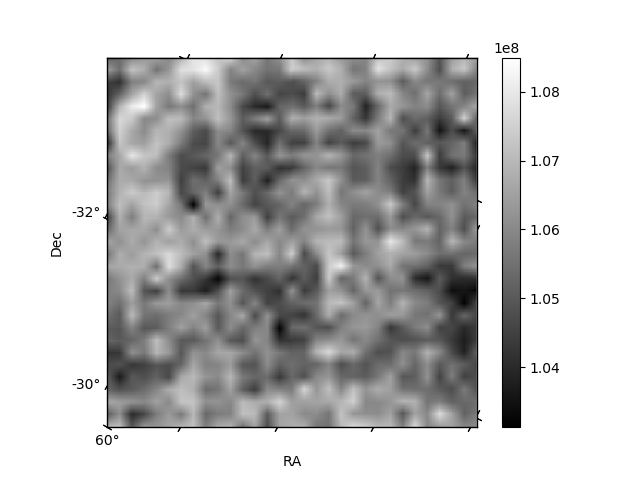
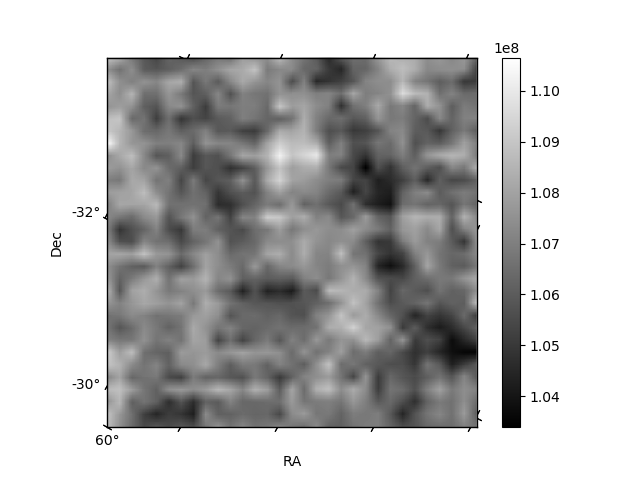
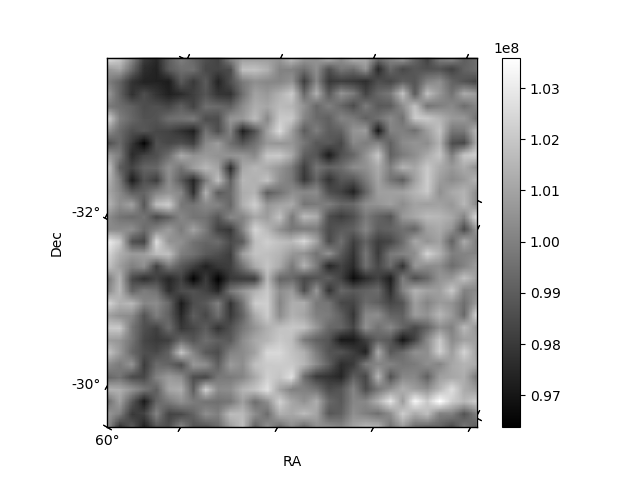
Histogram calculated using DETX and DETY for each event in the final _common_clean file
| Quadrant A | 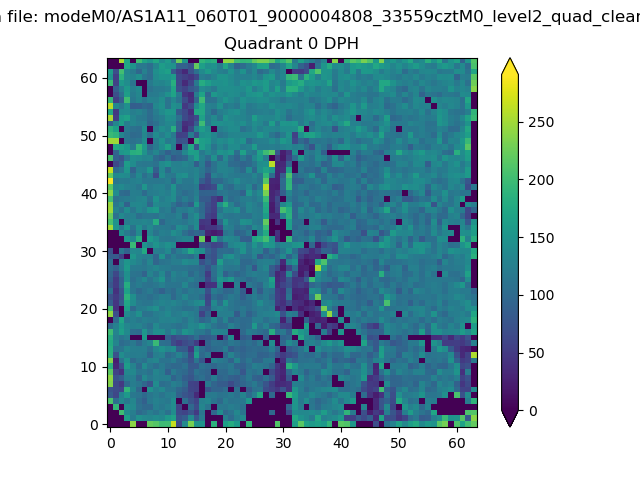 |
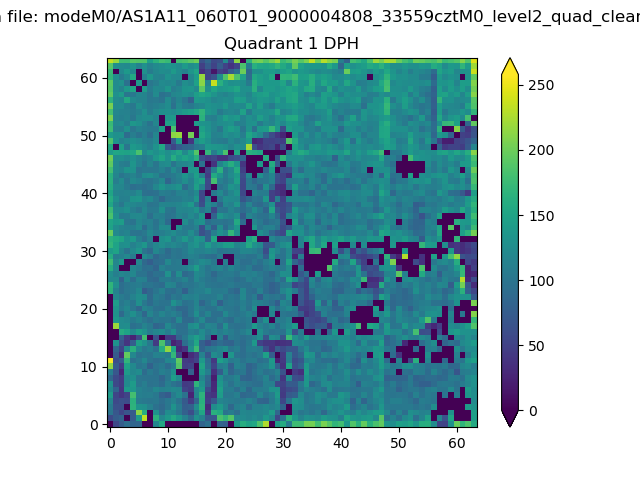 |
Quadrant B |
|---|---|---|---|
| Quadrant D | 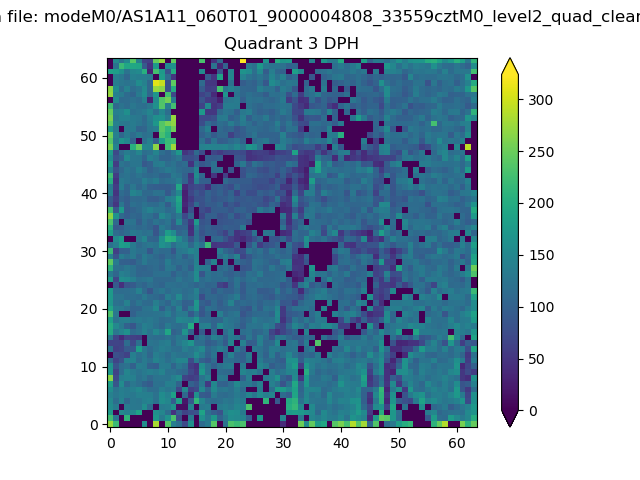 |
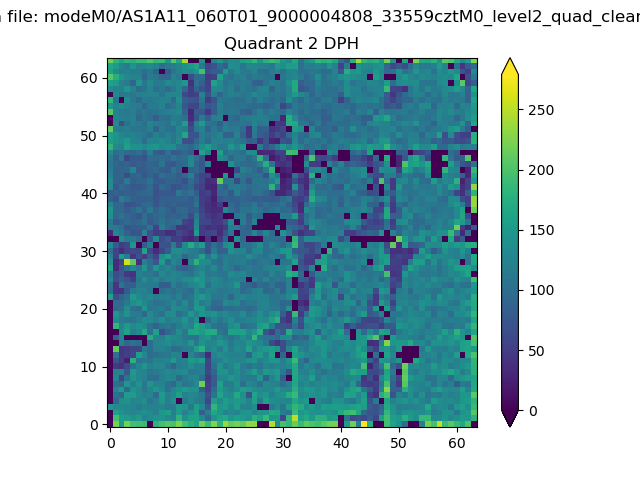 |
Quadrant C |
| Plot type | Count rate plots | Images |
|---|---|---|
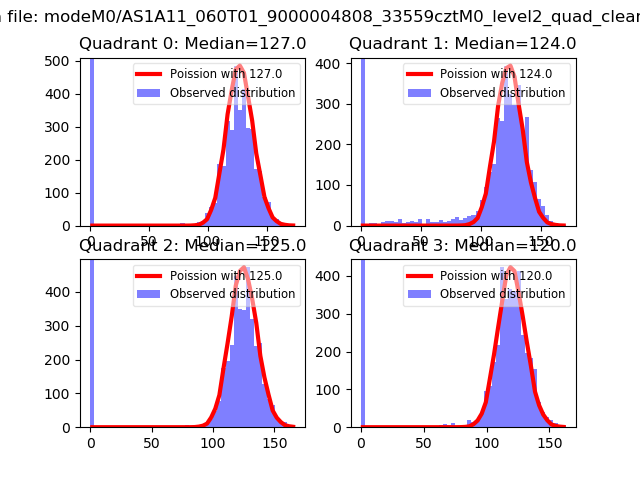
| Comparison with Poisson distribution Blue bars denote a histogram of data divided into 1 sec bins. Red curve is a Poisson curve with rate = median count rate of data. |
 |
 |
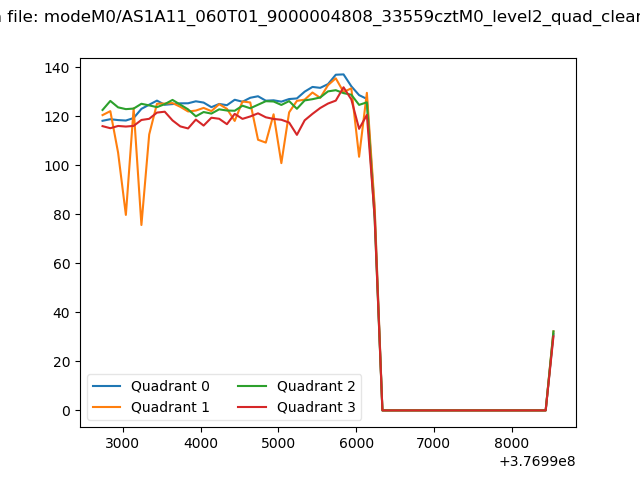
| Quadrant-wise count rates Data is divided into 100 sec bins |
 |
|
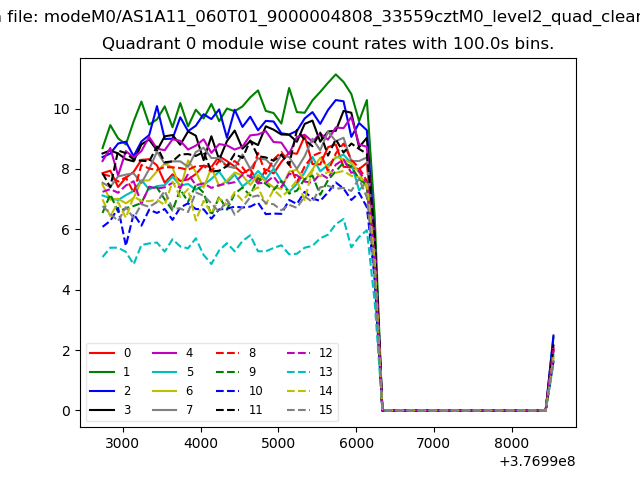
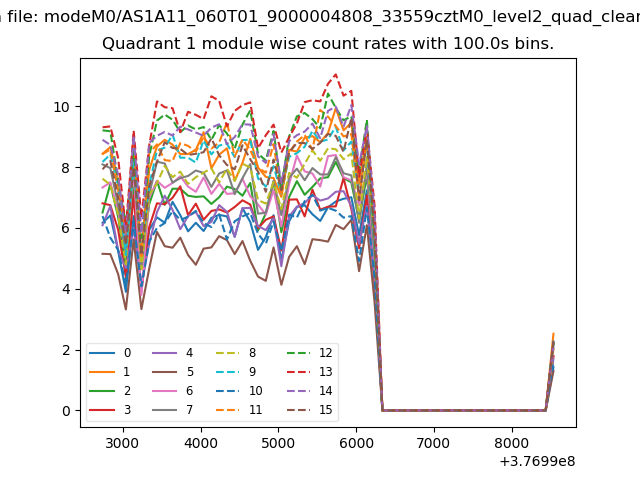
| Module-wise count rates for Quadrant A Data is divided into 100 sec bins |
 |
 |
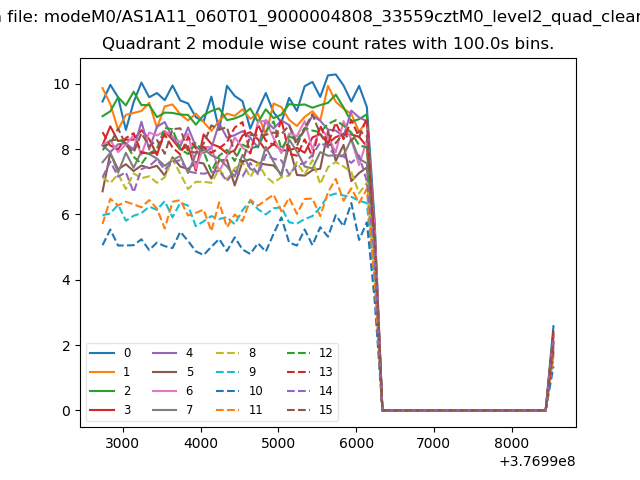
| Module-wise count rates for Quadrant B Data is divided into 100 sec bins |
 |
 |
| Module-wise count rates for Quadrant C Data is divided into 100 sec bins |
 |
 |
| Module-wise count rates for Quadrant D Data is divided into 100 sec bins |
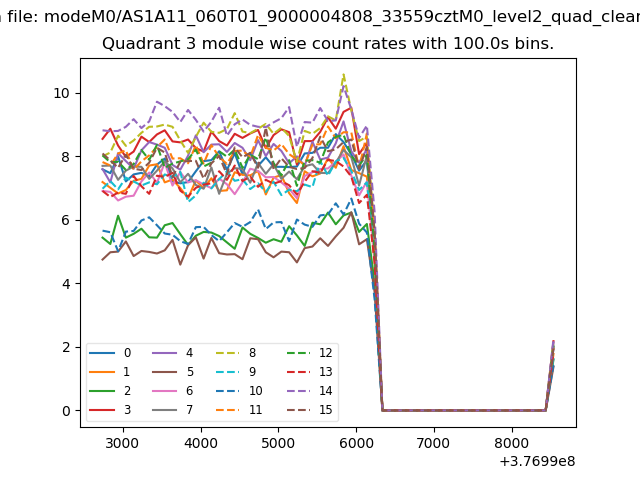 |
 |
| Parameter | Plot |
|---|---|
| CZT HV Monitor | 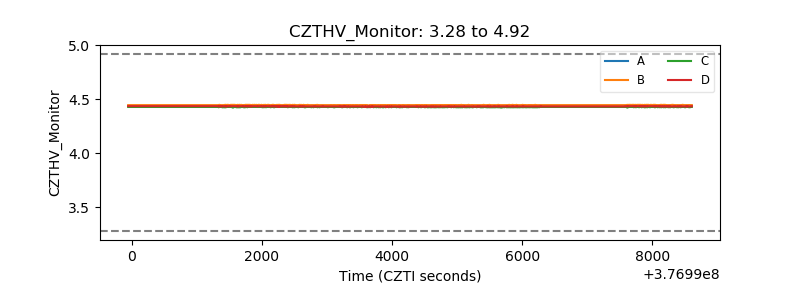 |
| D_VDD | 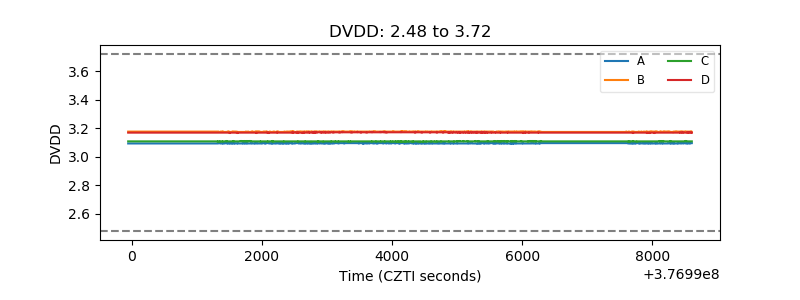 |
| Temperature 1 | 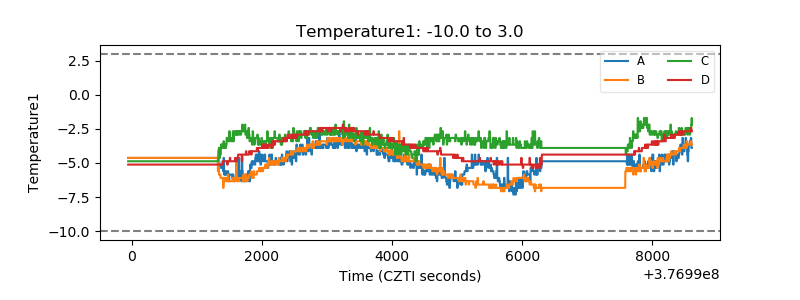 |
| Veto HV Monitor |  |
| Veto LLD | 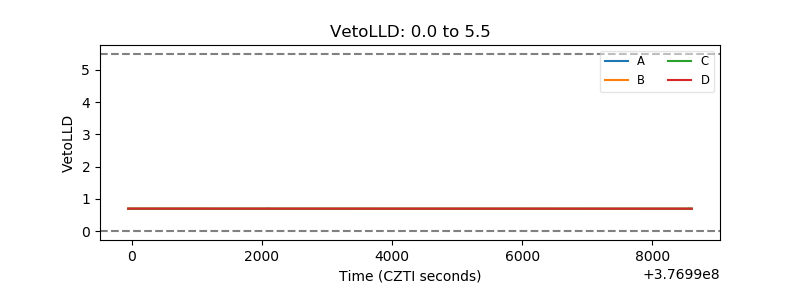 |
| Alpha Counter | 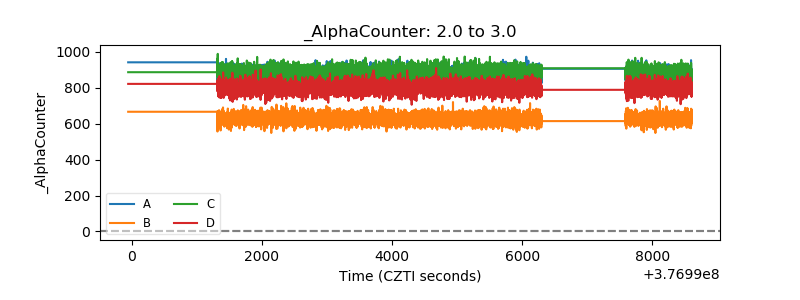 |
| _CPM_Rate | 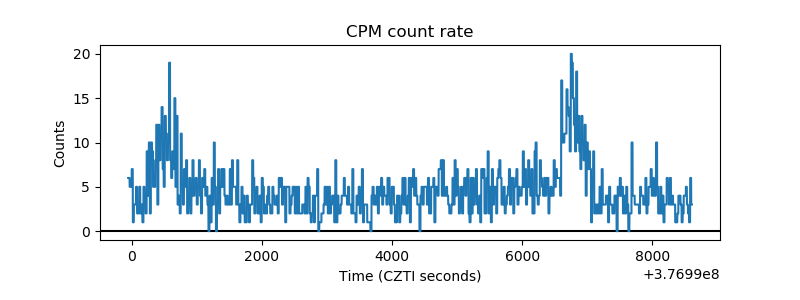 |
| CZT Counter | 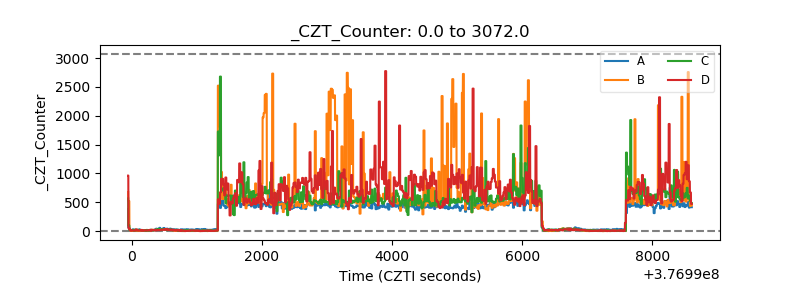 |
| +2.5 Volts monitor |  |
| +5 Volts monitor |  |
| _ROLL_ROT | 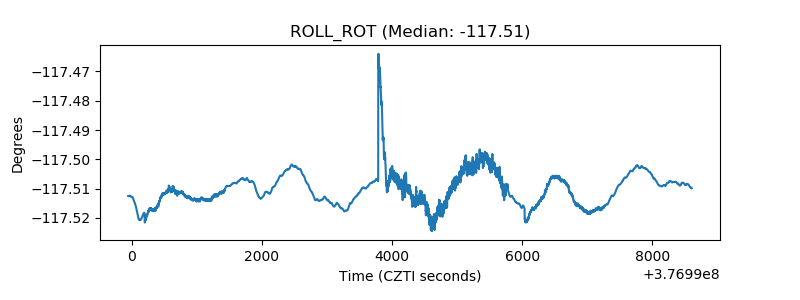 |
| _Roll_DEC | 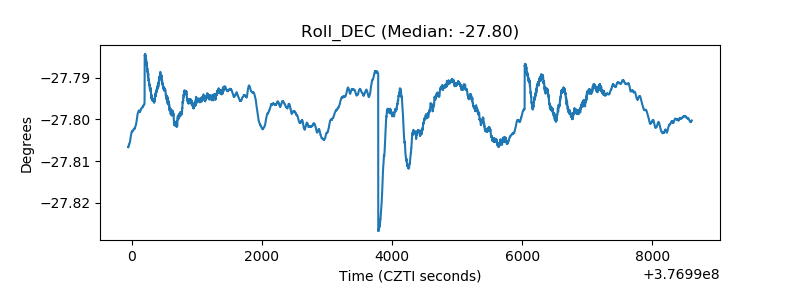 |
| _Roll_RA | 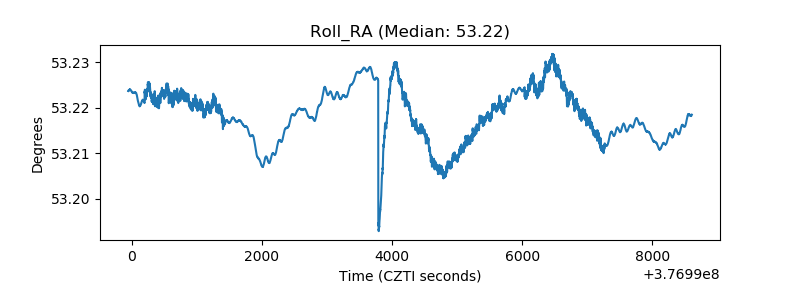 |
| Veto Counter | 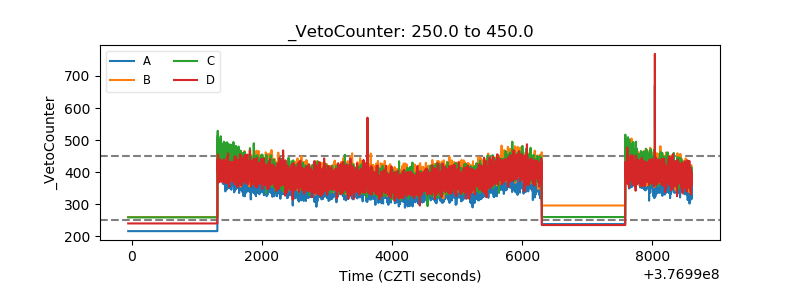 |