| Param | Original file | Final file |
|---|---|---|
| Filename | modeM0/AS1A11_060T01_9000004808_33562cztM0_level2.evt | modeM0/AS1A11_060T01_9000004808_33562cztM0_level2_quad_clean.evt |
| Size (bytes) | 1,852,096,320 | 233,415,360 |
| Size | 1.7 GB | 222.6 MB |
| Events in quadrant A | 8,741,948 | 1,550,602 |
| Events in quadrant B | 13,901,711 | 1,483,265 |
| Events in quadrant C | 13,704,637 | 1,526,958 |
| Events in quadrant D | 18,640,229 | 1,374,646 |
| Mode M0 | |||
|---|---|---|---|
| Quadrant | BADHDUFLAG | Total packets | Discarded packets |
| A | 0 | 37010 | 4 |
| B | 0 | 51962 | 3 |
| C | 0 | 52593 | 3 |
| D | 0 | 66765 | 3 |
| Mode M9 | |||
|---|---|---|---|
| Quadrant | BADHDUFLAG | Total packets | Discarded packets |
| A | 0 | 56 | 0 |
| B | 0 | 56 | 0 |
| C | 0 | 56 | 0 |
| D | 0 | 56 | 0 |
| Mode SS | |||
|---|---|---|---|
| Quadrant | BADHDUFLAG | Total packets | Discarded packets |
| A | 0 | 336 | 0 |
| B | 0 | 336 | 0 |
| C | 0 | 336 | 0 |
| D | 0 | 336 | 0 |
| Quadrant | Total seconds | Saturated seconds | Saturation percentage |
|---|---|---|---|
| A | 16418 | 603 | 3.672798% |
| B | 16418 | 2050 | 12.486296% |
| C | 16418 | 754 | 4.592520% |
| D | 16418 | 2623 | 15.976367% |
Noise dominated data is calculated using 1-second bins in cleaned event files. If a bin has >2000 counts, and if more than 50% of those come from <1% of pixels, then it is considered to be noise-dominated and hence unusable.
| Quadrant | # 1 sec bins | Bins with >0 counts | Bins with >2000 counts | High rate bins dominated by noise | Noise dominated (total time) | Noise dominated (detector-on time) | Marked lightcurve |
|---|---|---|---|---|---|---|---|
| A | 21938 | 16422 | 490 | 490 | 2.23% | 2.98% | 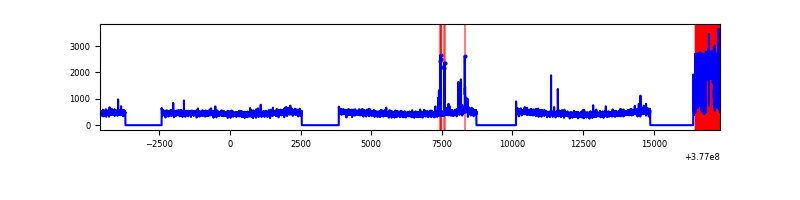 |
| B | 21938 | 16422 | 1725 | 1725 | 7.86% | 10.50% | 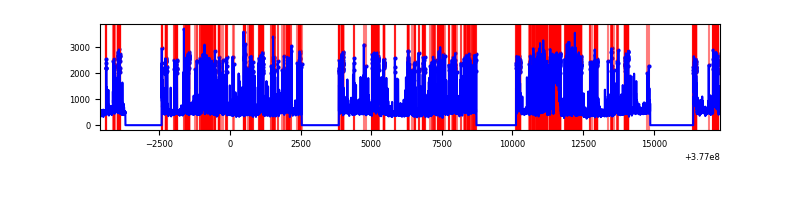 |
| C | 21938 | 16422 | 580 | 580 | 2.64% | 3.53% | 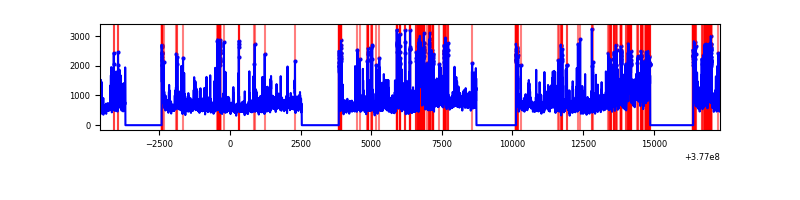 |
| D | 21938 | 16422 | 2526 | 2526 | 11.51% | 15.38% | 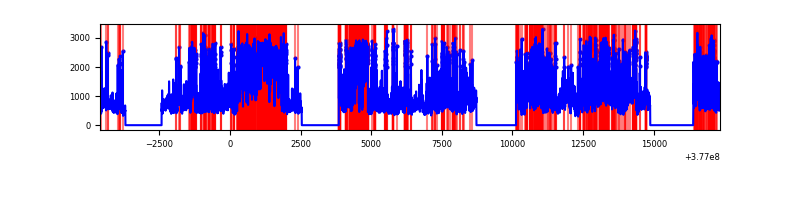 |
Top three noisy pixels from each quadrant. If the there are fewer than three noisy pixels in the level2.evt file, extra rows are filled as -1
| Pixel properties | Quadrant properties | ||||||
|---|---|---|---|---|---|---|---|
| Quadrant | DetID | PixID | Counts | Sigma | Mean | Median | Sigma |
| A | 15 | 169 | 1433129 | 3800.77 | 1887 | 1850 | 376.6 |
| A | 13 | 254 | 25967 | 64.04 | 1887 | 1850 | 376.6 |
| A | 3 | 137 | 19556 | 47.02 | 1887 | 1850 | 376.6 |
| B | 5 | 172 | 5424120 | 15495.9 | 1809 | 1761 | 349.9 |
| B | 4 | 251 | 488599 | 1391.28 | 1809 | 1761 | 349.9 |
| B | 5 | 255 | 432274 | 1230.31 | 1809 | 1761 | 349.9 |
| C | 3 | 233 | 5130566 | 12146.88 | 1835 | 1849 | 422.2 |
| C | 15 | 214 | 693355 | 1637.77 | 1835 | 1849 | 422.2 |
| C | 0 | 10 | 311691 | 733.83 | 1835 | 1849 | 422.2 |
| D | 2 | 120 | 4748158 | 11123.66 | 1749 | 1701 | 426.7 |
| D | 8 | 195 | 3221856 | 7546.66 | 1749 | 1701 | 426.7 |
| D | 15 | 0 | 1303334 | 3050.47 | 1749 | 1701 | 426.7 |
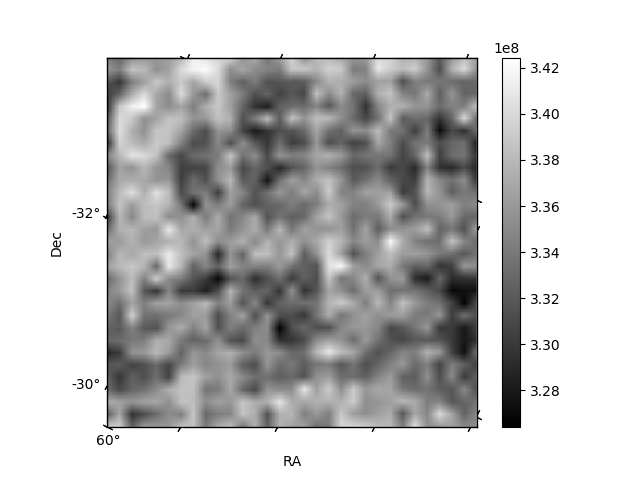
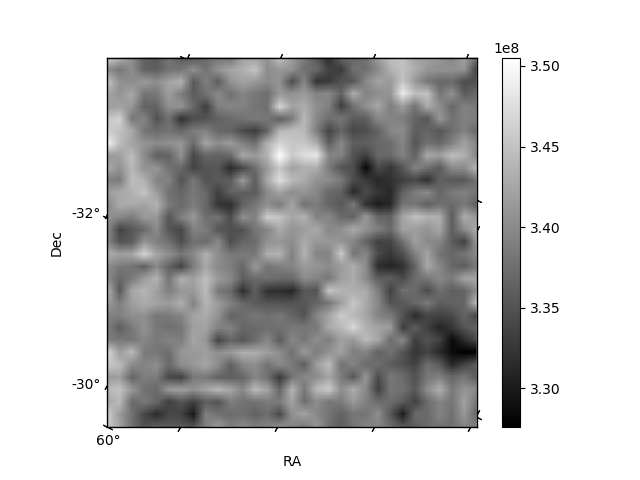
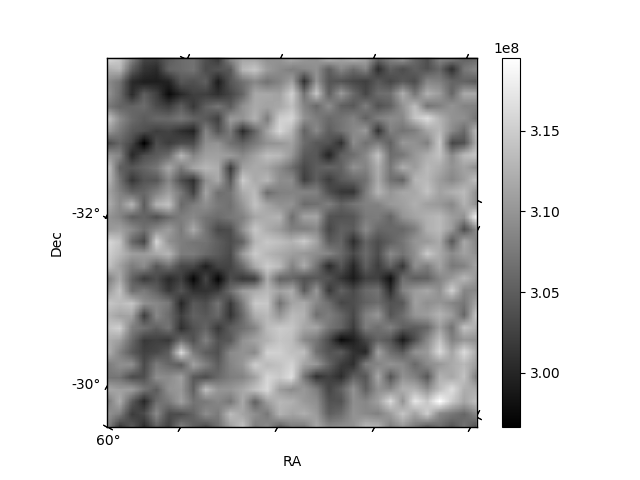
Histogram calculated using DETX and DETY for each event in the final _common_clean file
| Quadrant A | 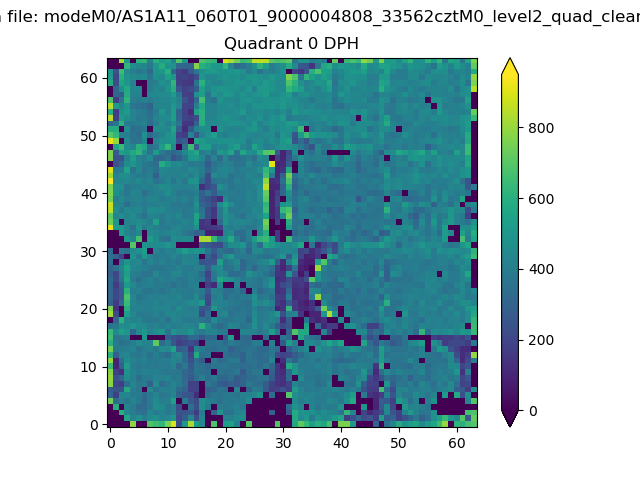 |
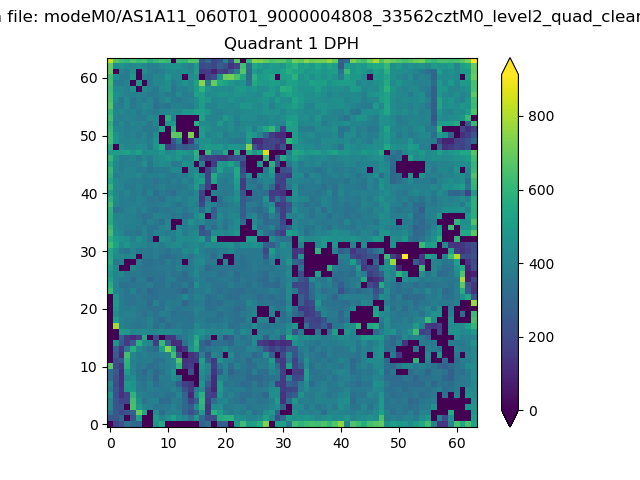 |
Quadrant B |
|---|---|---|---|
| Quadrant D | 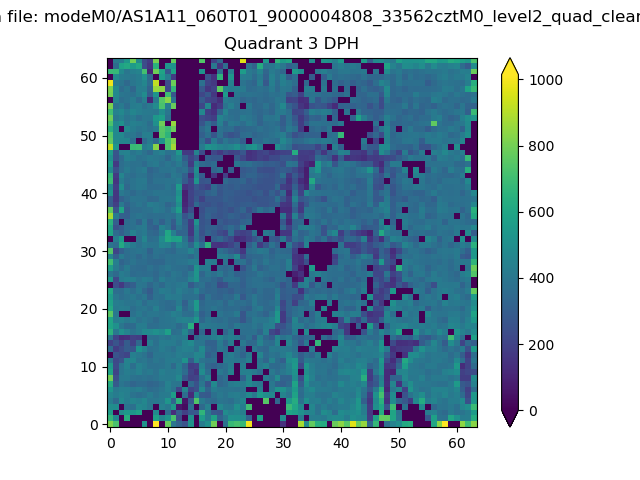 |
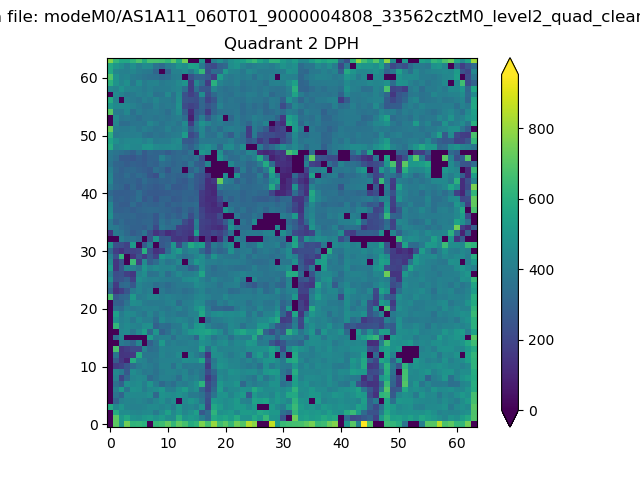 |
Quadrant C |
| Plot type | Count rate plots | Images |
|---|---|---|
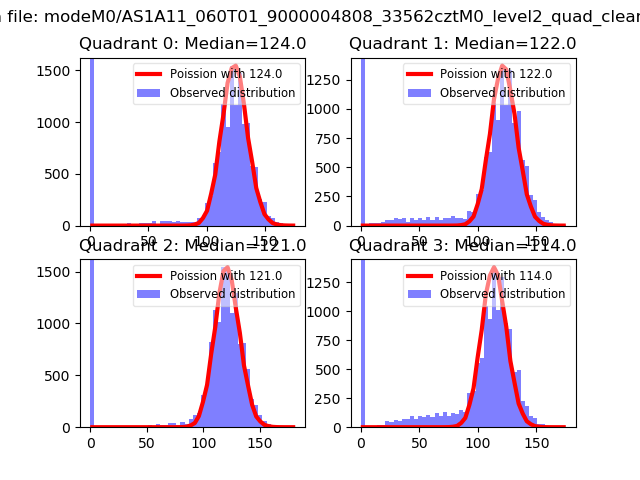
| Comparison with Poisson distribution Blue bars denote a histogram of data divided into 1 sec bins. Red curve is a Poisson curve with rate = median count rate of data. |
 |
 |
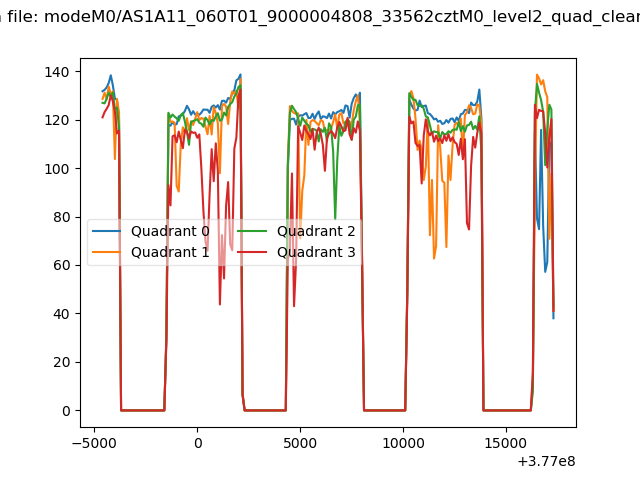
| Quadrant-wise count rates Data is divided into 100 sec bins |
 |
|
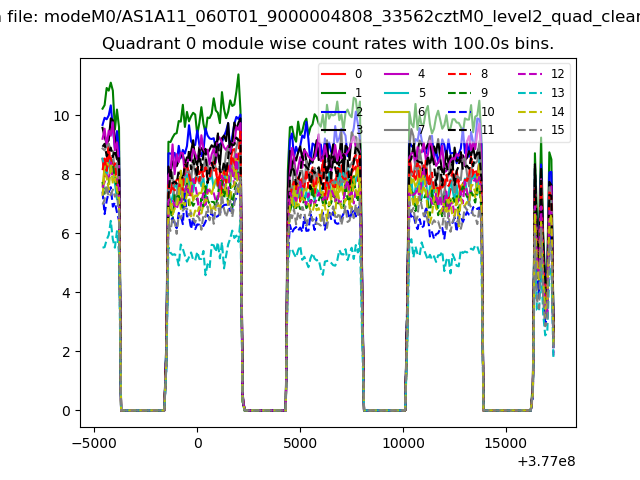
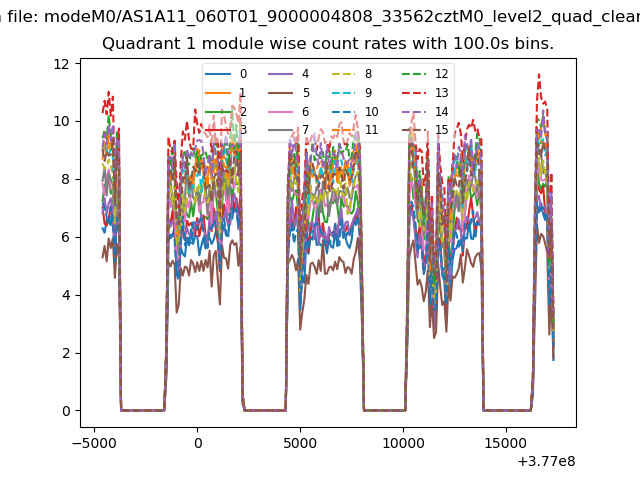
| Module-wise count rates for Quadrant A Data is divided into 100 sec bins |
 |
 |
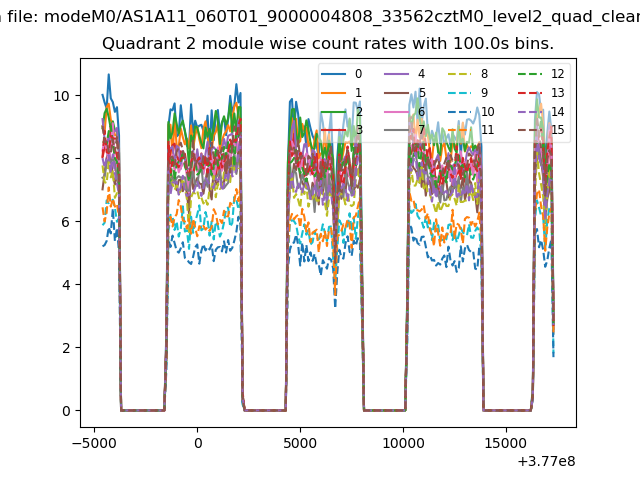
| Module-wise count rates for Quadrant B Data is divided into 100 sec bins |
 |
 |
| Module-wise count rates for Quadrant C Data is divided into 100 sec bins |
 |
 |
| Module-wise count rates for Quadrant D Data is divided into 100 sec bins |
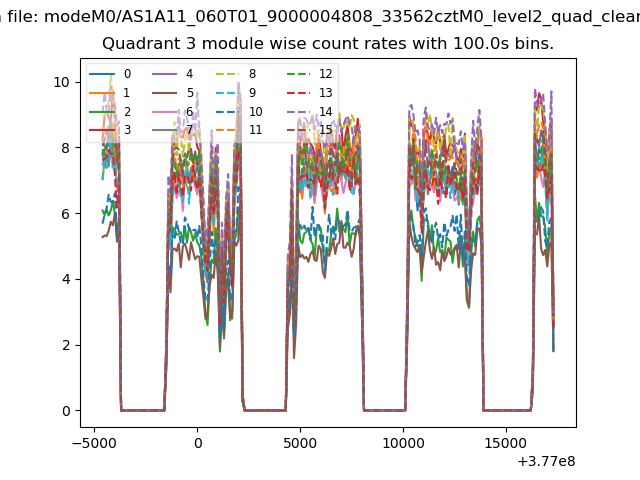 |
 |
| Parameter | Plot |
|---|---|
| CZT HV Monitor | 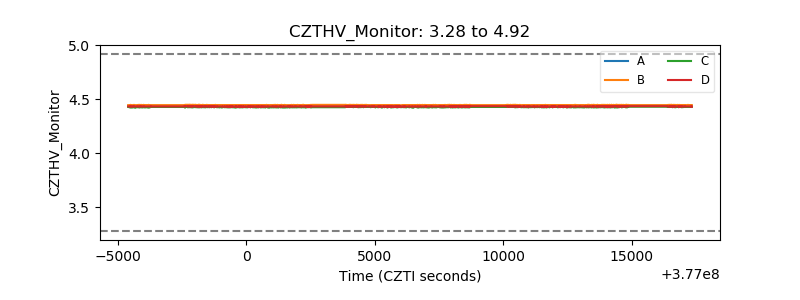 |
| D_VDD | 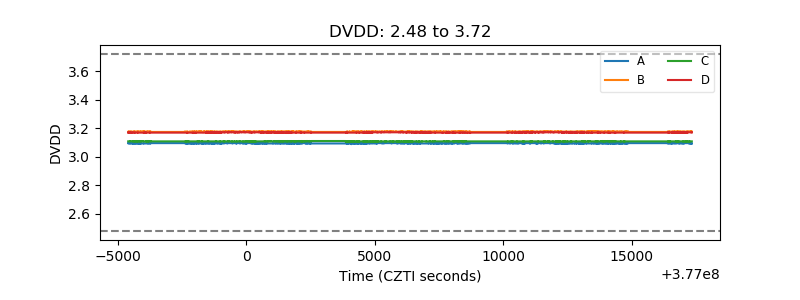 |
| Temperature 1 | 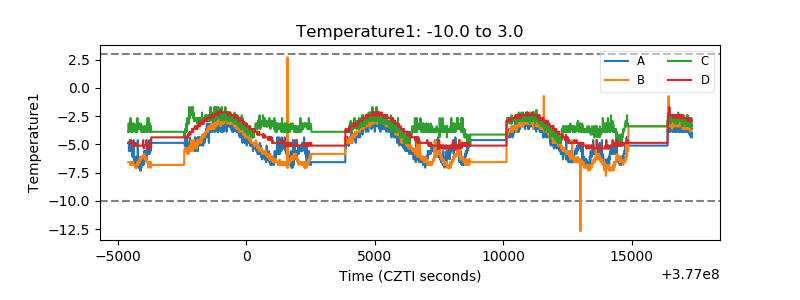 |
| Veto HV Monitor |  |
| Veto LLD | 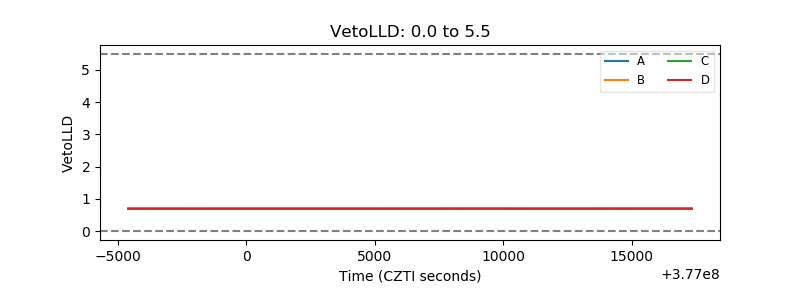 |
| Alpha Counter | 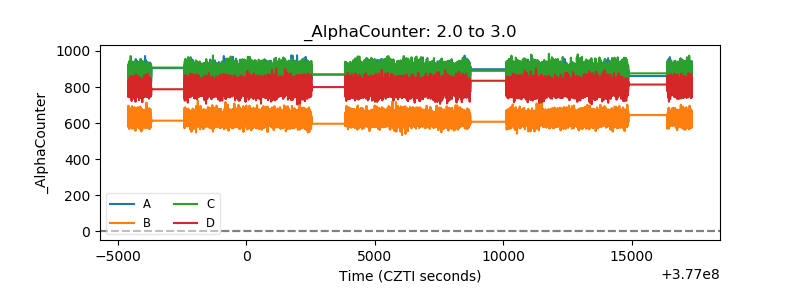 |
| _CPM_Rate | 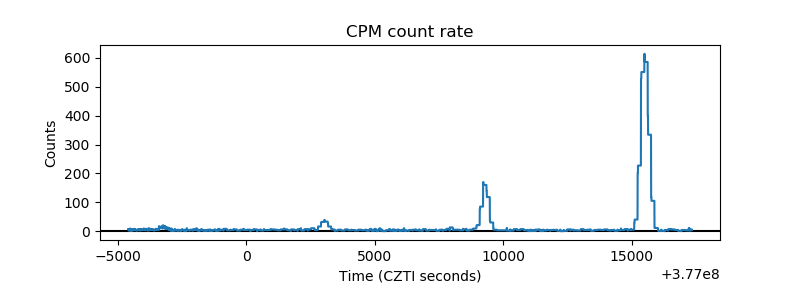 |
| CZT Counter | 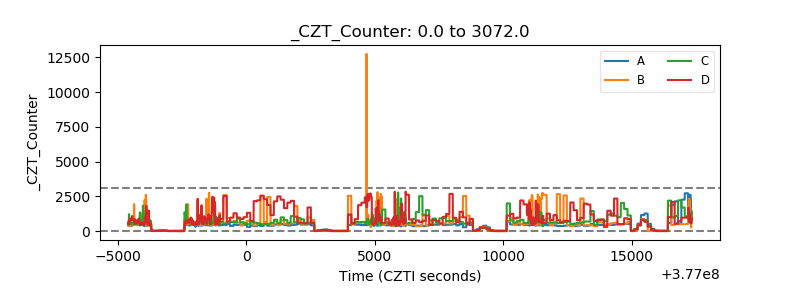 |
| +2.5 Volts monitor |  |
| +5 Volts monitor | 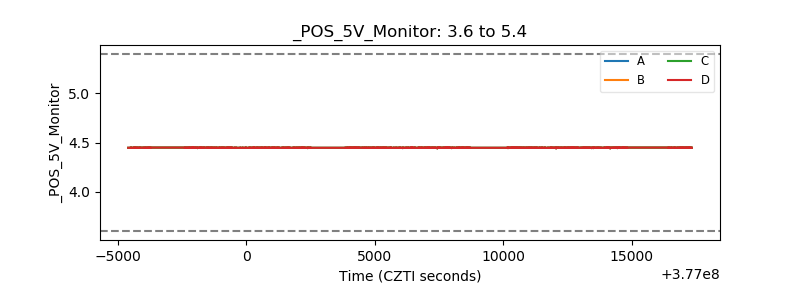 |
| _ROLL_ROT | 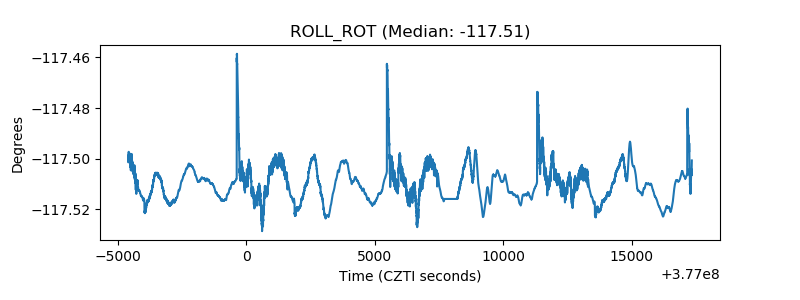 |
| _Roll_DEC | 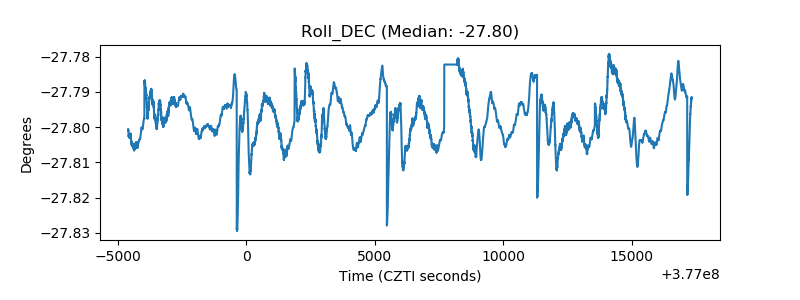 |
| _Roll_RA | 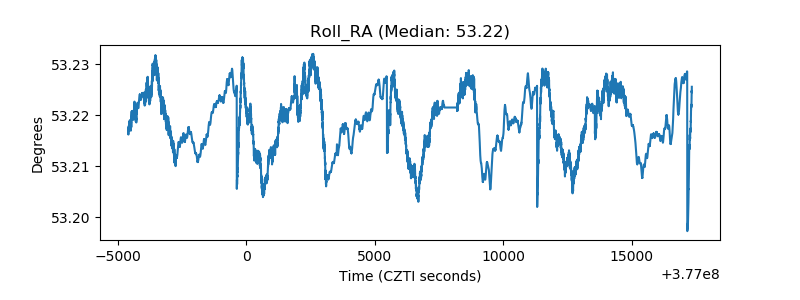 |
| Veto Counter | 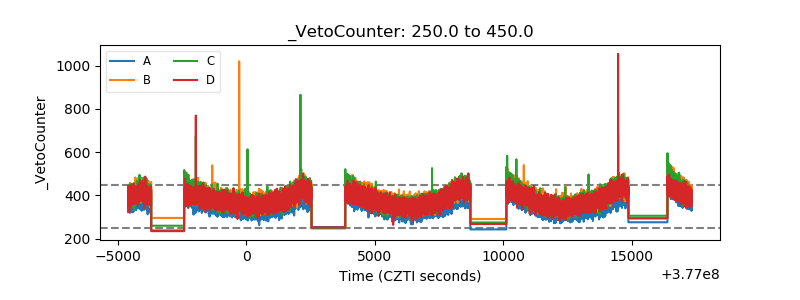 |