| Param | Original file | Final file |
|---|---|---|
| Filename | modeM0/AS1A11_060T01_9000004808_33563cztM0_level2.evt | modeM0/AS1A11_060T01_9000004808_33563cztM0_level2_quad_clean.evt |
| Size (bytes) | 634,357,440 | 59,503,680 |
| Size | 605.0 MB | 56.7 MB |
| Events in quadrant A | 5,345,587 | 334,601 |
| Events in quadrant B | 3,635,361 | 388,161 |
| Events in quadrant C | 5,215,017 | 387,331 |
| Events in quadrant D | 4,706,721 | 368,628 |
| Mode M0 | |||
|---|---|---|---|
| Quadrant | BADHDUFLAG | Total packets | Discarded packets |
| A | 0 | 18899 | 0 |
| B | 0 | 13751 | 0 |
| C | 0 | 18805 | 0 |
| D | 0 | 17165 | 0 |
| Mode M9 | |||
|---|---|---|---|
| Quadrant | BADHDUFLAG | Total packets | Discarded packets |
| A | 0 | 7 | 0 |
| B | 0 | 6 | 0 |
| C | 0 | 6 | 0 |
| D | 0 | 6 | 0 |
| Mode SS | |||
|---|---|---|---|
| Quadrant | BADHDUFLAG | Total packets | Discarded packets |
| A | 0 | 92 | 0 |
| B | 0 | 92 | 0 |
| C | 0 | 92 | 0 |
| D | 0 | 92 | 0 |
| Quadrant | Total seconds | Saturated seconds | Saturation percentage |
|---|---|---|---|
| A | 4586 | 1142 | 24.901875% |
| B | 4586 | 481 | 10.488443% |
| C | 4586 | 594 | 12.952464% |
| D | 4586 | 370 | 8.068033% |
Noise dominated data is calculated using 1-second bins in cleaned event files. If a bin has >2000 counts, and if more than 50% of those come from <1% of pixels, then it is considered to be noise-dominated and hence unusable.
| Quadrant | # 1 sec bins | Bins with >0 counts | Bins with >2000 counts | High rate bins dominated by noise | Noise dominated (total time) | Noise dominated (detector-on time) | Marked lightcurve |
|---|---|---|---|---|---|---|---|
| A | 4586 | 4586 | 1057 | 1057 | 23.05% | 23.05% | 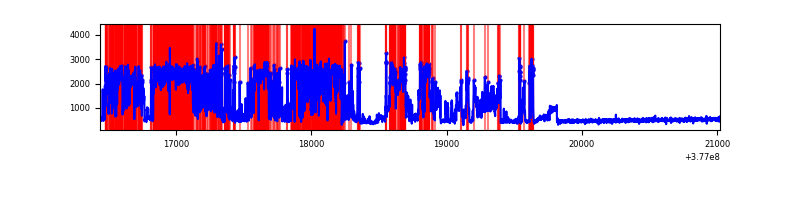 |
| B | 4586 | 4586 | 404 | 404 | 8.81% | 8.81% | 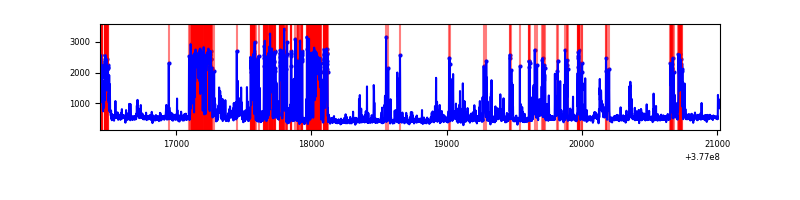 |
| C | 4586 | 4586 | 488 | 488 | 10.64% | 10.64% | 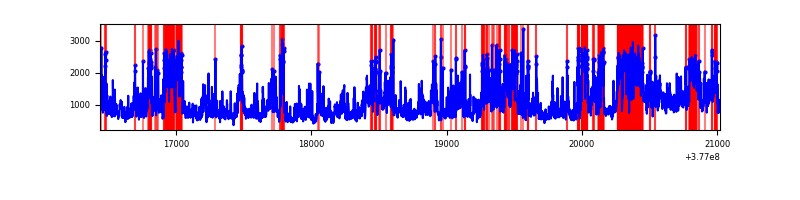 |
| D | 4586 | 4586 | 412 | 412 | 8.98% | 8.98% | 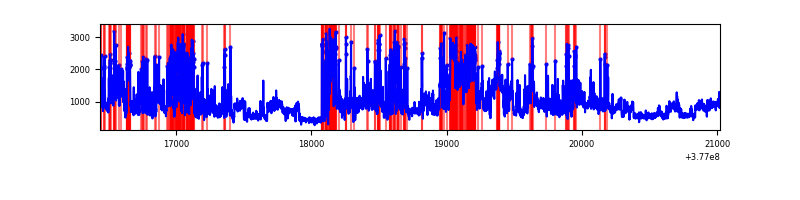 |
Top three noisy pixels from each quadrant. If the there are fewer than three noisy pixels in the level2.evt file, extra rows are filled as -1
| Pixel properties | Quadrant properties | ||||||
|---|---|---|---|---|---|---|---|
| Quadrant | DetID | PixID | Counts | Sigma | Mean | Median | Sigma |
| A | 15 | 169 | 3519952 | 36556.25 | 470 | 461 | 96.3 |
| A | 10 | 248 | 7248 | 70.5 | 470 | 461 | 96.3 |
| A | 13 | 254 | 6919 | 67.08 | 470 | 461 | 96.3 |
| B | 5 | 172 | 1413778 | 14342.3 | 507 | 495 | 98.5 |
| B | 5 | 255 | 123446 | 1247.73 | 507 | 495 | 98.5 |
| B | 4 | 251 | 41605 | 417.19 | 507 | 495 | 98.5 |
| C | 3 | 233 | 2884482 | 25060.17 | 489 | 492 | 115.1 |
| C | 15 | 214 | 185733 | 1609.63 | 489 | 492 | 115.1 |
| C | 14 | 254 | 175551 | 1521.16 | 489 | 492 | 115.1 |
| D | 8 | 195 | 792375 | 6481.91 | 501 | 488 | 122.2 |
| D | 1 | 47 | 768128 | 6283.44 | 501 | 488 | 122.2 |
| D | 2 | 250 | 377594 | 3086.76 | 501 | 488 | 122.2 |
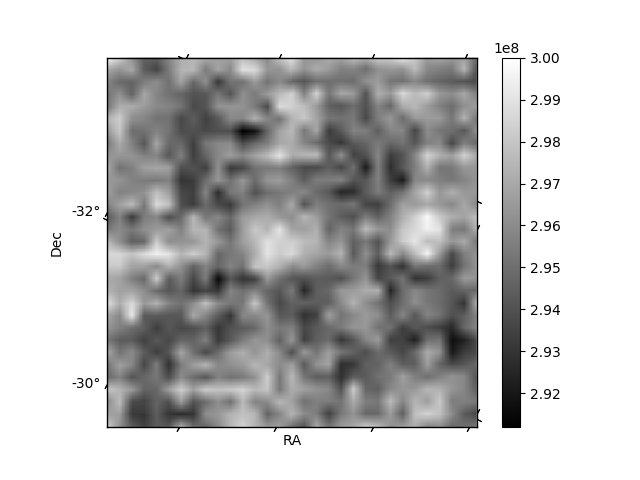
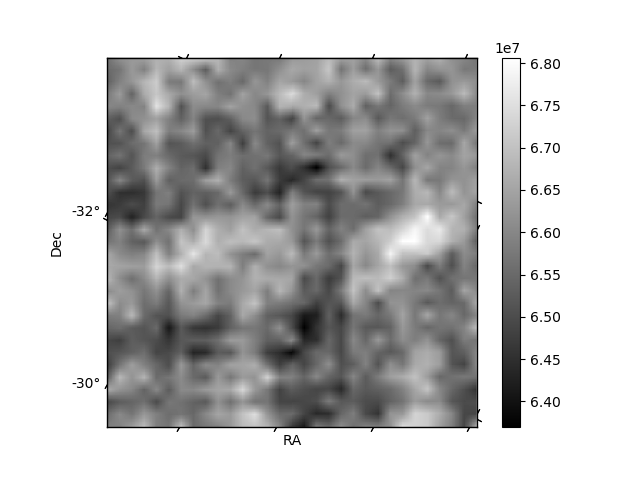
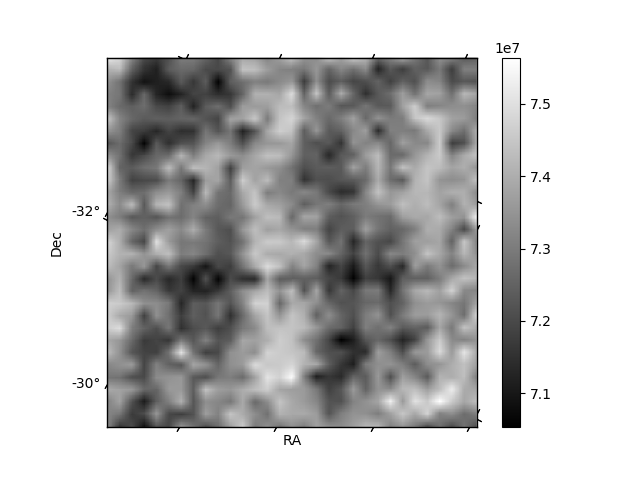
Histogram calculated using DETX and DETY for each event in the final _common_clean file
| Quadrant A | 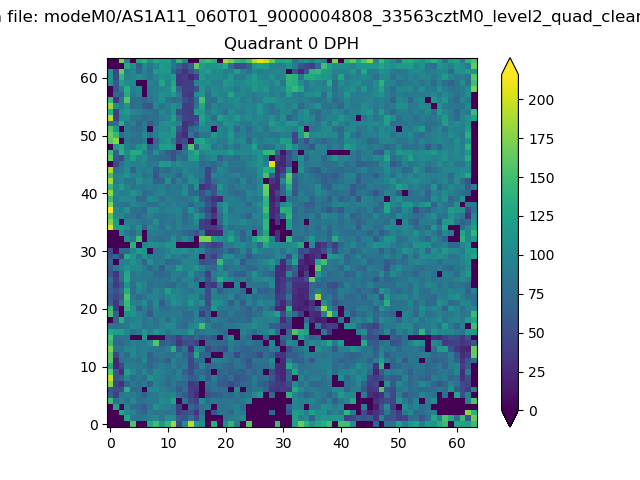 |
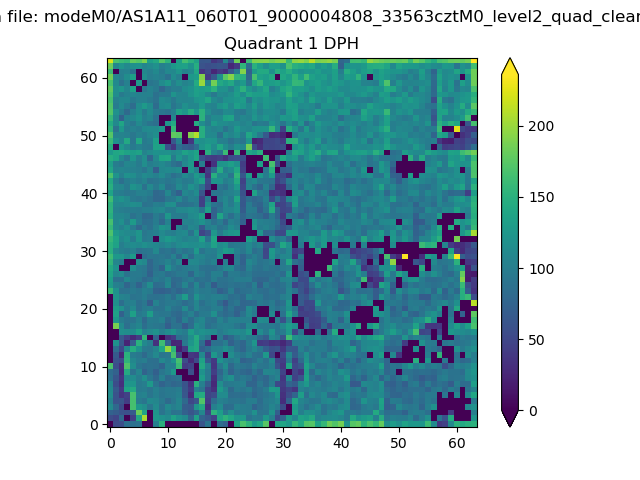 |
Quadrant B |
|---|---|---|---|
| Quadrant D | 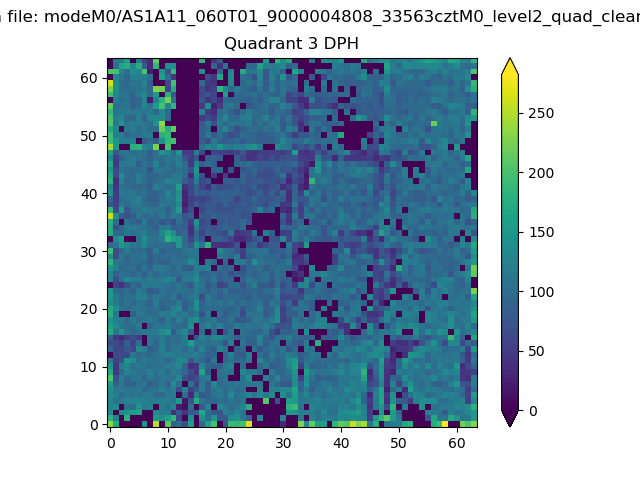 |
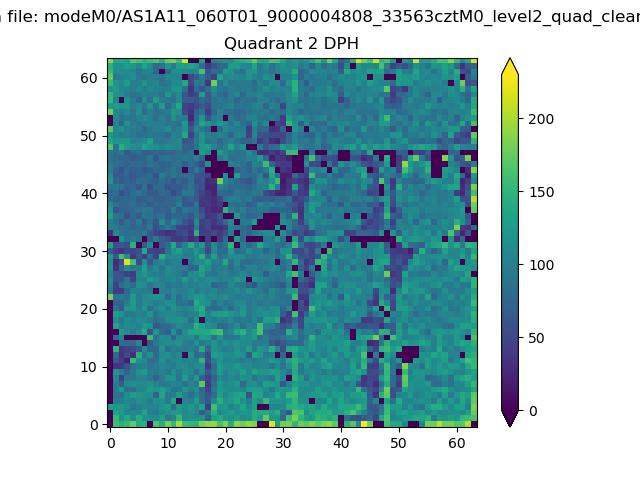 |
Quadrant C |
| Plot type | Count rate plots | Images |
|---|---|---|
| Comparison with Poisson distribution Blue bars denote a histogram of data divided into 1 sec bins. Red curve is a Poisson curve with rate = median count rate of data. |
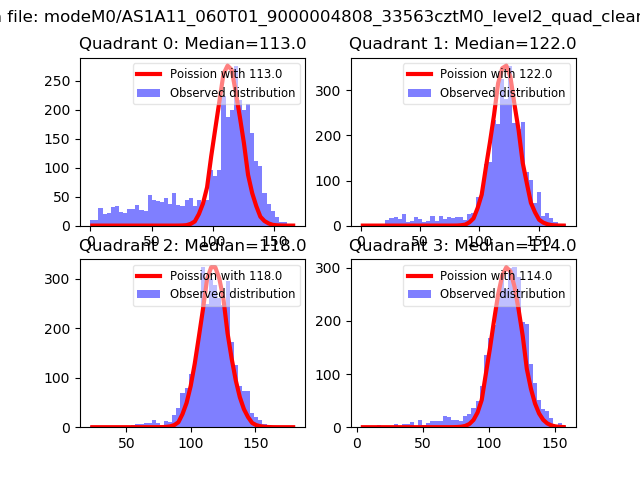 |
 |
| Quadrant-wise count rates Data is divided into 100 sec bins |
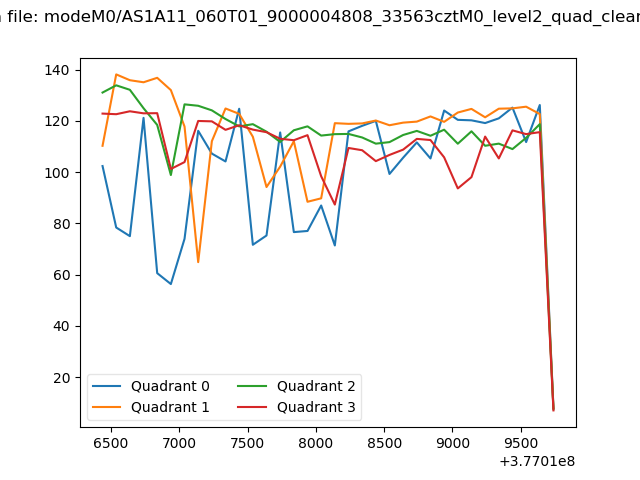 |
|
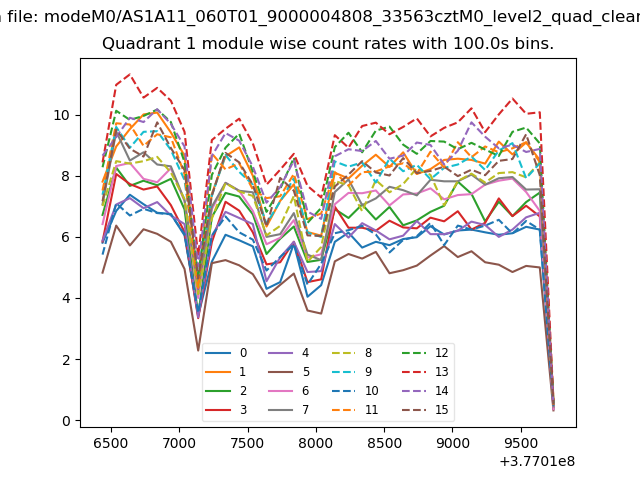
| Module-wise count rates for Quadrant A Data is divided into 100 sec bins |
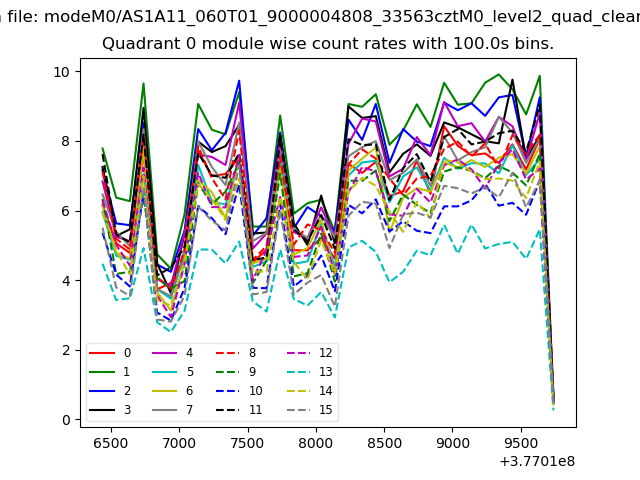 |
 |
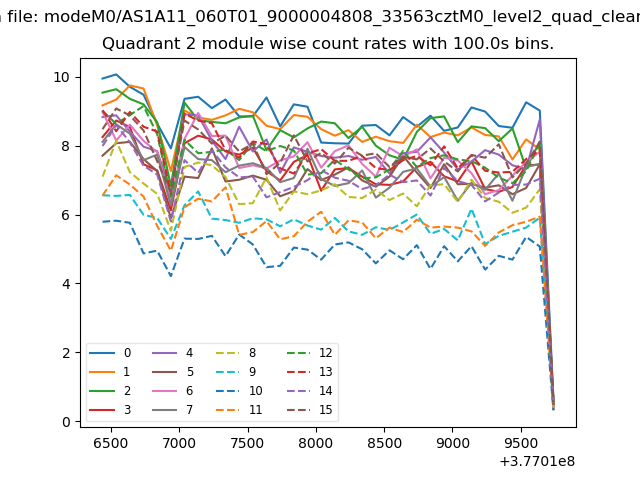
| Module-wise count rates for Quadrant B Data is divided into 100 sec bins |
 |
 |
| Module-wise count rates for Quadrant C Data is divided into 100 sec bins |
 |
 |
| Module-wise count rates for Quadrant D Data is divided into 100 sec bins |
 |
 |
| Parameter | Plot |
|---|---|
| CZT HV Monitor |  |
| D_VDD | 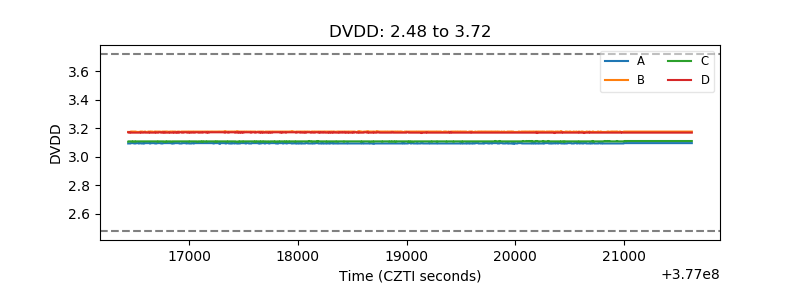 |
| Temperature 1 |  |
| Veto HV Monitor | 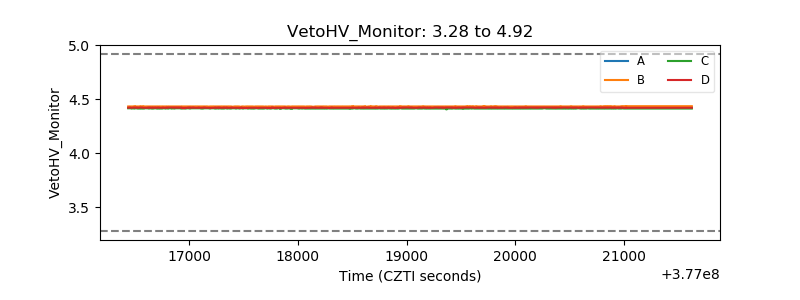 |
| Veto LLD | 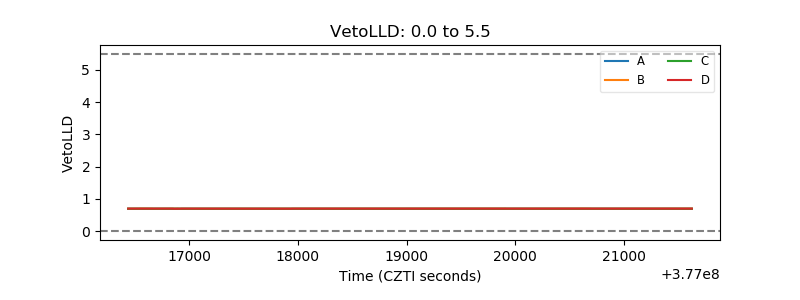 |
| Alpha Counter | 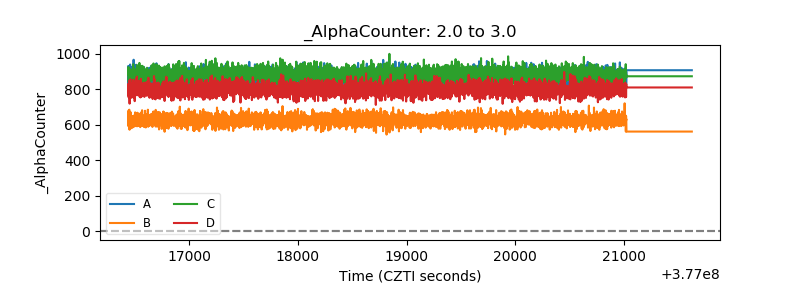 |
| _CPM_Rate | 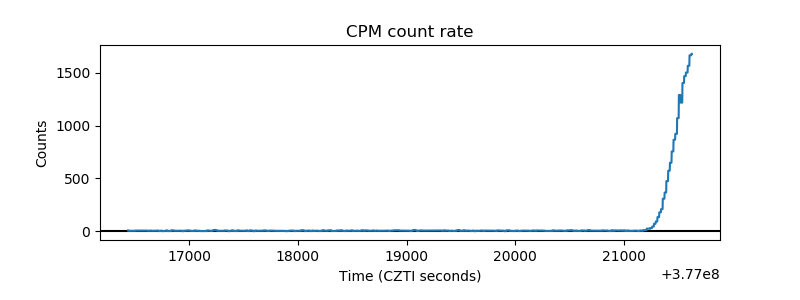 |
| CZT Counter | 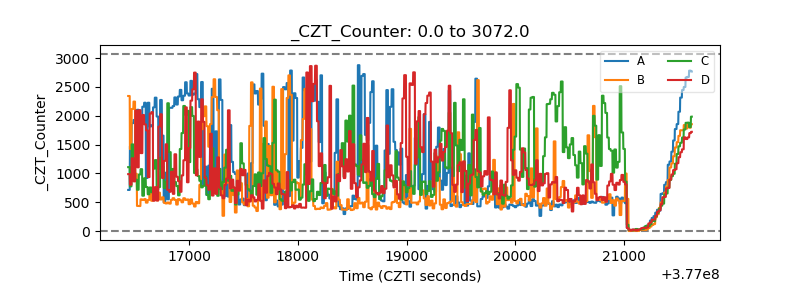 |
| +2.5 Volts monitor |  |
| +5 Volts monitor |  |
| _ROLL_ROT | 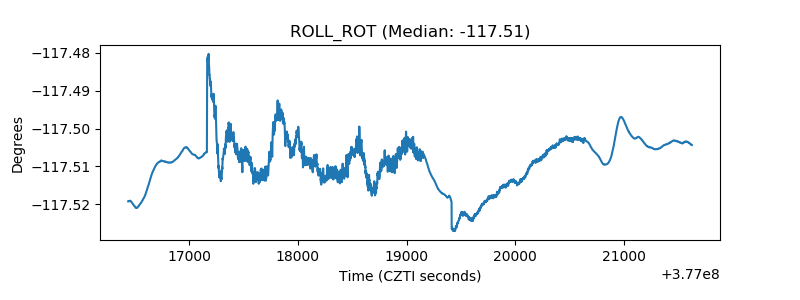 |
| _Roll_DEC | 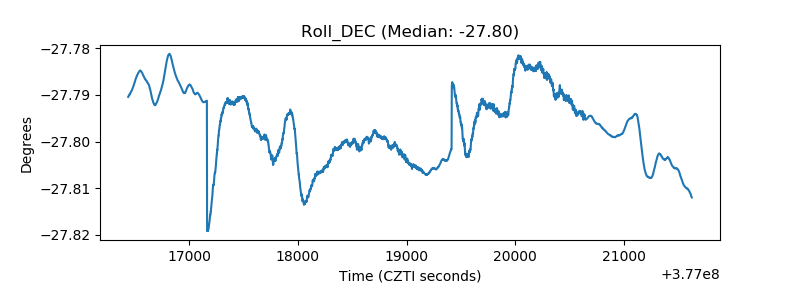 |
| _Roll_RA | 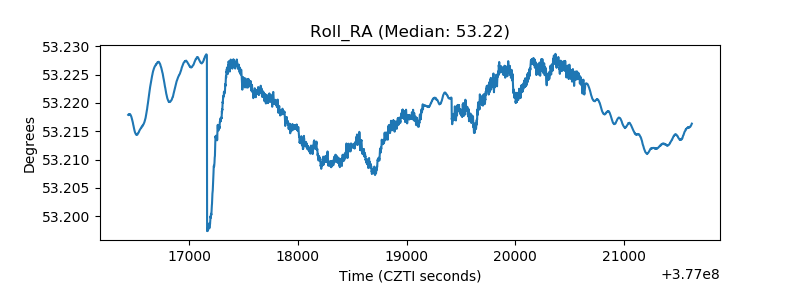 |
| Veto Counter | 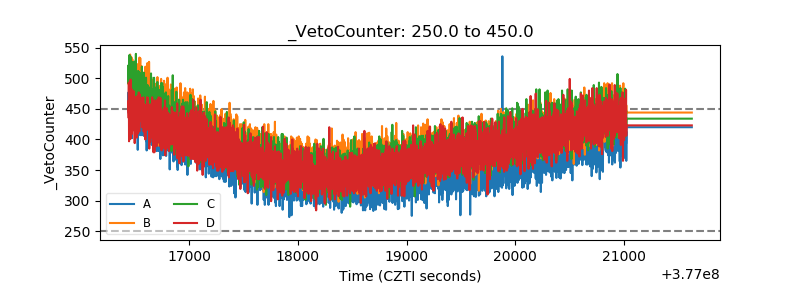 |