| Param | Original file | Final file |
|---|---|---|
| Filename | modeM0/AS1A11_060T01_9000004808_33567cztM0_level2.evt | modeM0/AS1A11_060T01_9000004808_33567cztM0_level2_quad_clean.evt |
| Size (bytes) | 560,563,200 | 69,684,480 |
| Size | 534.6 MB | 66.5 MB |
| Events in quadrant A | 2,778,178 | 457,509 |
| Events in quadrant B | 3,922,169 | 451,835 |
| Events in quadrant C | 5,997,213 | 417,506 |
| Events in quadrant D | 3,928,173 | 419,182 |
| Mode M0 | |||
|---|---|---|---|
| Quadrant | BADHDUFLAG | Total packets | Discarded packets |
| A | 0 | 11227 | 3 |
| B | 0 | 14782 | 2 |
| C | 0 | 21487 | 2 |
| D | 0 | 15105 | 2 |
| Mode M9 | |||
|---|---|---|---|
| Quadrant | BADHDUFLAG | Total packets | Discarded packets |
| A | 0 | 25 | 0 |
| B | 0 | 25 | 0 |
| C | 0 | 25 | 0 |
| D | 0 | 26 | 0 |
| Mode SS | |||
|---|---|---|---|
| Quadrant | BADHDUFLAG | Total packets | Discarded packets |
| A | 0 | 106 | 0 |
| B | 0 | 106 | 0 |
| C | 0 | 106 | 0 |
| D | 0 | 106 | 0 |
| Quadrant | Total seconds | Saturated seconds | Saturation percentage |
|---|---|---|---|
| A | 5190 | 10 | 0.192678% |
| B | 5190 | 485 | 9.344894% |
| C | 5190 | 527 | 10.154143% |
| D | 5190 | 152 | 2.928709% |
Noise dominated data is calculated using 1-second bins in cleaned event files. If a bin has >2000 counts, and if more than 50% of those come from <1% of pixels, then it is considered to be noise-dominated and hence unusable.
| Quadrant | # 1 sec bins | Bins with >0 counts | Bins with >2000 counts | High rate bins dominated by noise | Noise dominated (total time) | Noise dominated (detector-on time) | Marked lightcurve |
|---|---|---|---|---|---|---|---|
| A | 7193 | 5191 | 5 | 5 | 0.07% | 0.10% | 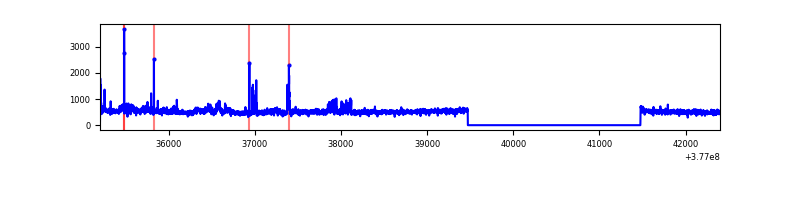 |
| B | 7193 | 5191 | 434 | 434 | 6.03% | 8.36% | 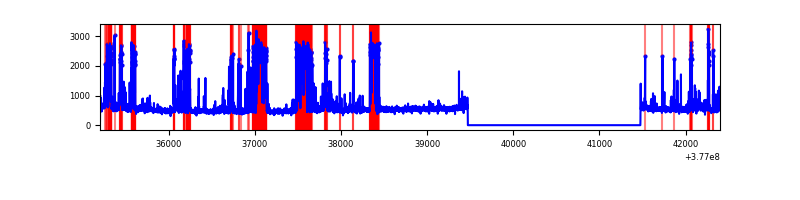 |
| C | 7193 | 5191 | 550 | 550 | 7.65% | 10.60% | 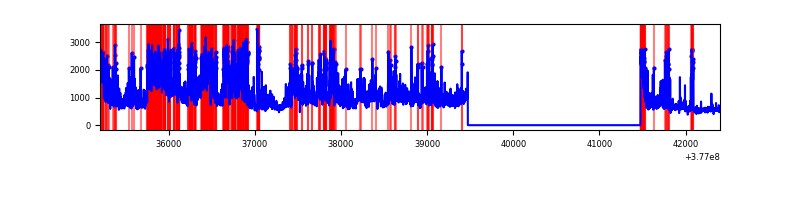 |
| D | 7193 | 5191 | 124 | 124 | 1.72% | 2.39% | 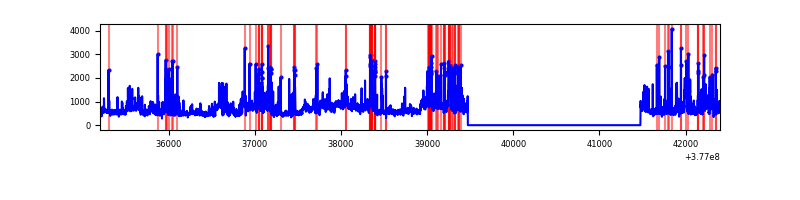 |
Top three noisy pixels from each quadrant. If the there are fewer than three noisy pixels in the level2.evt file, extra rows are filled as -1
| Pixel properties | Quadrant properties | ||||||
|---|---|---|---|---|---|---|---|
| Quadrant | DetID | PixID | Counts | Sigma | Mean | Median | Sigma |
| A | 15 | 169 | 240658 | 1867.0 | 652 | 641 | 128.6 |
| A | 13 | 254 | 8585 | 61.79 | 652 | 641 | 128.6 |
| A | 9 | 254 | 7544 | 53.7 | 652 | 641 | 128.6 |
| B | 5 | 172 | 1274630 | 10811.22 | 632 | 617 | 117.8 |
| B | 4 | 170 | 36691 | 306.12 | 632 | 617 | 117.8 |
| B | 4 | 251 | 35499 | 296.0 | 632 | 617 | 117.8 |
| C | 3 | 233 | 2756173 | 19237.38 | 621 | 627 | 143.2 |
| C | 14 | 254 | 322807 | 2249.25 | 621 | 627 | 143.2 |
| C | 0 | 10 | 248597 | 1731.16 | 621 | 627 | 143.2 |
| D | 8 | 195 | 673091 | 4427.99 | 623 | 607 | 151.9 |
| D | 13 | 249 | 384649 | 2528.74 | 623 | 607 | 151.9 |
| D | 2 | 250 | 169422 | 1111.57 | 623 | 607 | 151.9 |
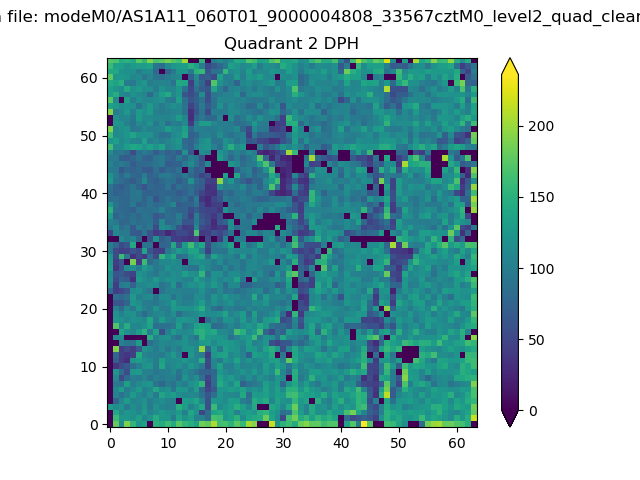
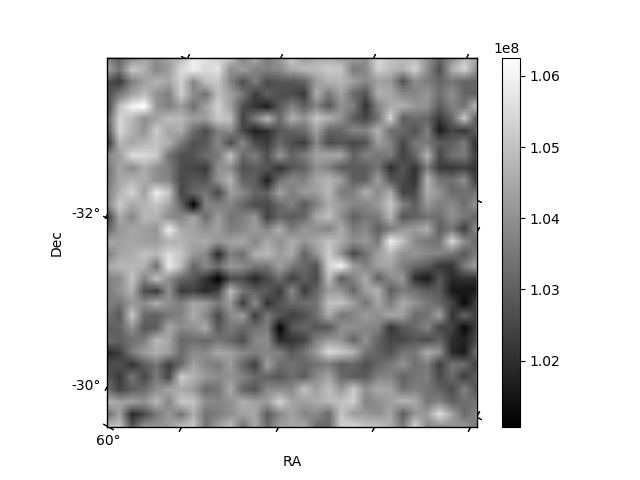
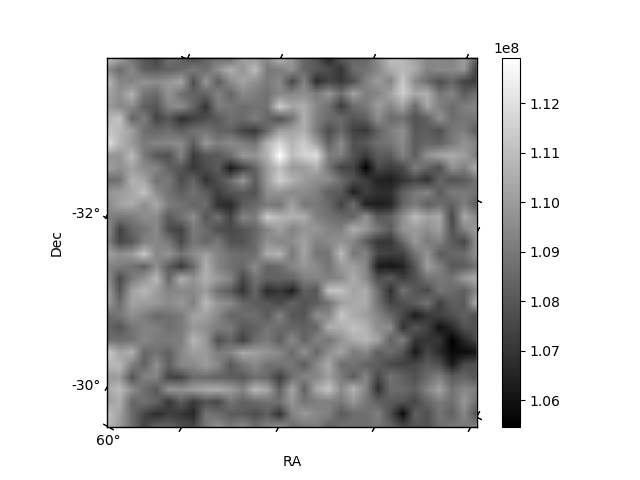
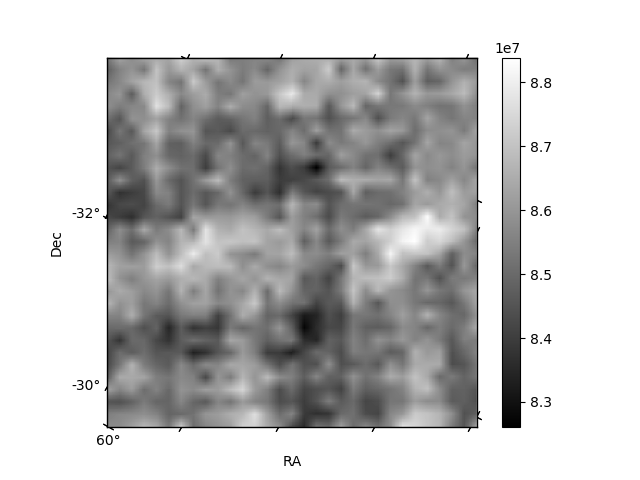
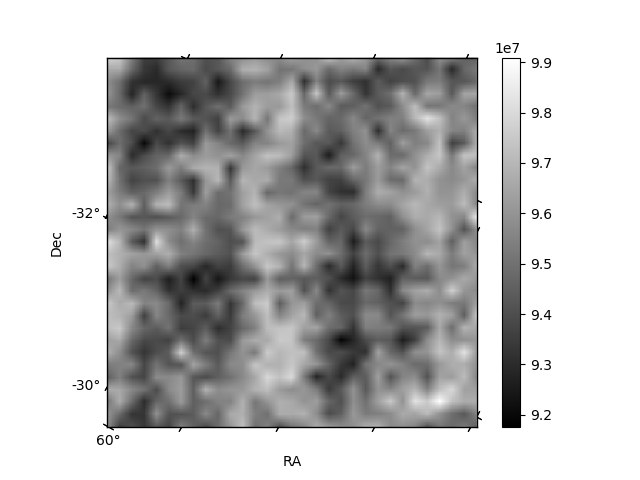
Histogram calculated using DETX and DETY for each event in the final _common_clean file
| Quadrant A | 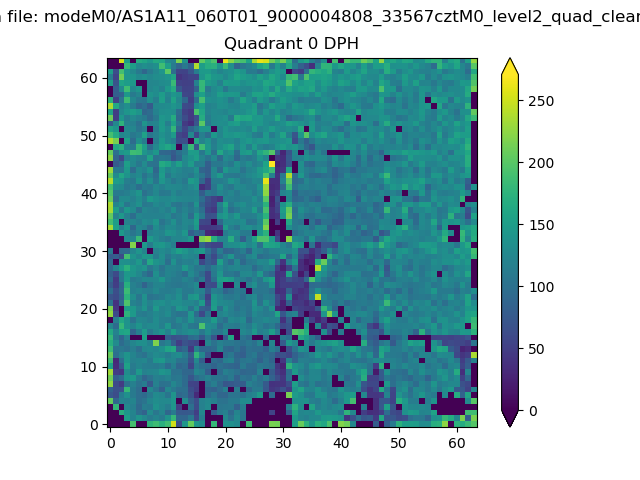 |
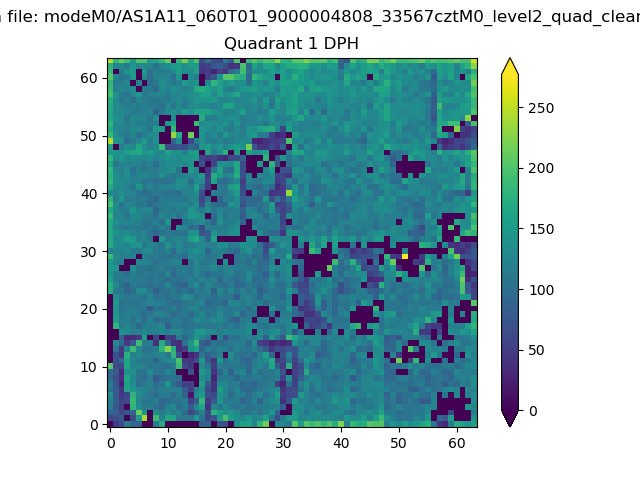 |
Quadrant B |
|---|---|---|---|
| Quadrant D | 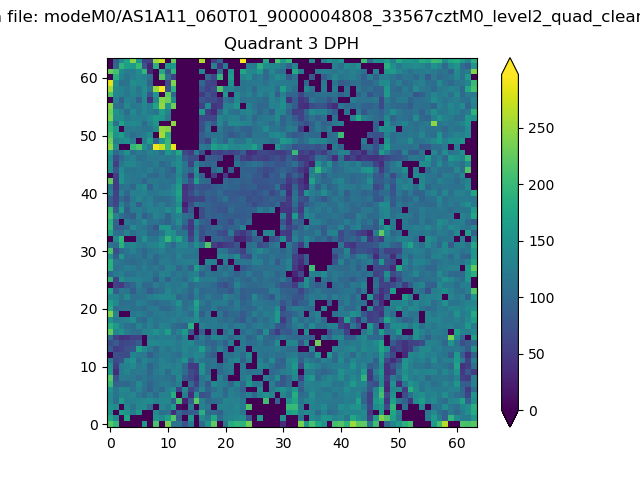 |
 |
Quadrant C |
| Plot type | Count rate plots | Images |
|---|---|---|
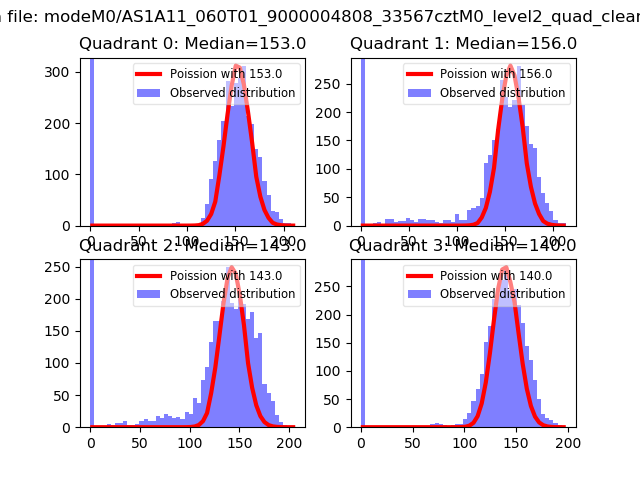
| Comparison with Poisson distribution Blue bars denote a histogram of data divided into 1 sec bins. Red curve is a Poisson curve with rate = median count rate of data. |
 |
 |
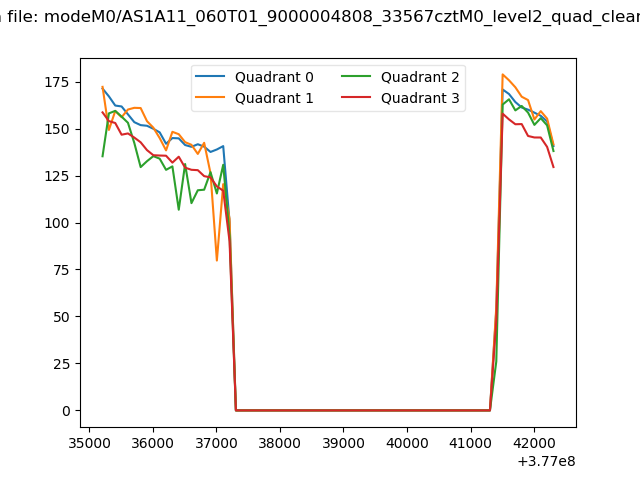
| Quadrant-wise count rates Data is divided into 100 sec bins |
 |
|
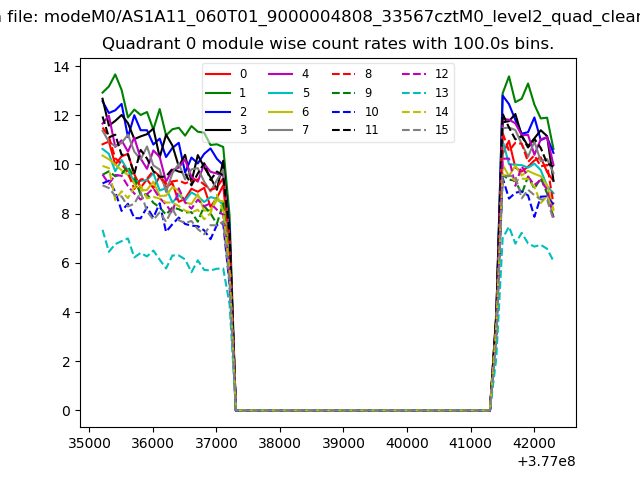
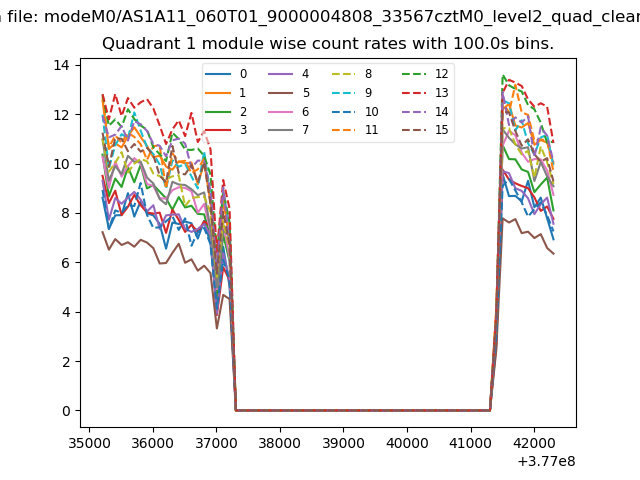
| Module-wise count rates for Quadrant A Data is divided into 100 sec bins |
 |
 |
| Module-wise count rates for Quadrant B Data is divided into 100 sec bins |
 |
 |
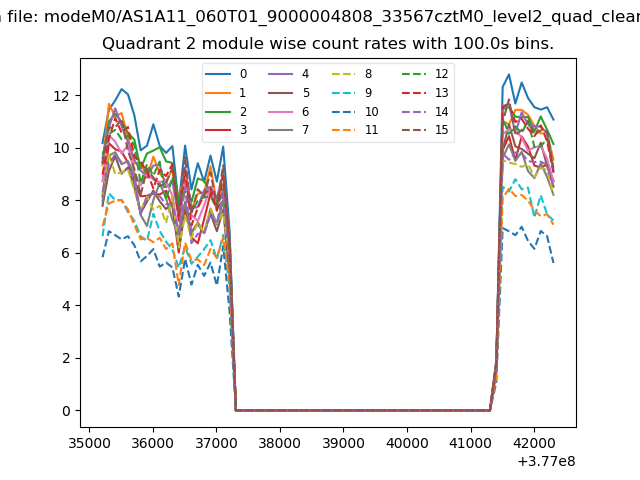
| Module-wise count rates for Quadrant C Data is divided into 100 sec bins |
 |
 |
| Module-wise count rates for Quadrant D Data is divided into 100 sec bins |
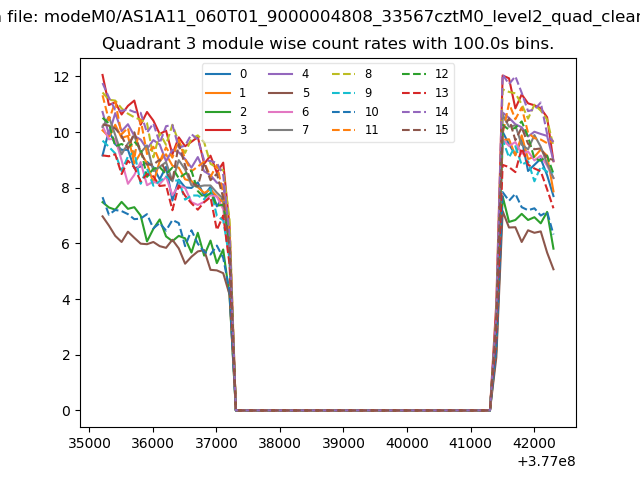 |
 |
| Parameter | Plot |
|---|---|
| CZT HV Monitor | 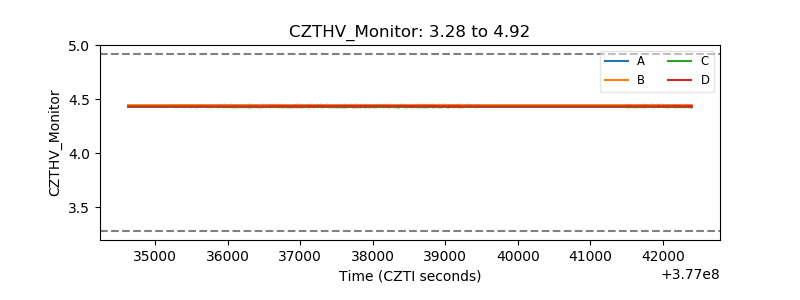 |
| D_VDD | 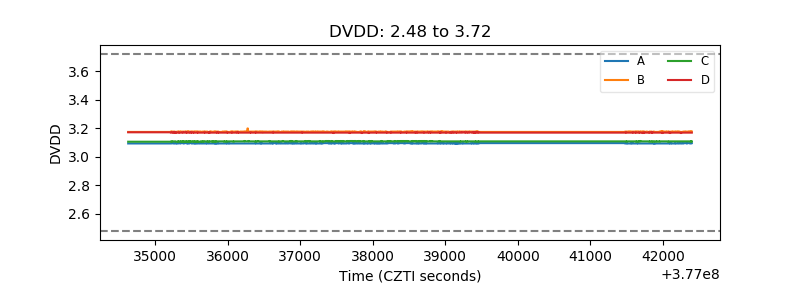 |
| Temperature 1 | 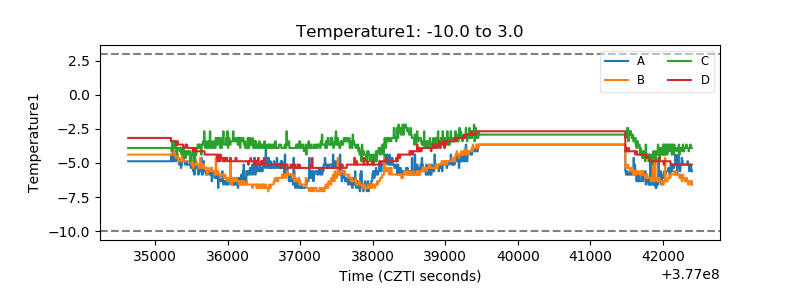 |
| Veto HV Monitor | 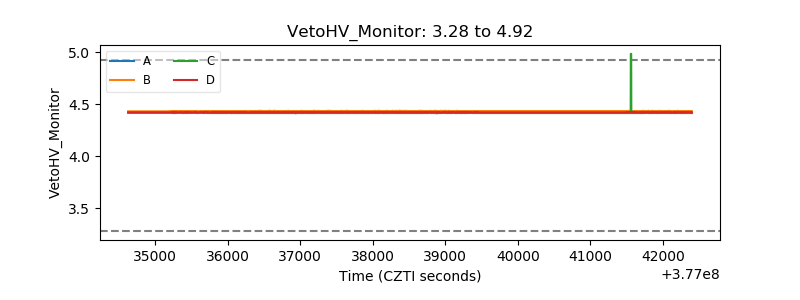 |
| Veto LLD | 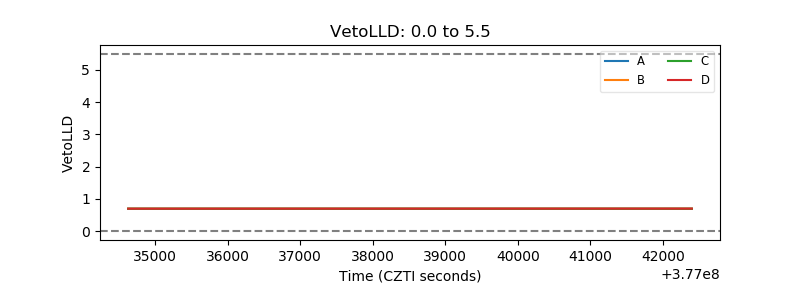 |
| Alpha Counter | 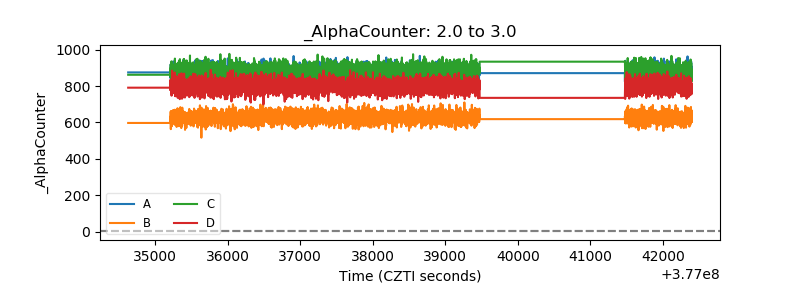 |
| _CPM_Rate | 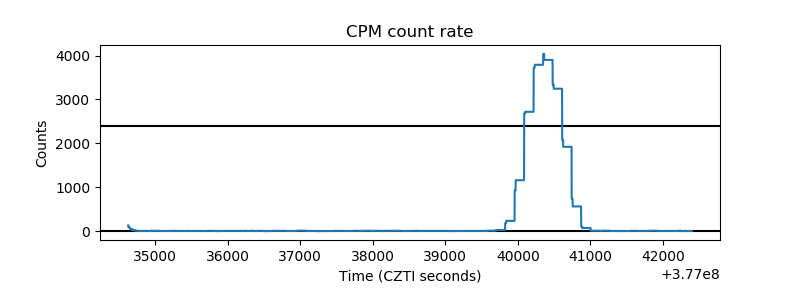 |
| CZT Counter | 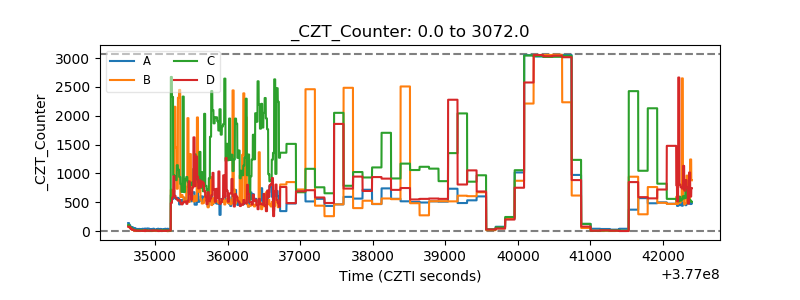 |
| +2.5 Volts monitor |  |
| +5 Volts monitor |  |
| _ROLL_ROT | 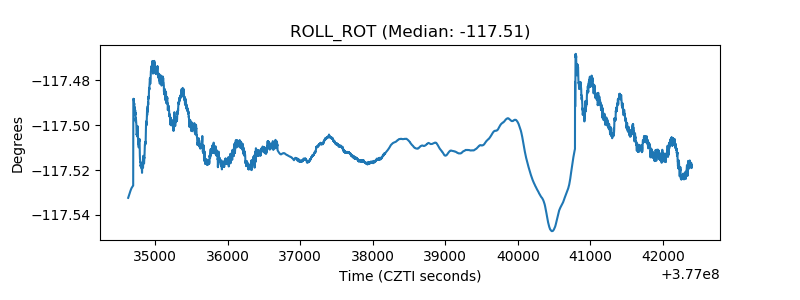 |
| _Roll_DEC | 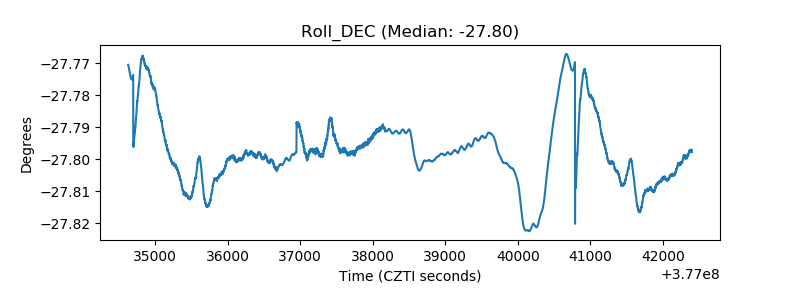 |
| _Roll_RA | 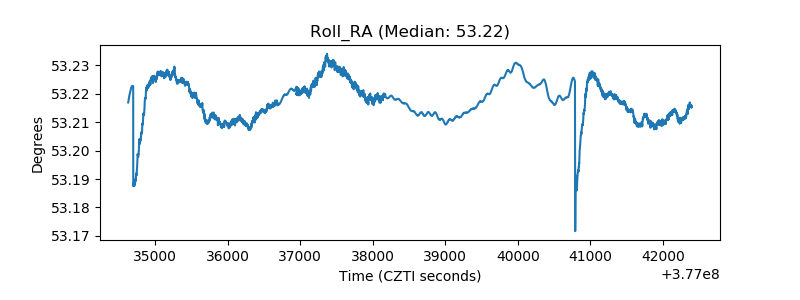 |
| Veto Counter | 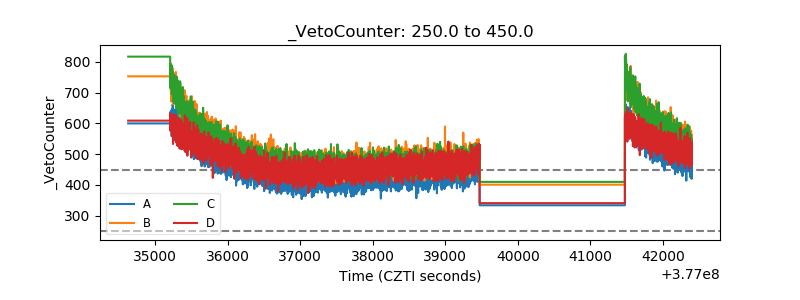 |