| Param | Original file | Final file |
|---|---|---|
| Filename | modeM0/AS1A11_060T01_9000004808_33568cztM0_level2.evt | modeM0/AS1A11_060T01_9000004808_33568cztM0_level2_quad_clean.evt |
| Size (bytes) | 494,081,280 | 69,468,480 |
| Size | 471.2 MB | 66.3 MB |
| Events in quadrant A | 2,683,962 | 448,175 |
| Events in quadrant B | 3,527,366 | 454,733 |
| Events in quadrant C | 4,343,694 | 426,157 |
| Events in quadrant D | 4,060,353 | 414,370 |
| Mode M0 | |||
|---|---|---|---|
| Quadrant | BADHDUFLAG | Total packets | Discarded packets |
| A | 0 | 11032 | 3 |
| B | 0 | 13509 | 2 |
| C | 0 | 16771 | 2 |
| D | 0 | 15545 | 2 |
| Mode M9 | |||
|---|---|---|---|
| Quadrant | BADHDUFLAG | Total packets | Discarded packets |
| A | 0 | 36 | 0 |
| B | 0 | 36 | 0 |
| C | 0 | 36 | 0 |
| D | 0 | 37 | 0 |
| Mode SS | |||
|---|---|---|---|
| Quadrant | BADHDUFLAG | Total packets | Discarded packets |
| A | 0 | 104 | 0 |
| B | 0 | 104 | 0 |
| C | 0 | 104 | 0 |
| D | 0 | 104 | 0 |
| Quadrant | Total seconds | Saturated seconds | Saturation percentage |
|---|---|---|---|
| A | 5138 | 23 | 0.447645% |
| B | 5138 | 313 | 6.091865% |
| C | 5138 | 300 | 5.838848% |
| D | 5138 | 133 | 2.588556% |
Noise dominated data is calculated using 1-second bins in cleaned event files. If a bin has >2000 counts, and if more than 50% of those come from <1% of pixels, then it is considered to be noise-dominated and hence unusable.
| Quadrant | # 1 sec bins | Bins with >0 counts | Bins with >2000 counts | High rate bins dominated by noise | Noise dominated (total time) | Noise dominated (detector-on time) | Marked lightcurve |
|---|---|---|---|---|---|---|---|
| A | 7231 | 5139 | 20 | 20 | 0.28% | 0.39% | 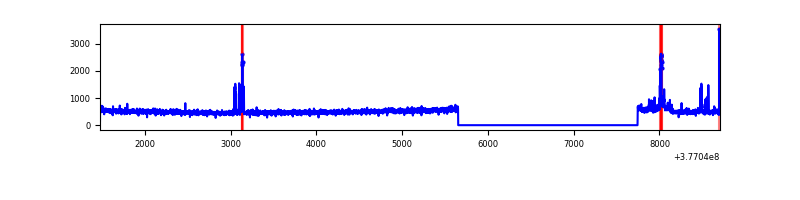 |
| B | 7231 | 5139 | 257 | 257 | 3.55% | 5.00% | 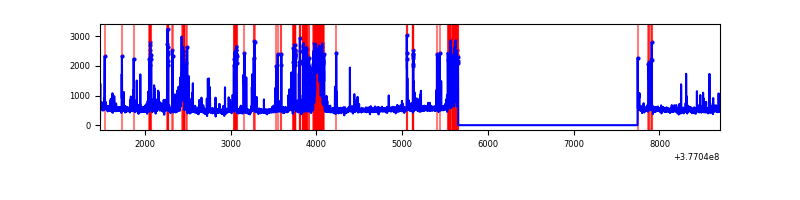 |
| C | 7231 | 5139 | 257 | 257 | 3.55% | 5.00% | 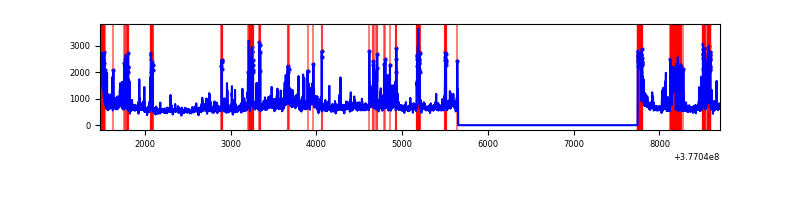 |
| D | 7231 | 5139 | 126 | 126 | 1.74% | 2.45% | 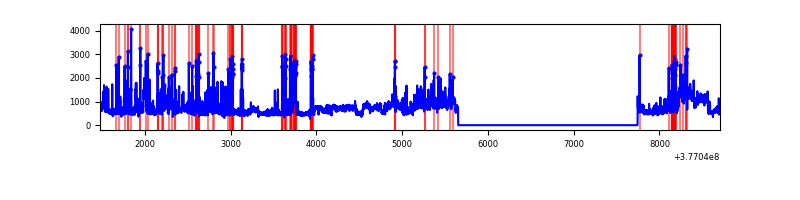 |
Top three noisy pixels from each quadrant. If the there are fewer than three noisy pixels in the level2.evt file, extra rows are filled as -1
| Pixel properties | Quadrant properties | ||||||
|---|---|---|---|---|---|---|---|
| Quadrant | DetID | PixID | Counts | Sigma | Mean | Median | Sigma |
| A | 15 | 169 | 166073 | 1286.16 | 650 | 638 | 128.6 |
| A | 13 | 254 | 9798 | 71.21 | 650 | 638 | 128.6 |
| A | 3 | 137 | 6051 | 42.08 | 650 | 638 | 128.6 |
| B | 5 | 172 | 903275 | 7505.25 | 640 | 626 | 120.3 |
| B | 0 | 190 | 38526 | 315.13 | 640 | 626 | 120.3 |
| B | 4 | 170 | 28356 | 230.57 | 640 | 626 | 120.3 |
| C | 3 | 233 | 751323 | 5174.1 | 629 | 635 | 145.1 |
| C | 14 | 254 | 658002 | 4530.89 | 629 | 635 | 145.1 |
| C | 0 | 10 | 250225 | 1720.29 | 629 | 635 | 145.1 |
| D | 8 | 195 | 795257 | 5261.12 | 628 | 614 | 151.0 |
| D | 13 | 249 | 314635 | 2079.05 | 628 | 614 | 151.0 |
| D | 2 | 250 | 255520 | 1687.66 | 628 | 614 | 151.0 |
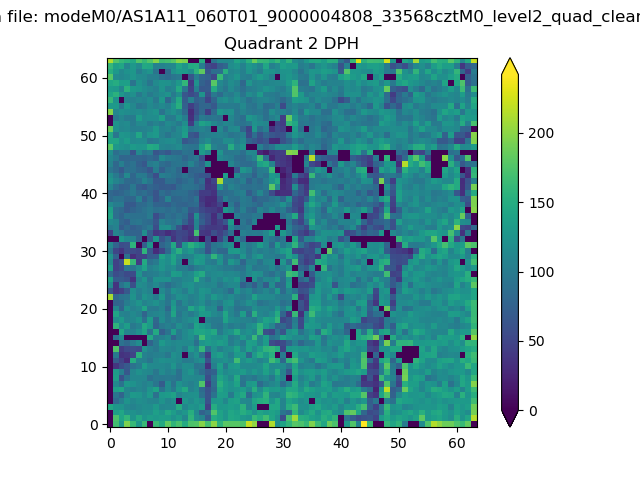
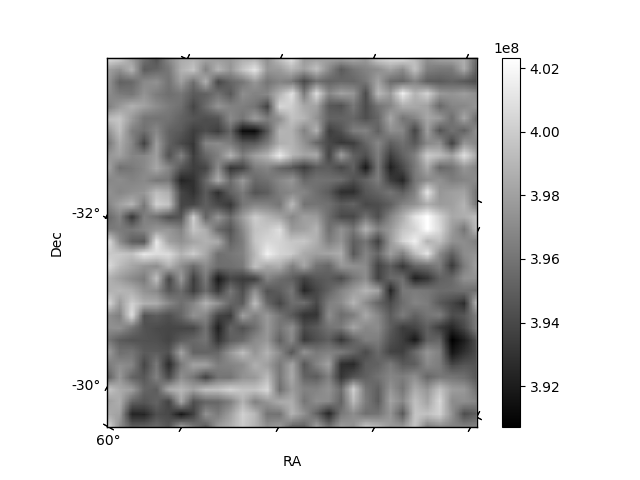
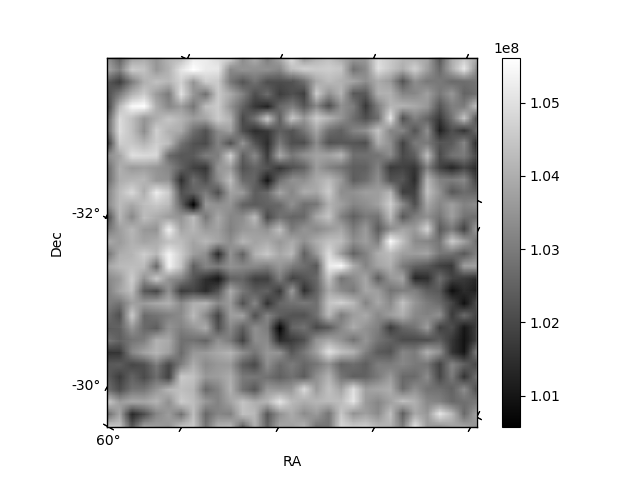
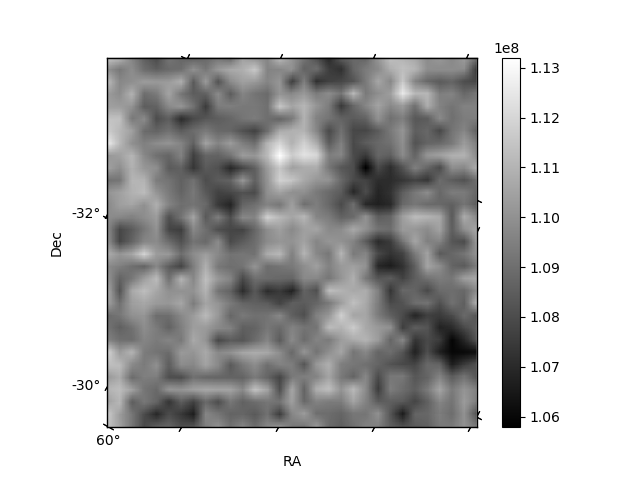
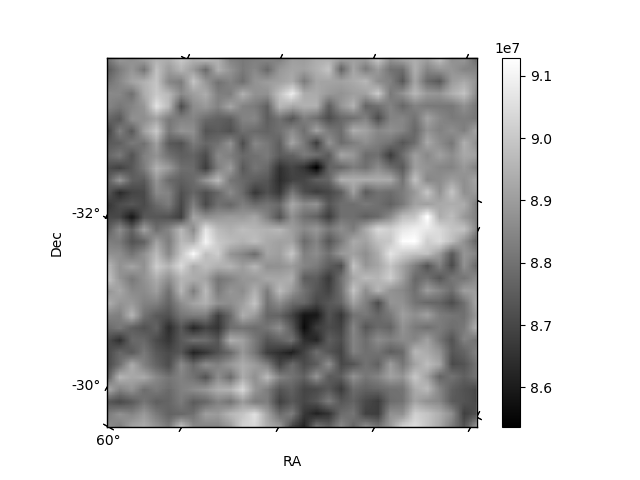
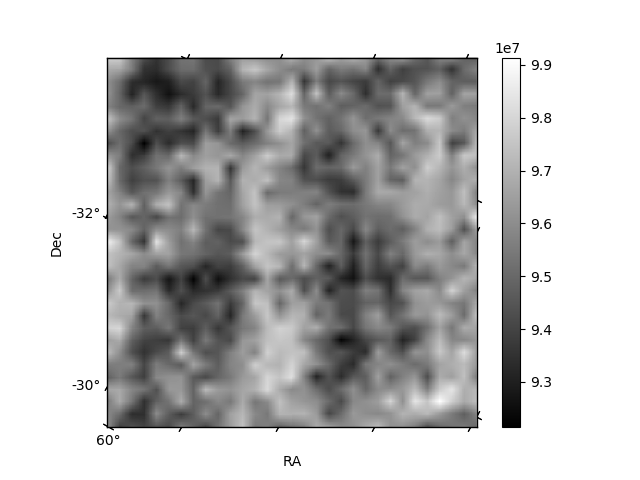
Histogram calculated using DETX and DETY for each event in the final _common_clean file
| Quadrant A | 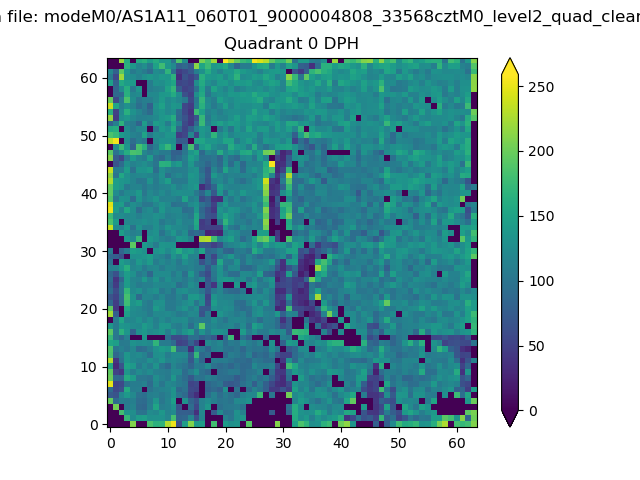 |
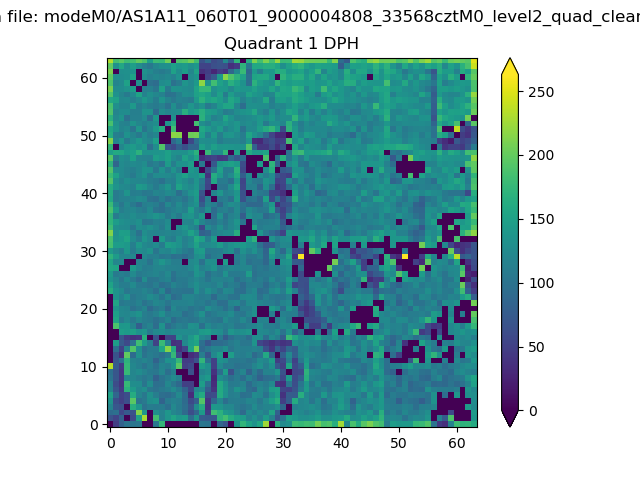 |
Quadrant B |
|---|---|---|---|
| Quadrant D | 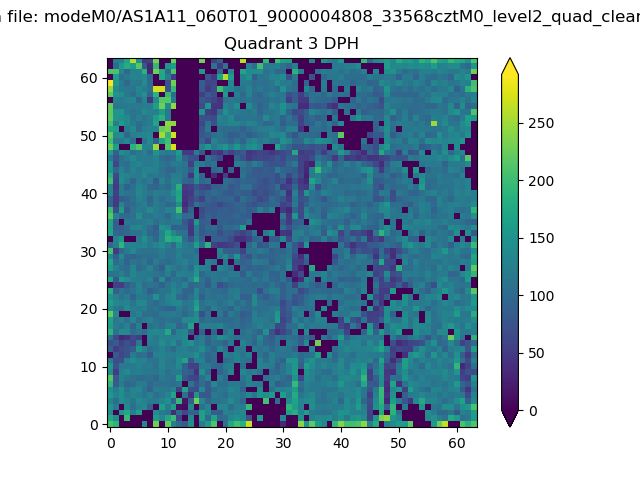 |
 |
Quadrant C |
| Plot type | Count rate plots | Images |
|---|---|---|
| Comparison with Poisson distribution Blue bars denote a histogram of data divided into 1 sec bins. Red curve is a Poisson curve with rate = median count rate of data. |
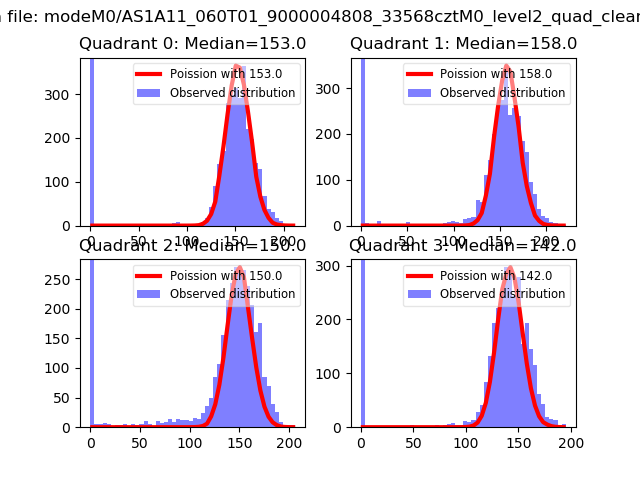 |
 |
| Quadrant-wise count rates Data is divided into 100 sec bins |
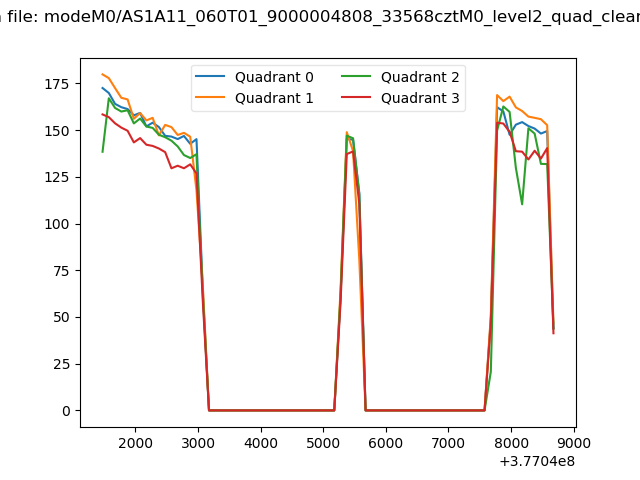 |
|
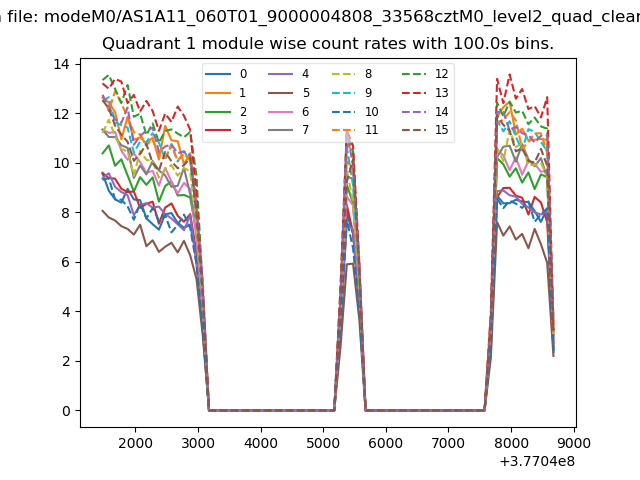
| Module-wise count rates for Quadrant A Data is divided into 100 sec bins |
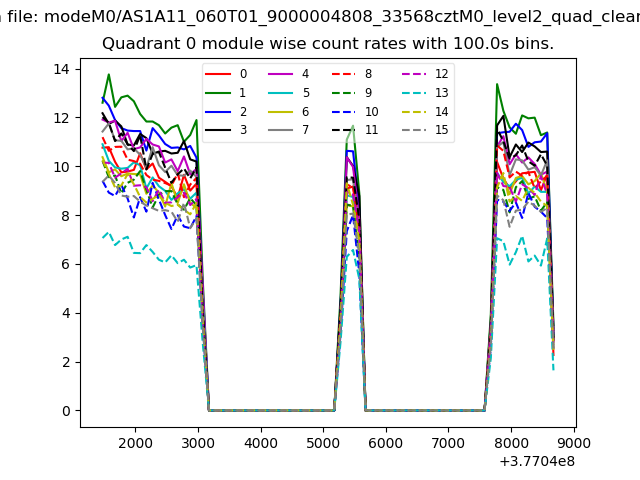 |
 |
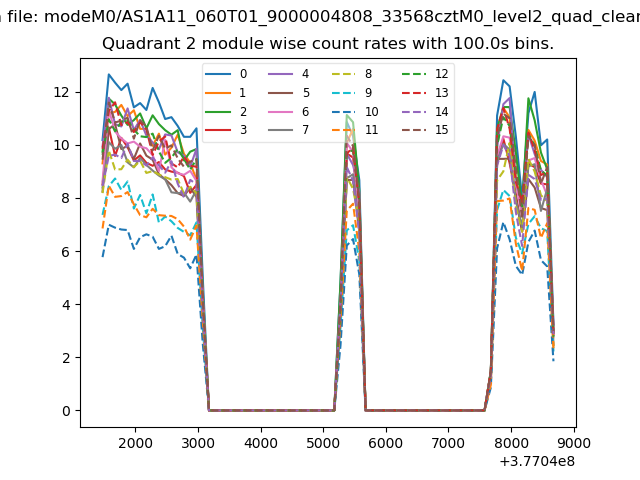
| Module-wise count rates for Quadrant B Data is divided into 100 sec bins |
 |
 |
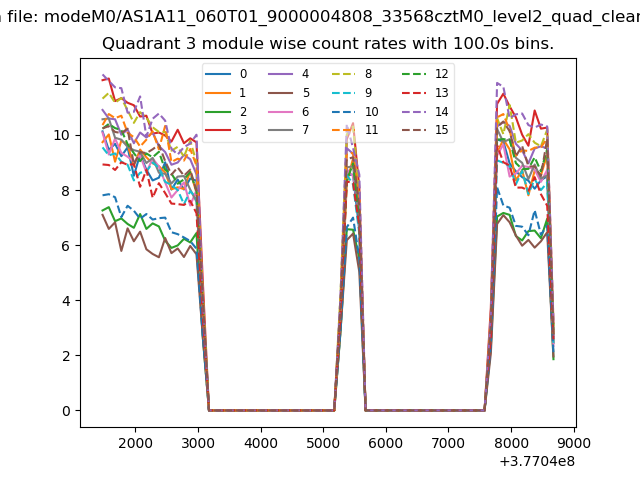
| Module-wise count rates for Quadrant C Data is divided into 100 sec bins |
 |
 |
| Module-wise count rates for Quadrant D Data is divided into 100 sec bins |
 |
 |
| Parameter | Plot |
|---|---|
| CZT HV Monitor | 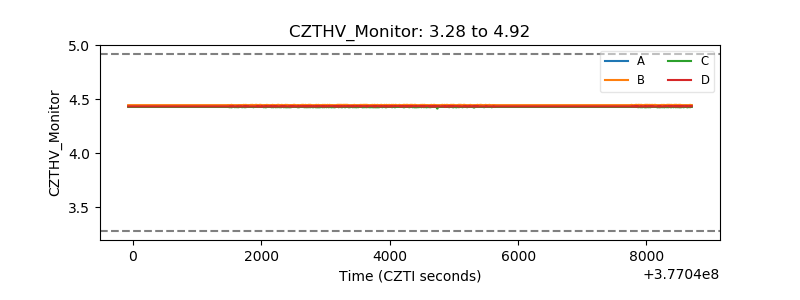 |
| D_VDD | 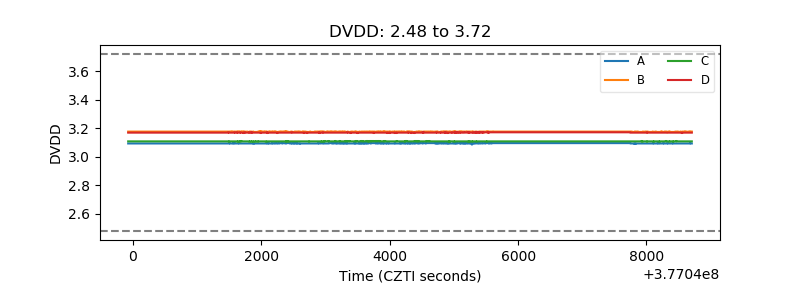 |
| Temperature 1 | 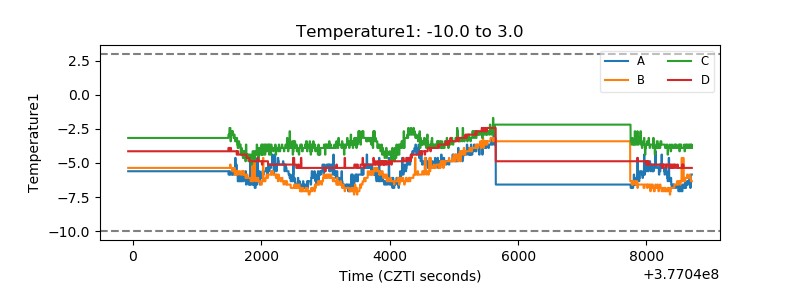 |
| Veto HV Monitor | 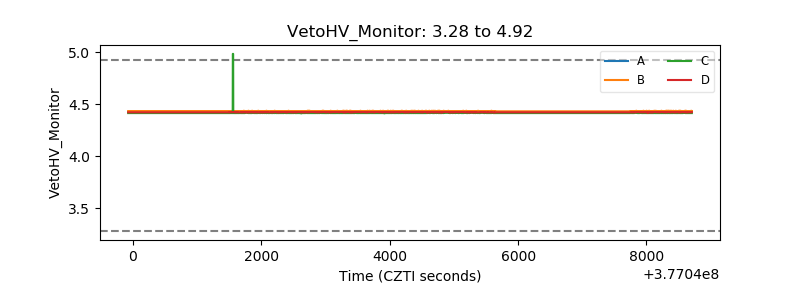 |
| Veto LLD | 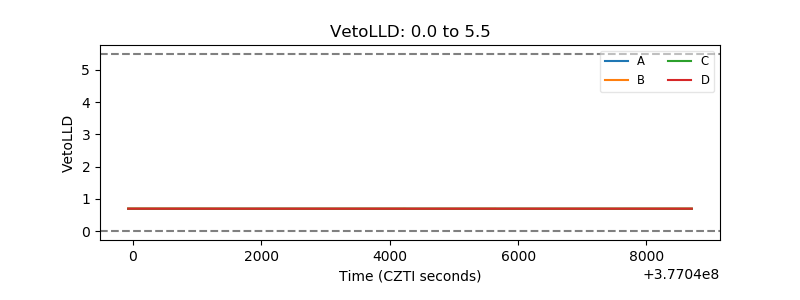 |
| Alpha Counter | 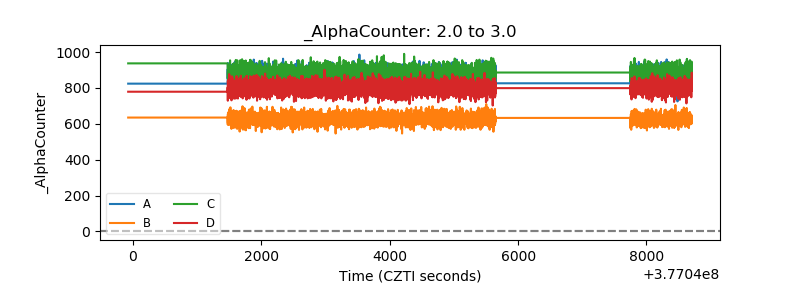 |
| _CPM_Rate | 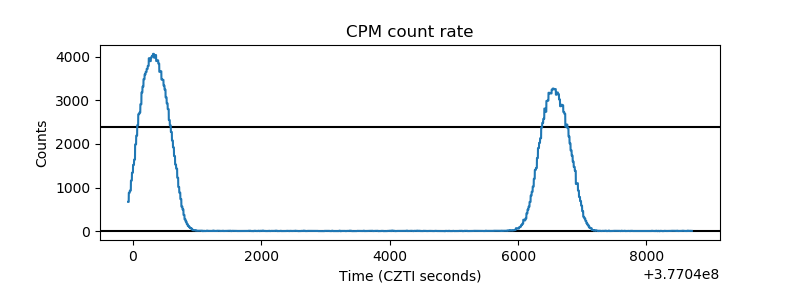 |
| CZT Counter | 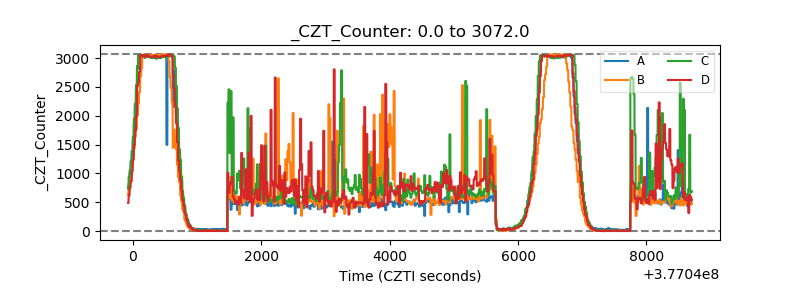 |
| +2.5 Volts monitor |  |
| +5 Volts monitor |  |
| _ROLL_ROT | 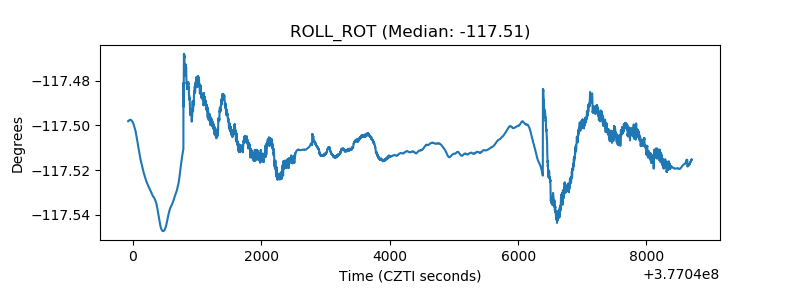 |
| _Roll_DEC | 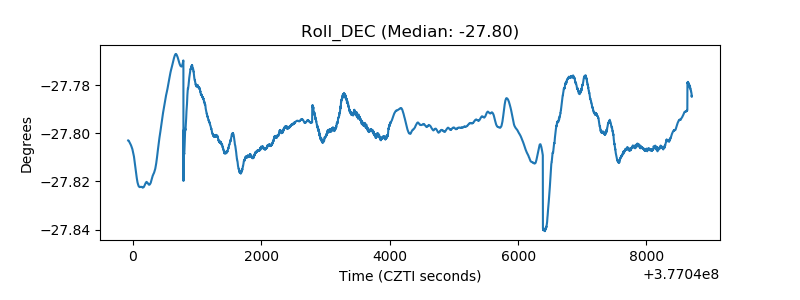 |
| _Roll_RA | 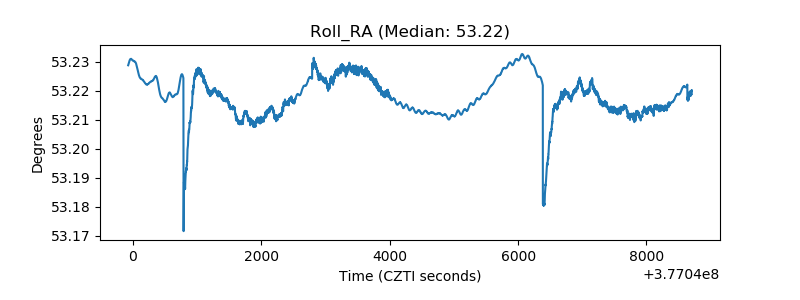 |
| Veto Counter | 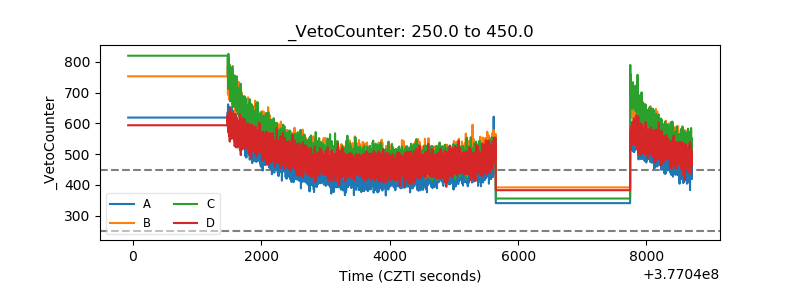 |