| Param | Original file | Final file |
|---|---|---|
| Filename | modeM0/AS1A11_060T01_9000004808_33572cztM0_level2.evt | modeM0/AS1A11_060T01_9000004808_33572cztM0_level2_quad_clean.evt |
| Size (bytes) | 580,965,120 | 65,465,280 |
| Size | 554.1 MB | 62.4 MB |
| Events in quadrant A | 2,840,483 | 403,135 |
| Events in quadrant B | 4,214,663 | 386,230 |
| Events in quadrant C | 5,310,762 | 392,942 |
| Events in quadrant D | 4,821,907 | 379,631 |
| Mode M0 | |||
|---|---|---|---|
| Quadrant | BADHDUFLAG | Total packets | Discarded packets |
| A | 0 | 12181 | 2 |
| B | 0 | 16326 | 1 |
| C | 0 | 20297 | 1 |
| D | 0 | 18330 | 1 |
| Mode M9 | |||
|---|---|---|---|
| Quadrant | BADHDUFLAG | Total packets | Discarded packets |
| A | 0 | 33 | 0 |
| B | 0 | 33 | 0 |
| C | 0 | 33 | 0 |
| D | 0 | 33 | 0 |
| Mode SS | |||
|---|---|---|---|
| Quadrant | BADHDUFLAG | Total packets | Discarded packets |
| A | 0 | 124 | 0 |
| B | 0 | 124 | 0 |
| C | 0 | 124 | 0 |
| D | 0 | 124 | 0 |
| Quadrant | Total seconds | Saturated seconds | Saturation percentage |
|---|---|---|---|
| A | 6015 | 15 | 0.249377% |
| B | 6015 | 415 | 6.899418% |
| C | 6015 | 160 | 2.660017% |
| D | 6015 | 150 | 2.493766% |
Noise dominated data is calculated using 1-second bins in cleaned event files. If a bin has >2000 counts, and if more than 50% of those come from <1% of pixels, then it is considered to be noise-dominated and hence unusable.
| Quadrant | # 1 sec bins | Bins with >0 counts | Bins with >2000 counts | High rate bins dominated by noise | Noise dominated (total time) | Noise dominated (detector-on time) | Marked lightcurve |
|---|---|---|---|---|---|---|---|
| A | 9332 | 6017 | 7 | 7 | 0.08% | 0.12% | 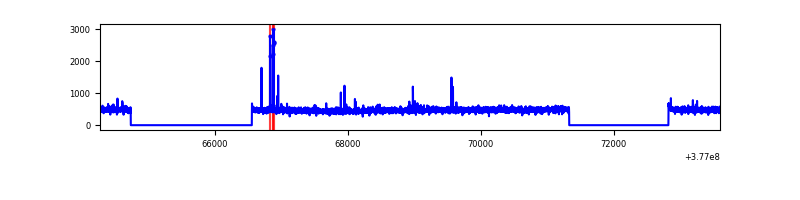 |
| B | 9332 | 6017 | 333 | 333 | 3.57% | 5.53% | 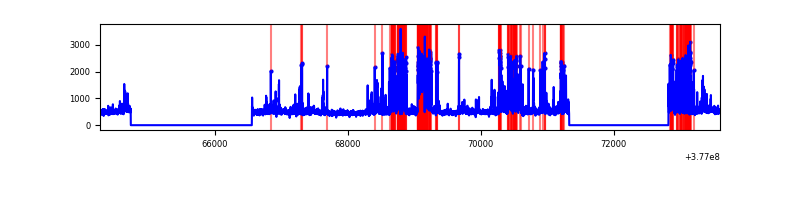 |
| C | 9332 | 6017 | 127 | 127 | 1.36% | 2.11% | 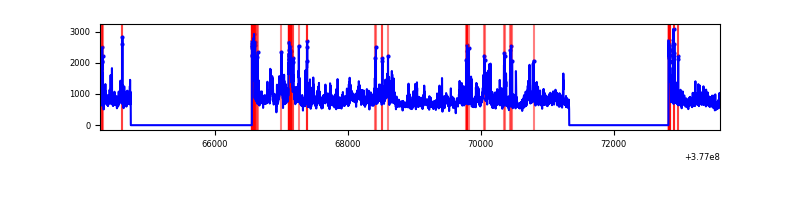 |
| D | 9332 | 6017 | 133 | 133 | 1.43% | 2.21% | 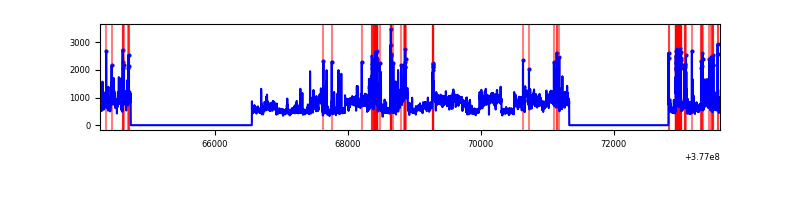 |
Top three noisy pixels from each quadrant. If the there are fewer than three noisy pixels in the level2.evt file, extra rows are filled as -1
| Pixel properties | Quadrant properties | ||||||
|---|---|---|---|---|---|---|---|
| Quadrant | DetID | PixID | Counts | Sigma | Mean | Median | Sigma |
| A | 15 | 169 | 90800 | 629.07 | 709 | 695 | 143.2 |
| A | 13 | 254 | 10912 | 71.33 | 709 | 695 | 143.2 |
| A | 3 | 137 | 7091 | 44.65 | 709 | 695 | 143.2 |
| B | 5 | 172 | 1209750 | 9095.8 | 686 | 667 | 132.9 |
| B | 5 | 255 | 123088 | 920.96 | 686 | 667 | 132.9 |
| B | 4 | 170 | 55852 | 415.15 | 686 | 667 | 132.9 |
| C | 3 | 233 | 2122637 | 13365.98 | 683 | 688 | 158.8 |
| C | 15 | 214 | 258336 | 1622.9 | 683 | 688 | 158.8 |
| C | 0 | 10 | 202254 | 1269.65 | 683 | 688 | 158.8 |
| D | 8 | 195 | 1511994 | 9075.49 | 679 | 659 | 166.5 |
| D | 13 | 249 | 269725 | 1615.73 | 679 | 659 | 166.5 |
| D | 2 | 250 | 265567 | 1590.76 | 679 | 659 | 166.5 |
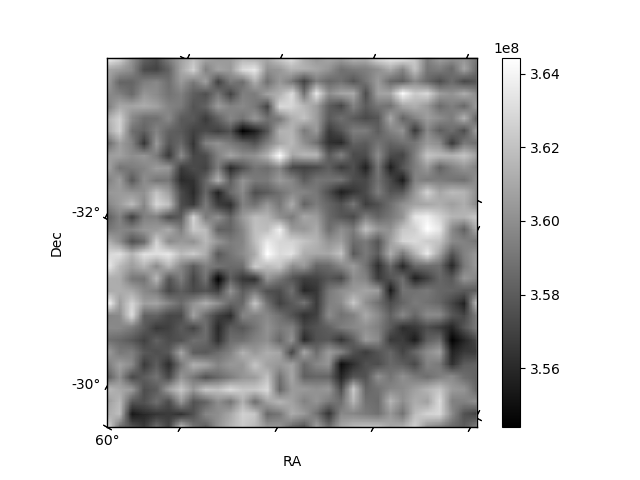
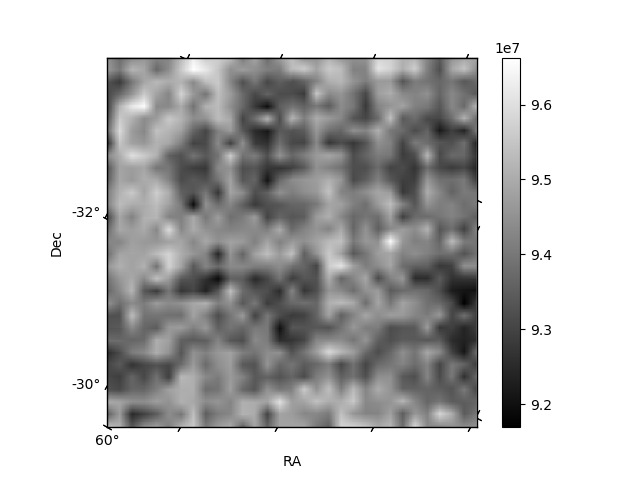
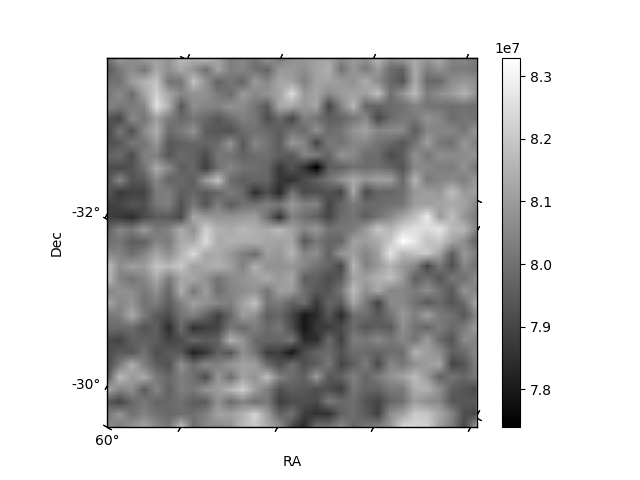
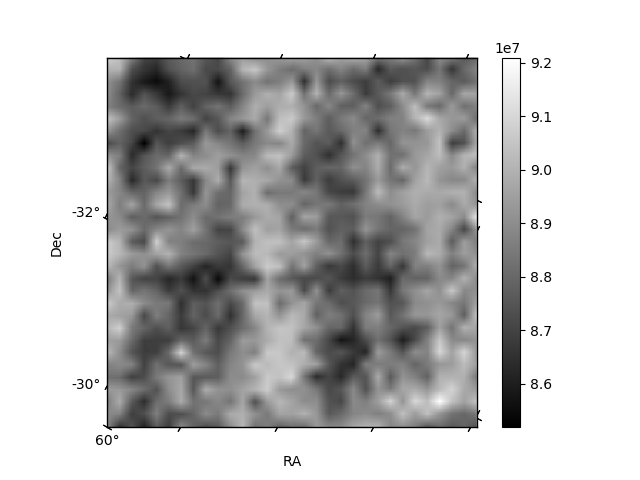
Histogram calculated using DETX and DETY for each event in the final _common_clean file
| Quadrant A | 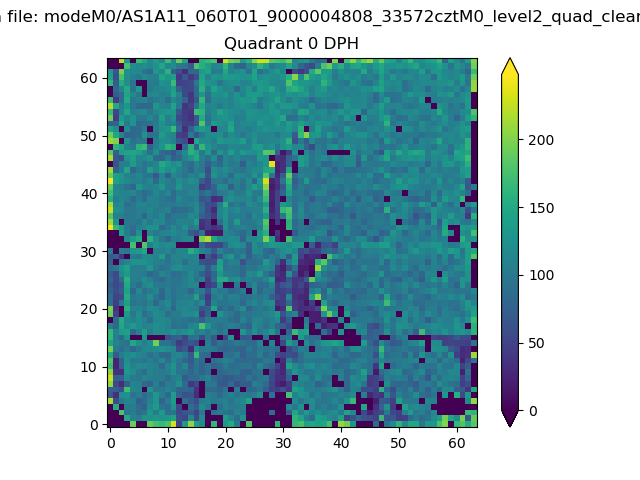 |
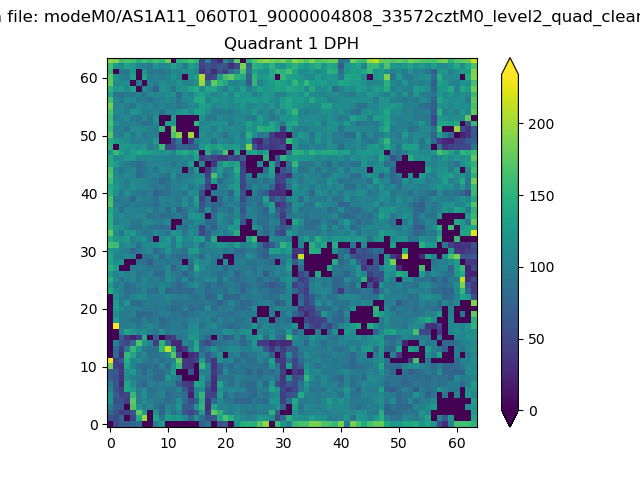 |
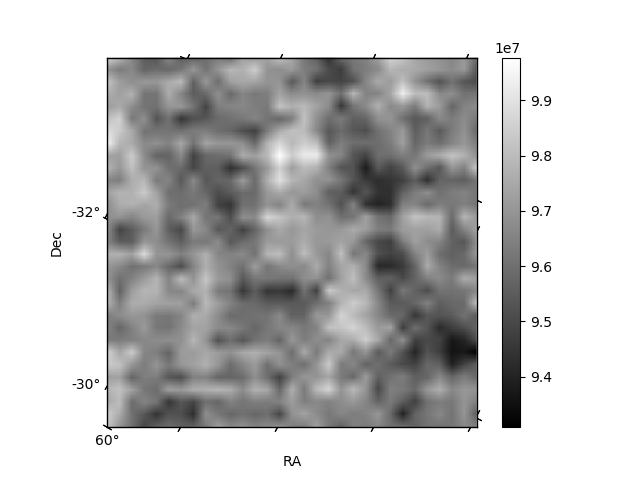
Quadrant B |
|---|---|---|---|
| Quadrant D | 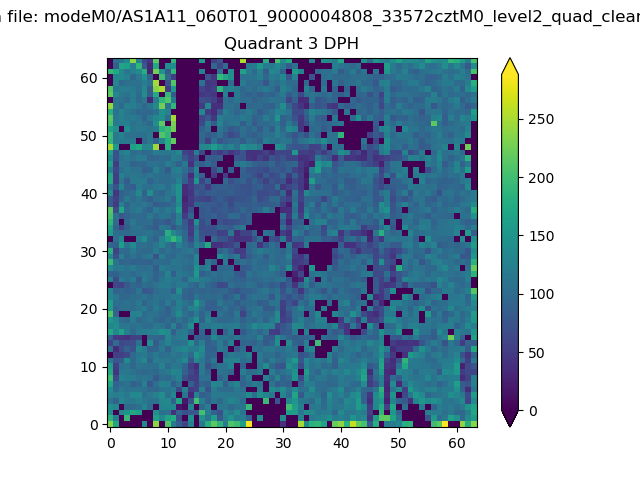 |
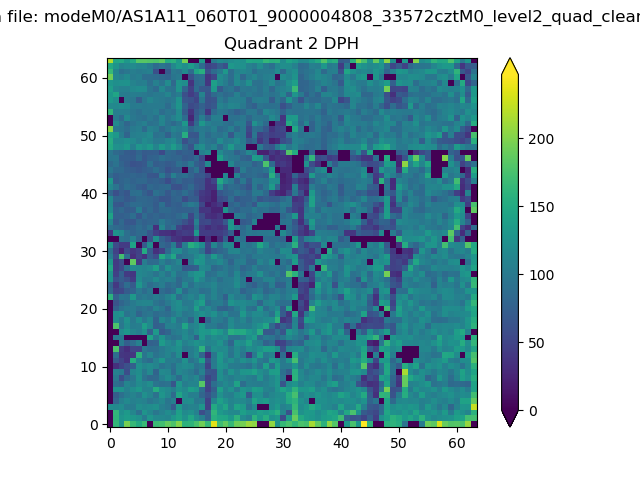 |
Quadrant C |
| Plot type | Count rate plots | Images |
|---|---|---|
| Comparison with Poisson distribution Blue bars denote a histogram of data divided into 1 sec bins. Red curve is a Poisson curve with rate = median count rate of data. |
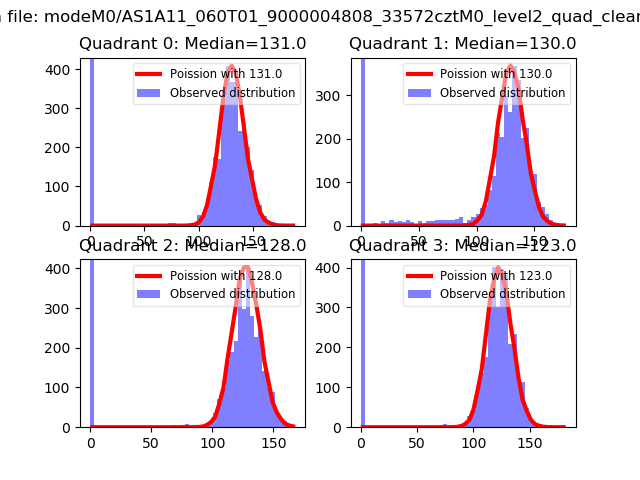 |
 |
| Quadrant-wise count rates Data is divided into 100 sec bins |
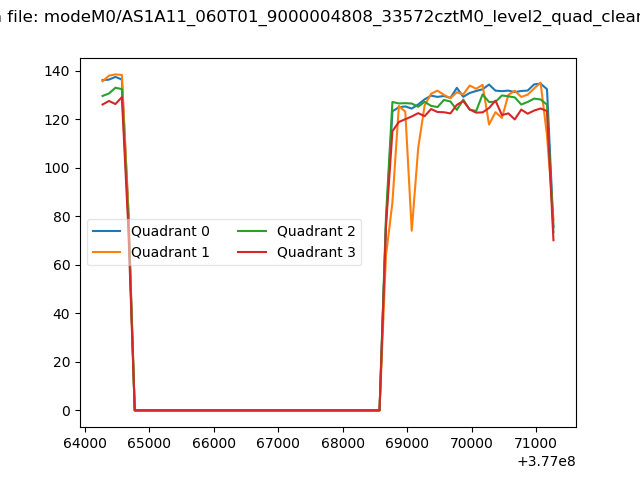 |
|
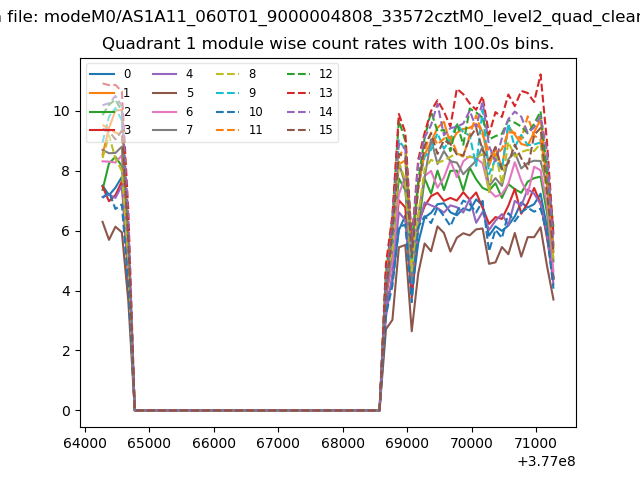
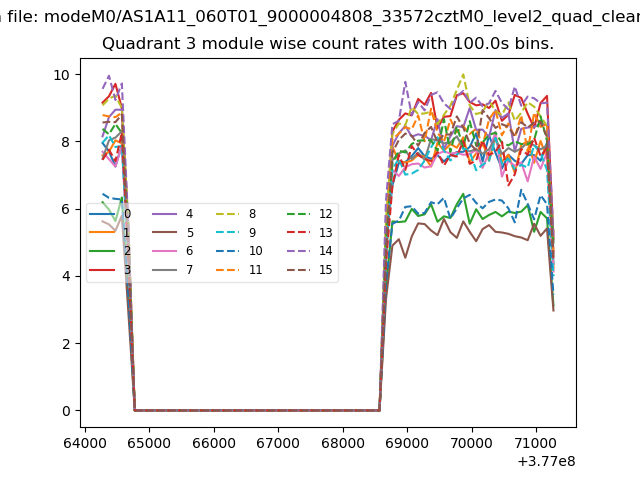
| Module-wise count rates for Quadrant A Data is divided into 100 sec bins |
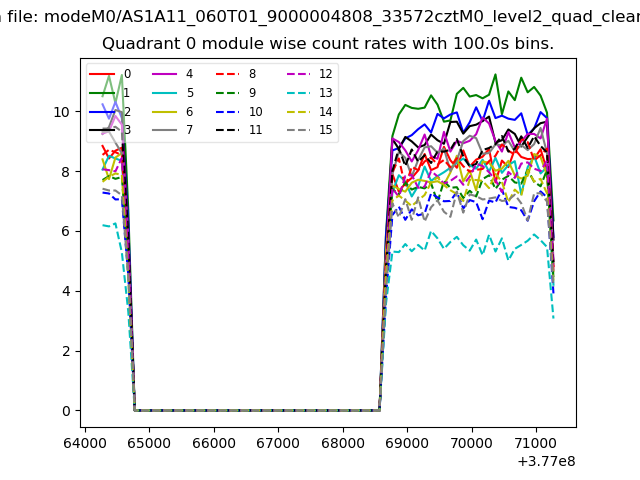 |
 |
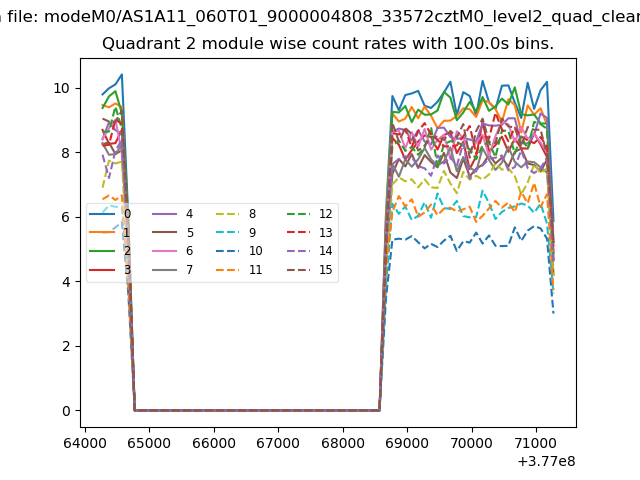
| Module-wise count rates for Quadrant B Data is divided into 100 sec bins |
 |
 |
| Module-wise count rates for Quadrant C Data is divided into 100 sec bins |
 |
 |
| Module-wise count rates for Quadrant D Data is divided into 100 sec bins |
 |
 |
| Parameter | Plot |
|---|---|
| CZT HV Monitor | 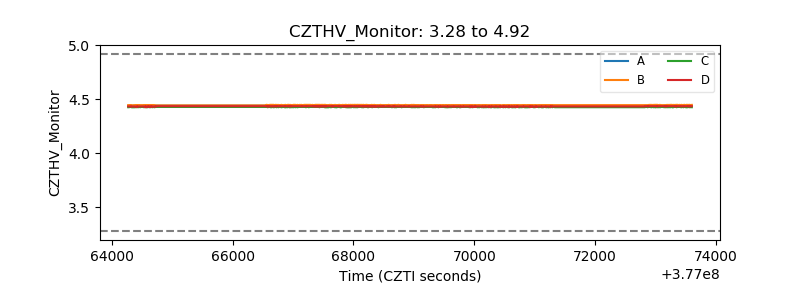 |
| D_VDD | 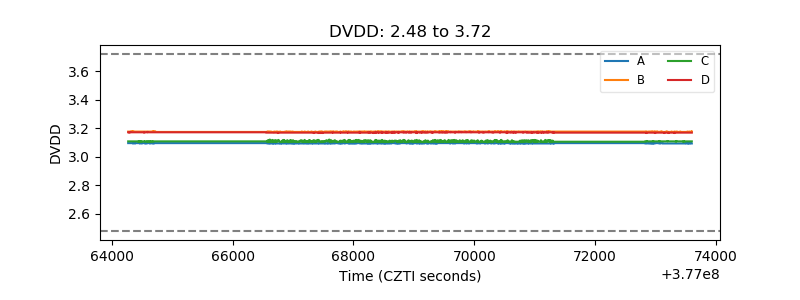 |
| Temperature 1 | 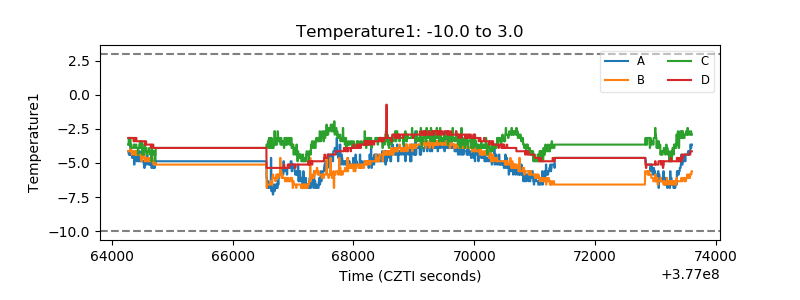 |
| Veto HV Monitor | 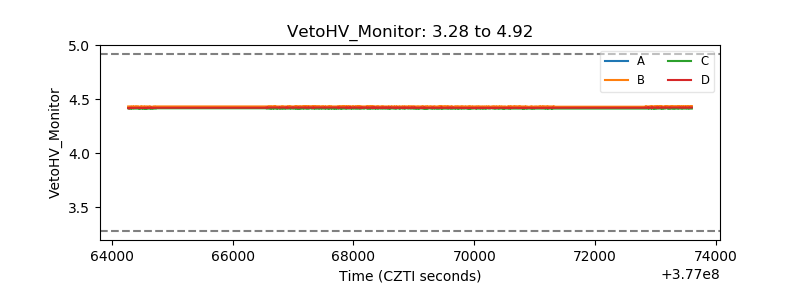 |
| Veto LLD | 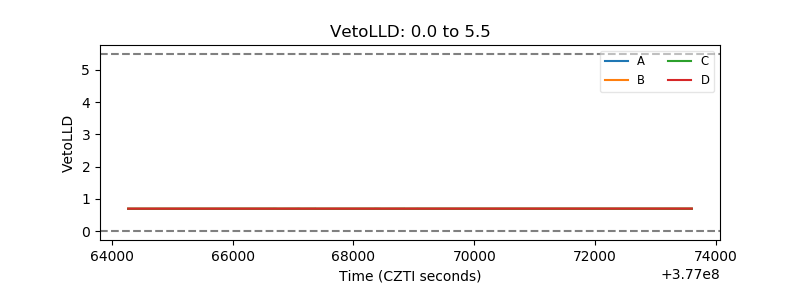 |
| Alpha Counter | 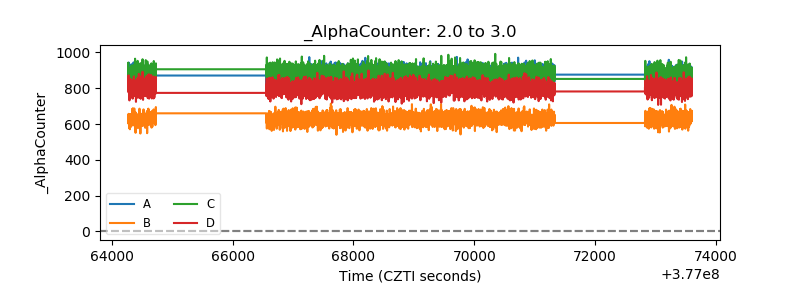 |
| _CPM_Rate | 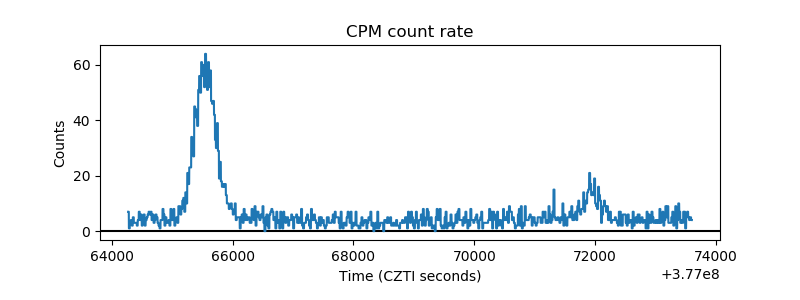 |
| CZT Counter | 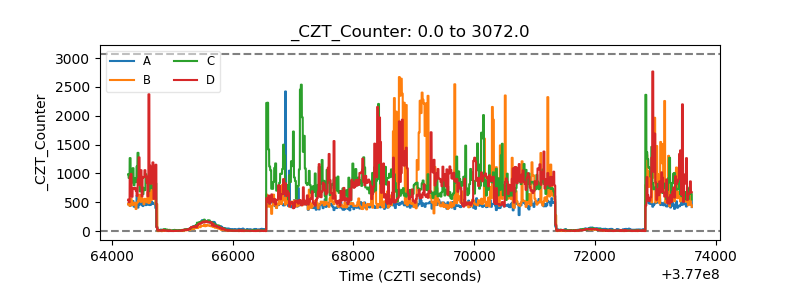 |
| +2.5 Volts monitor | 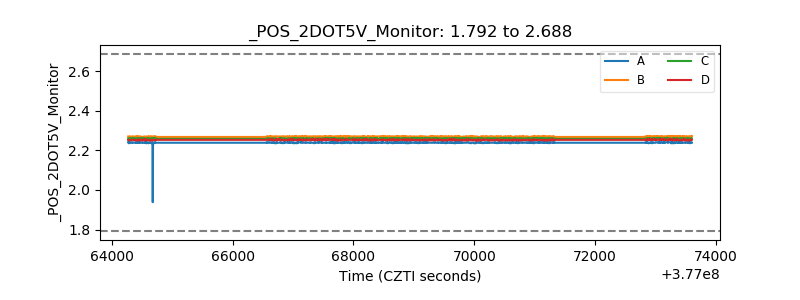 |
| +5 Volts monitor | 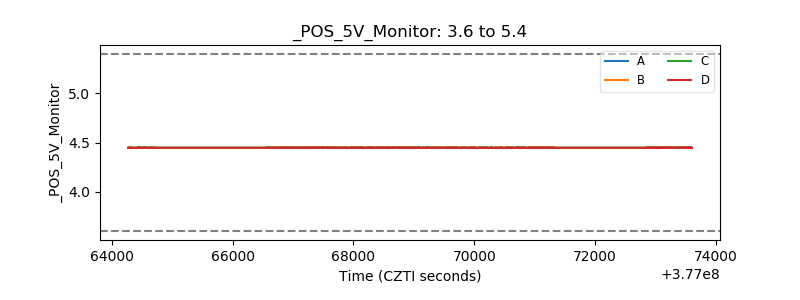 |
| _ROLL_ROT | 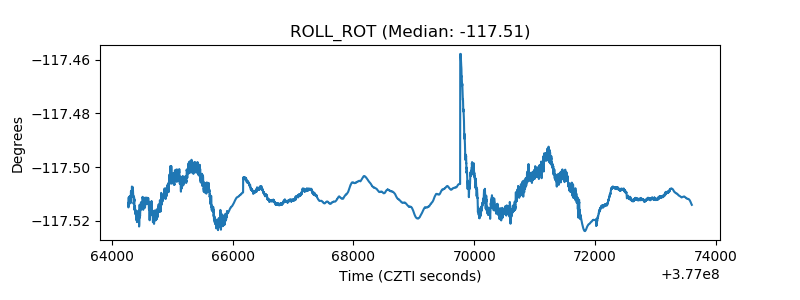 |
| _Roll_DEC | 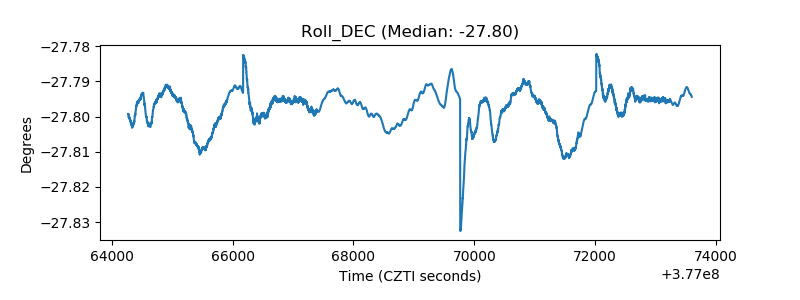 |
| _Roll_RA | 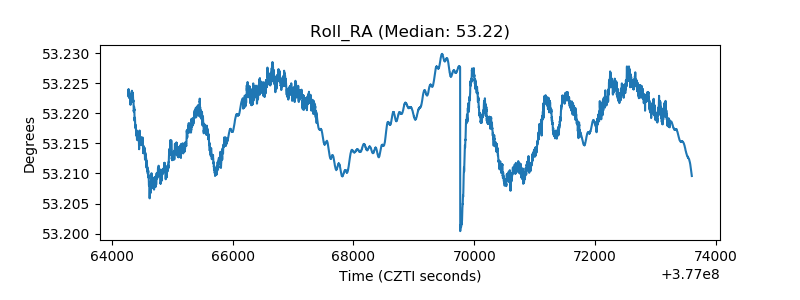 |
| Veto Counter | 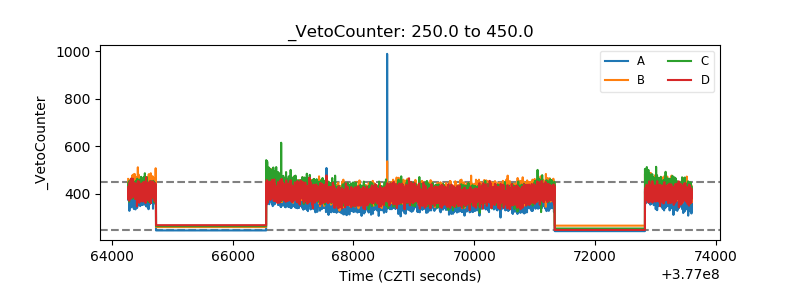 |