| Param | Original file | Final file |
|---|---|---|
| Filename | modeM0/AS1A11_060T01_9000004808_33573cztM0_level2.evt | modeM0/AS1A11_060T01_9000004808_33573cztM0_level2_quad_clean.evt |
| Size (bytes) | 567,457,920 | 68,086,080 |
| Size | 541.2 MB | 64.9 MB |
| Events in quadrant A | 3,268,905 | 421,121 |
| Events in quadrant B | 3,964,164 | 414,203 |
| Events in quadrant C | 4,634,811 | 415,877 |
| Events in quadrant D | 4,914,479 | 393,846 |
| Mode M0 | |||
|---|---|---|---|
| Quadrant | BADHDUFLAG | Total packets | Discarded packets |
| A | 0 | 13559 | 2 |
| B | 0 | 15564 | 1 |
| C | 0 | 18270 | 1 |
| D | 0 | 18617 | 1 |
| Mode M9 | |||
|---|---|---|---|
| Quadrant | BADHDUFLAG | Total packets | Discarded packets |
| A | 0 | 28 | 0 |
| B | 0 | 28 | 0 |
| C | 0 | 28 | 0 |
| D | 0 | 28 | 0 |
| Mode SS | |||
|---|---|---|---|
| Quadrant | BADHDUFLAG | Total packets | Discarded packets |
| A | 0 | 122 | 0 |
| B | 0 | 122 | 0 |
| C | 0 | 122 | 0 |
| D | 0 | 122 | 0 |
| Quadrant | Total seconds | Saturated seconds | Saturation percentage |
|---|---|---|---|
| A | 5964 | 12 | 0.201207% |
| B | 5964 | 299 | 5.013414% |
| C | 5964 | 140 | 2.347418% |
| D | 5964 | 306 | 5.130785% |
Noise dominated data is calculated using 1-second bins in cleaned event files. If a bin has >2000 counts, and if more than 50% of those come from <1% of pixels, then it is considered to be noise-dominated and hence unusable.
| Quadrant | # 1 sec bins | Bins with >0 counts | Bins with >2000 counts | High rate bins dominated by noise | Noise dominated (total time) | Noise dominated (detector-on time) | Marked lightcurve |
|---|---|---|---|---|---|---|---|
| A | 8772 | 5966 | 2 | 2 | 0.02% | 0.03% | 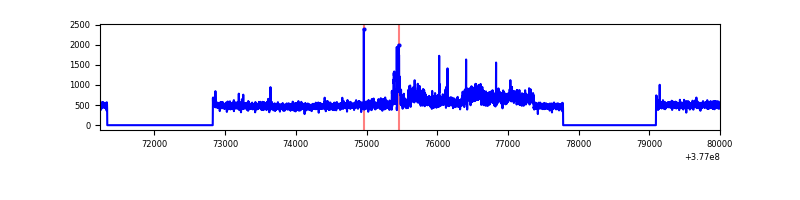 |
| B | 8772 | 5966 | 253 | 253 | 2.88% | 4.24% | 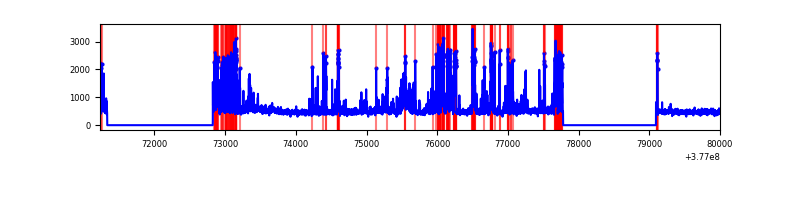 |
| C | 8772 | 5966 | 111 | 111 | 1.27% | 1.86% | 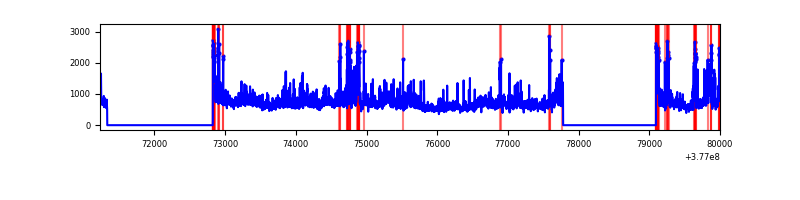 |
| D | 8772 | 5966 | 240 | 240 | 2.74% | 4.02% | 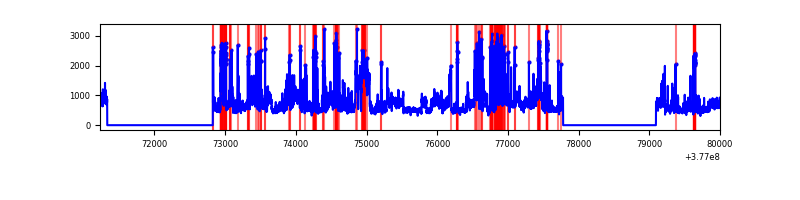 |
Top three noisy pixels from each quadrant. If the there are fewer than three noisy pixels in the level2.evt file, extra rows are filled as -1
| Pixel properties | Quadrant properties | ||||||
|---|---|---|---|---|---|---|---|
| Quadrant | DetID | PixID | Counts | Sigma | Mean | Median | Sigma |
| A | 15 | 169 | 567336 | 4058.18 | 696 | 682 | 139.6 |
| A | 13 | 254 | 10964 | 73.64 | 696 | 682 | 139.6 |
| A | 3 | 137 | 6981 | 45.11 | 696 | 682 | 139.6 |
| B | 5 | 172 | 994047 | 7529.65 | 681 | 662 | 131.9 |
| B | 5 | 255 | 116933 | 881.31 | 681 | 662 | 131.9 |
| B | 15 | 222 | 71425 | 536.37 | 681 | 662 | 131.9 |
| C | 3 | 233 | 1487905 | 9489.9 | 674 | 678 | 156.7 |
| C | 15 | 214 | 253614 | 1613.97 | 674 | 678 | 156.7 |
| C | 0 | 10 | 176840 | 1124.08 | 674 | 678 | 156.7 |
| D | 8 | 195 | 1266854 | 7758.44 | 663 | 644 | 163.2 |
| D | 2 | 250 | 414899 | 2538.26 | 663 | 644 | 163.2 |
| D | 13 | 249 | 397831 | 2433.68 | 663 | 644 | 163.2 |
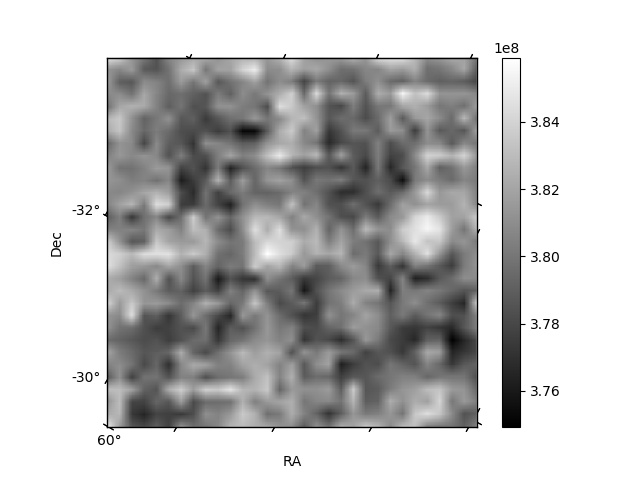
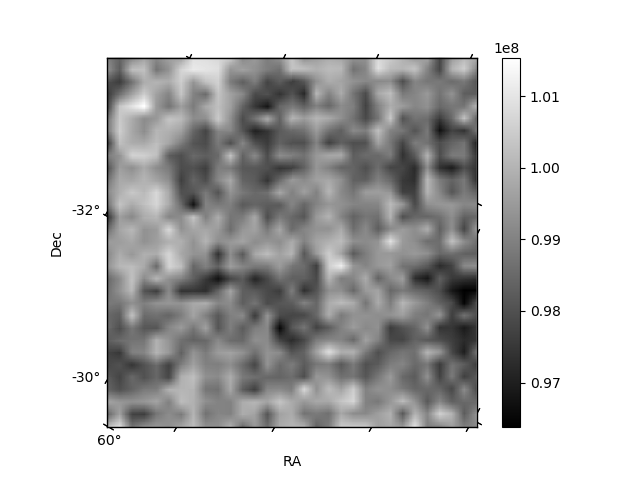
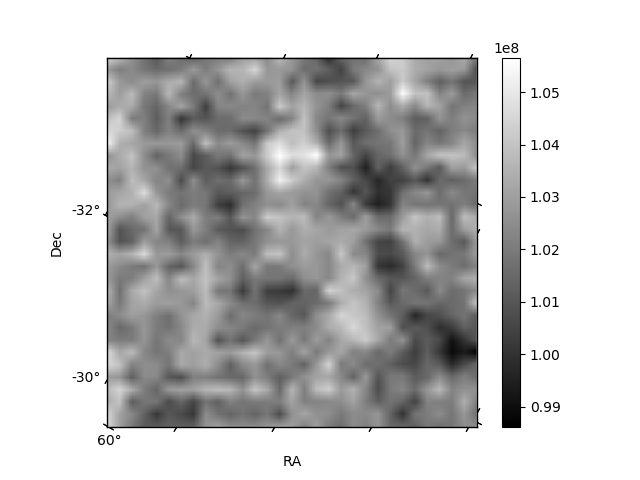
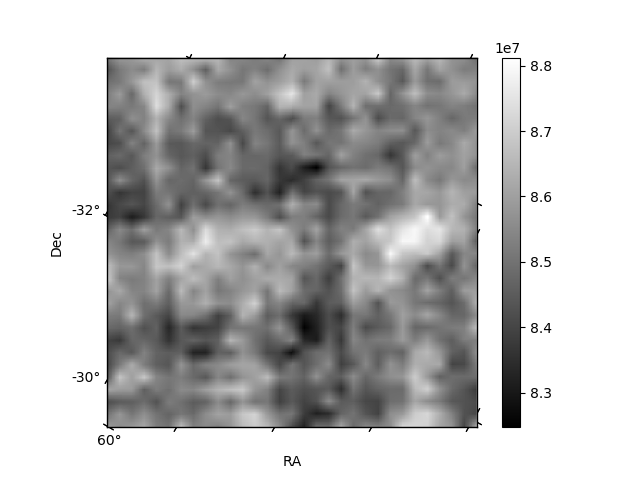
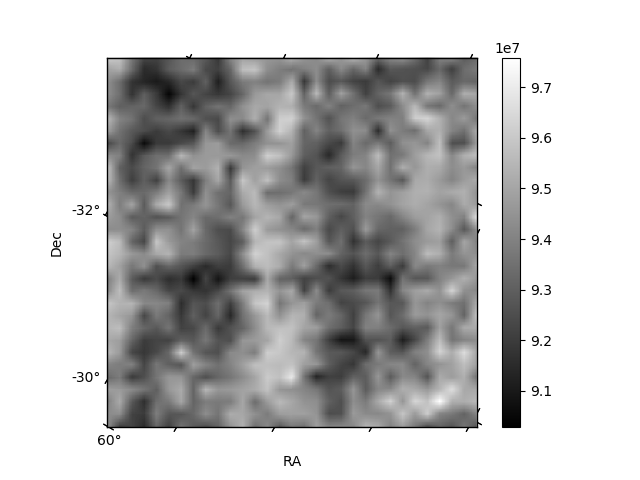
Histogram calculated using DETX and DETY for each event in the final _common_clean file
| Quadrant A | 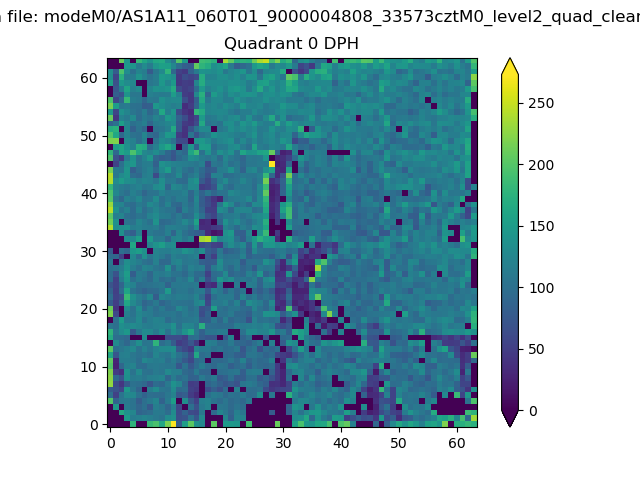 |
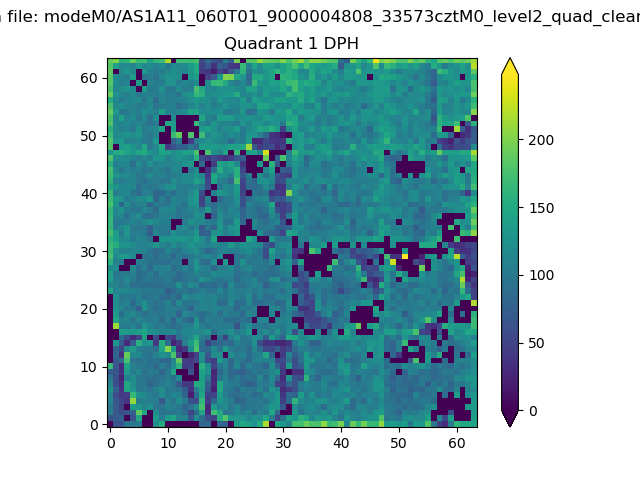 |
Quadrant B |
|---|---|---|---|
| Quadrant D | 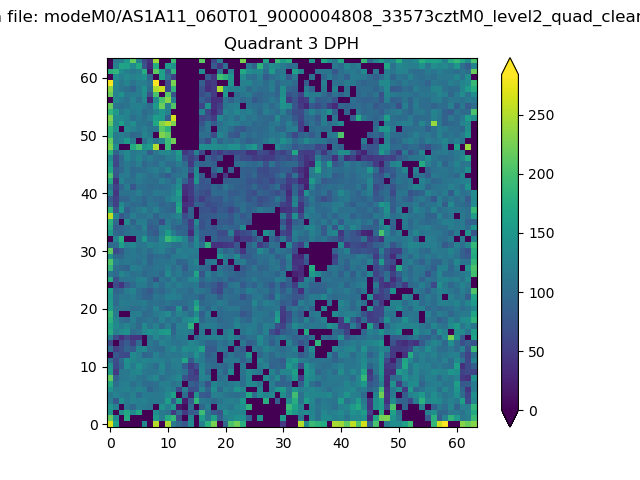 |
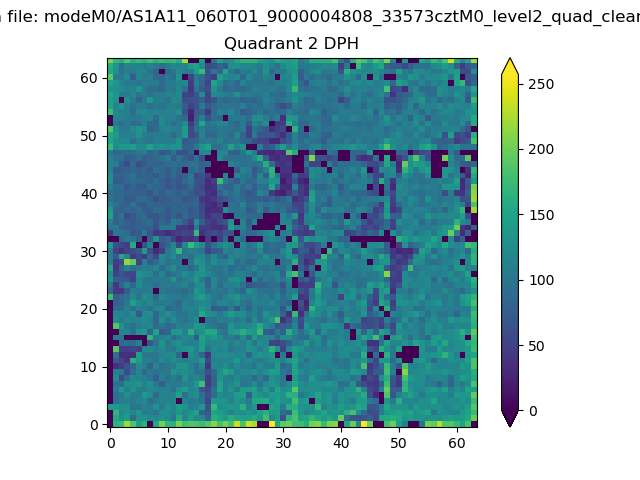 |
Quadrant C |
| Plot type | Count rate plots | Images |
|---|---|---|
| Comparison with Poisson distribution Blue bars denote a histogram of data divided into 1 sec bins. Red curve is a Poisson curve with rate = median count rate of data. |
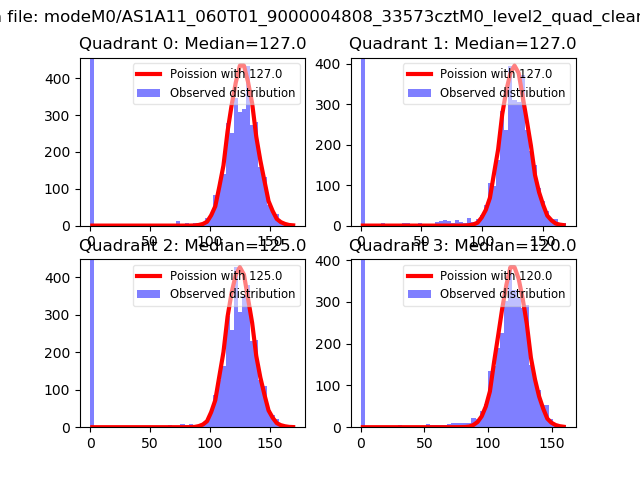 |
 |
| Quadrant-wise count rates Data is divided into 100 sec bins |
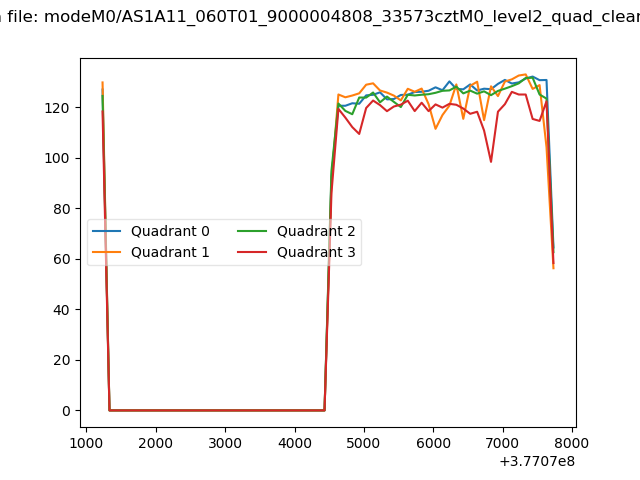 |
|
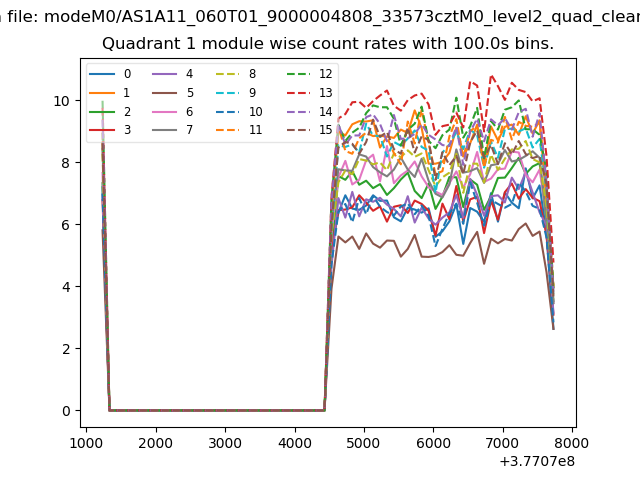
| Module-wise count rates for Quadrant A Data is divided into 100 sec bins |
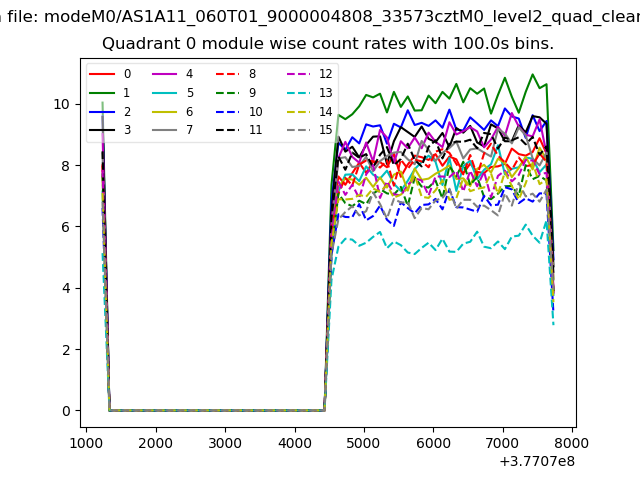 |
 |
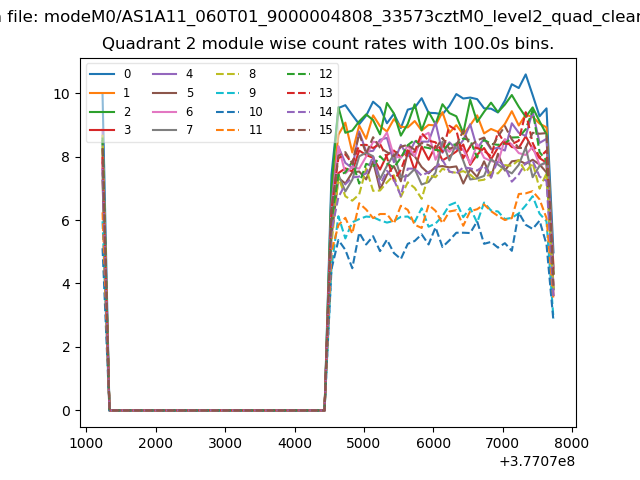
| Module-wise count rates for Quadrant B Data is divided into 100 sec bins |
 |
 |
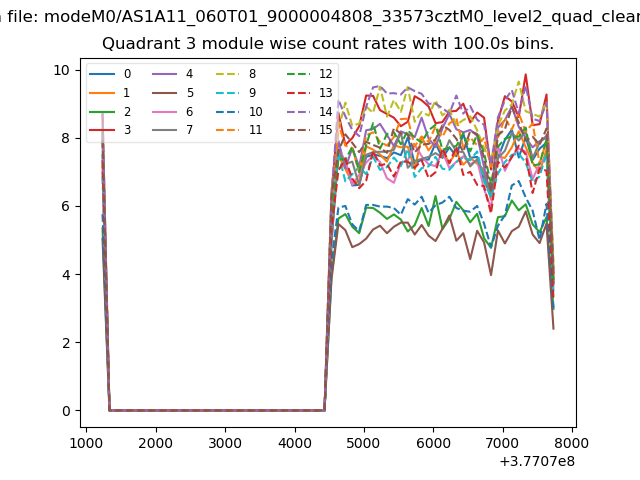
| Module-wise count rates for Quadrant C Data is divided into 100 sec bins |
 |
 |
| Module-wise count rates for Quadrant D Data is divided into 100 sec bins |
 |
 |
| Parameter | Plot |
|---|---|
| CZT HV Monitor | 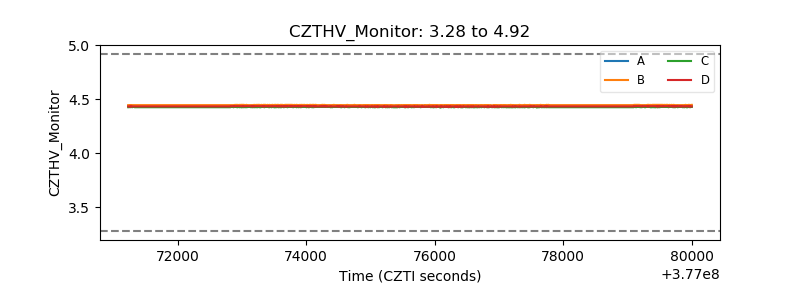 |
| D_VDD | 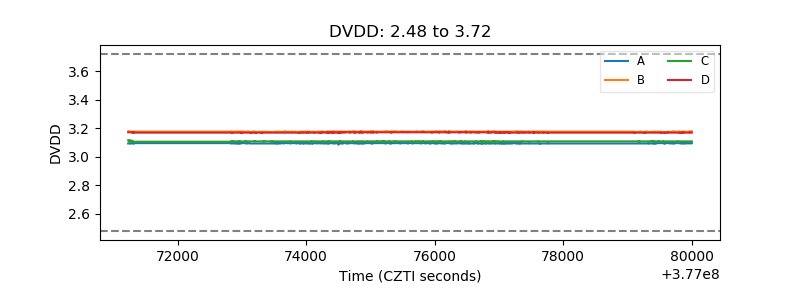 |
| Temperature 1 |  |
| Veto HV Monitor | 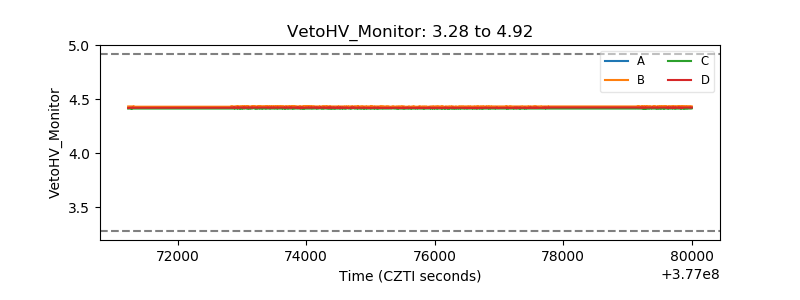 |
| Veto LLD | 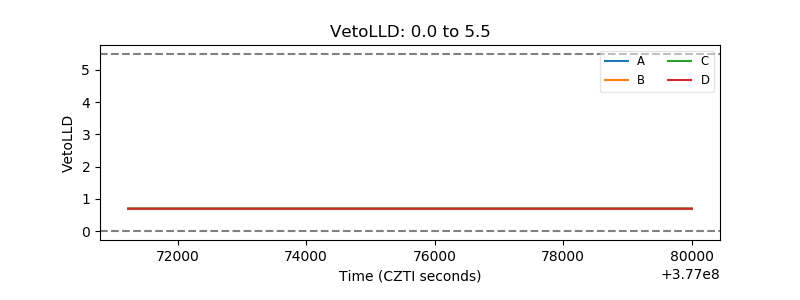 |
| Alpha Counter | 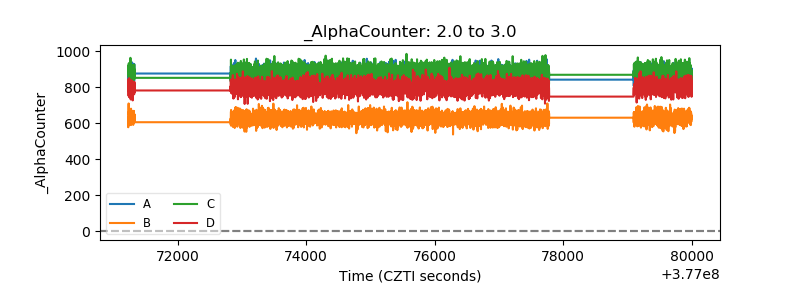 |
| _CPM_Rate | 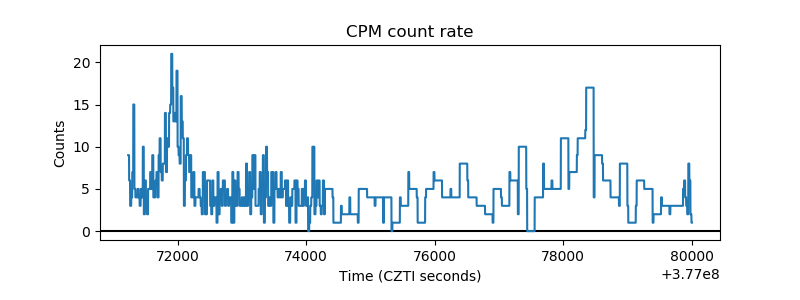 |
| CZT Counter | 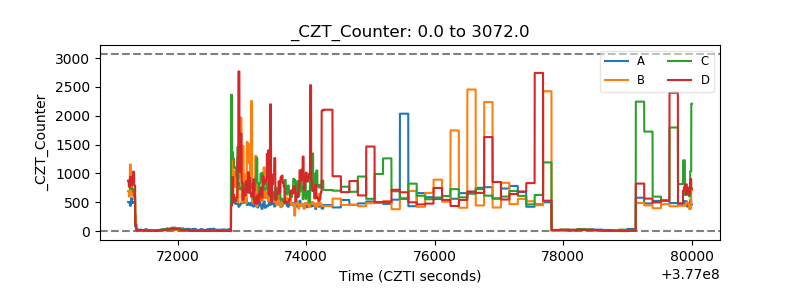 |
| +2.5 Volts monitor |  |
| +5 Volts monitor | 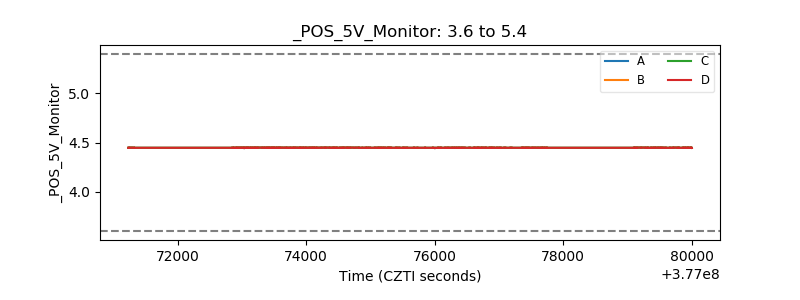 |
| _ROLL_ROT |  |
| _Roll_DEC |  |
| _Roll_RA | 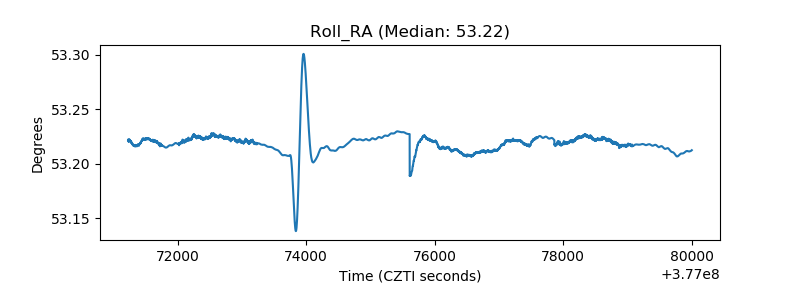 |
| Veto Counter | 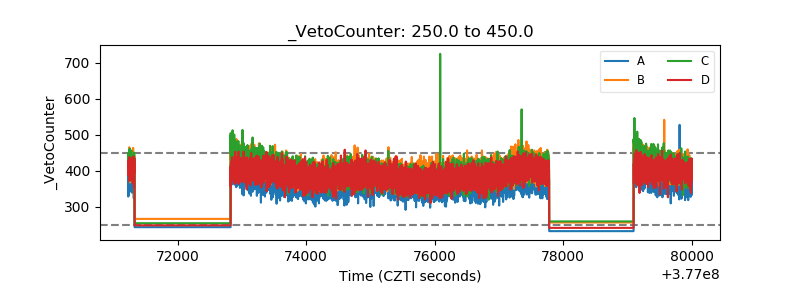 |