| Param | Original file | Final file |
|---|---|---|
| Filename | modeM0/AS1A11_060T01_9000004808_33575cztM0_level2.evt | modeM0/AS1A11_060T01_9000004808_33575cztM0_level2_quad_clean.evt |
| Size (bytes) | 324,472,320 | 56,105,280 |
| Size | 309.4 MB | 53.5 MB |
| Events in quadrant A | 1,808,829 | 382,246 |
| Events in quadrant B | 2,627,895 | 356,222 |
| Events in quadrant C | 2,539,138 | 356,711 |
| Events in quadrant D | 2,597,635 | 341,283 |
| Mode M0 | |||
|---|---|---|---|
| Quadrant | BADHDUFLAG | Total packets | Discarded packets |
| A | 0 | 13216 | 5548 |
| B | 0 | 17305 | 7065 |
| C | 0 | 18416 | 8397 |
| D | 0 | 18772 | 8502 |
| Mode M9 | |||
|---|---|---|---|
| Quadrant | BADHDUFLAG | Total packets | Discarded packets |
| A | 0 | 25 | 12 |
| B | 0 | 23 | 10 |
| C | 0 | 24 | 16 |
| D | 0 | 28 | 16 |
| Mode SS | |||
|---|---|---|---|
| Quadrant | BADHDUFLAG | Total packets | Discarded packets |
| A | 0 | 130 | 46 |
| B | 0 | 137 | 63 |
| C | 0 | 137 | 55 |
| D | 0 | 140 | 64 |
| Quadrant | Total seconds | Saturated seconds | Saturation percentage |
|---|---|---|---|
| A | 3797 | 3 | 0.079010% |
| B | 3720 | 263 | 7.069892% |
| C | 3609 | 36 | 0.997506% |
| D | 3639 | 160 | 4.396812% |
Noise dominated data is calculated using 1-second bins in cleaned event files. If a bin has >2000 counts, and if more than 50% of those come from <1% of pixels, then it is considered to be noise-dominated and hence unusable.
| Quadrant | # 1 sec bins | Bins with >0 counts | Bins with >2000 counts | High rate bins dominated by noise | Noise dominated (total time) | Noise dominated (detector-on time) | Marked lightcurve |
|---|---|---|---|---|---|---|---|
| A | 10260 | 4169 | 0 | 0 | 0.00% | 0.00% | 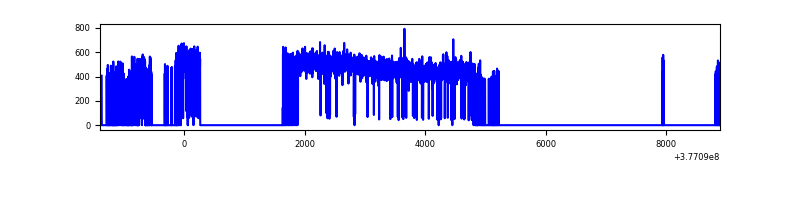 |
| B | 10270 | 4080 | 217 | 217 | 2.11% | 5.32% | 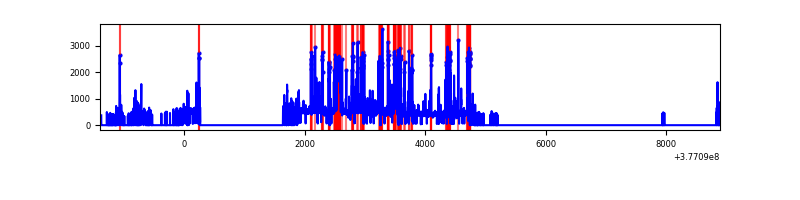 |
| C | 10293 | 3996 | 30 | 30 | 0.29% | 0.75% | 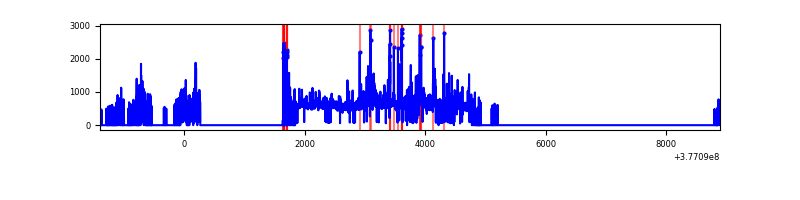 |
| D | 10284 | 3996 | 150 | 150 | 1.46% | 3.75% | 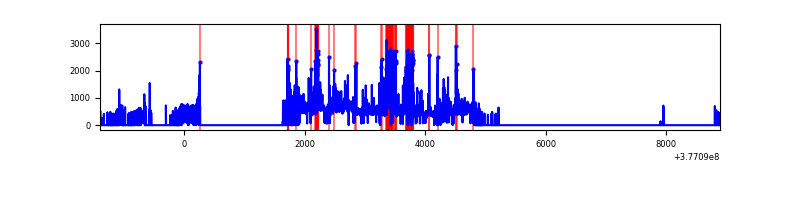 |
Top three noisy pixels from each quadrant. If the there are fewer than three noisy pixels in the level2.evt file, extra rows are filled as -1
| Pixel properties | Quadrant properties | ||||||
|---|---|---|---|---|---|---|---|
| Quadrant | DetID | PixID | Counts | Sigma | Mean | Median | Sigma |
| A | 15 | 169 | 112133 | 1246.4 | 437 | 429 | 89.6 |
| A | 13 | 254 | 6904 | 72.25 | 437 | 429 | 89.6 |
| A | 3 | 137 | 4445 | 44.81 | 437 | 429 | 89.6 |
| B | 5 | 172 | 835821 | 10202.85 | 413 | 402 | 81.9 |
| B | 5 | 255 | 71747 | 871.33 | 413 | 402 | 81.9 |
| B | 5 | 200 | 22304 | 267.49 | 413 | 402 | 81.9 |
| C | 3 | 233 | 744036 | 7982.96 | 396 | 399 | 93.2 |
| C | 15 | 214 | 151192 | 1618.77 | 396 | 399 | 93.2 |
| C | 0 | 10 | 59170 | 630.91 | 396 | 399 | 93.2 |
| D | 10 | 118 | 348692 | 3541.61 | 396 | 385 | 98.3 |
| D | 8 | 195 | 299973 | 3046.23 | 396 | 385 | 98.3 |
| D | 2 | 250 | 150502 | 1526.4 | 396 | 385 | 98.3 |
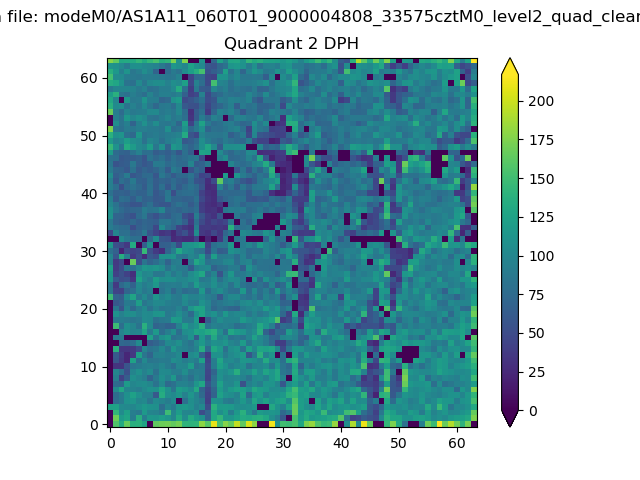
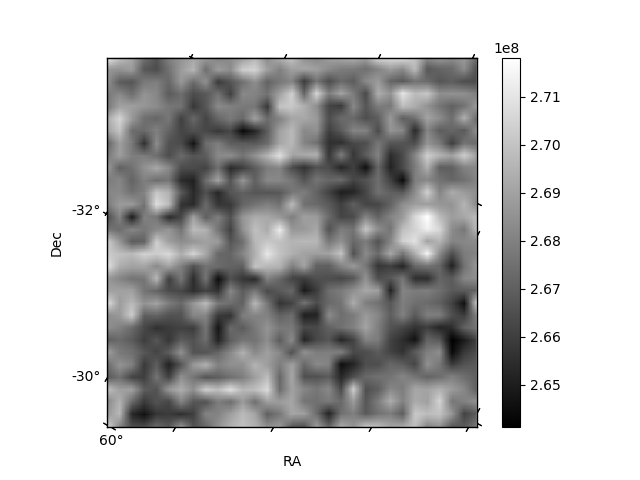
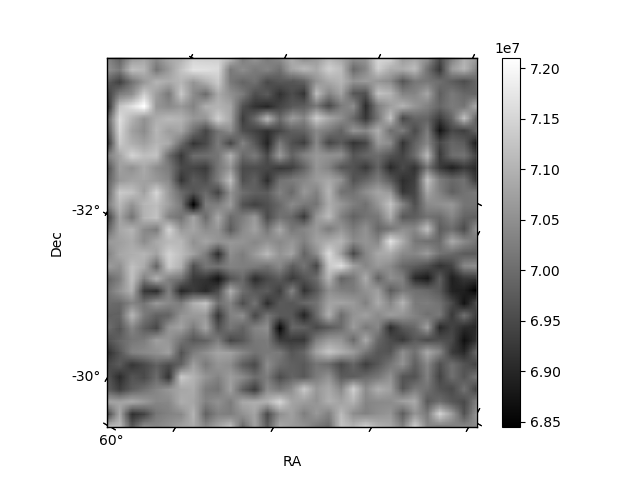
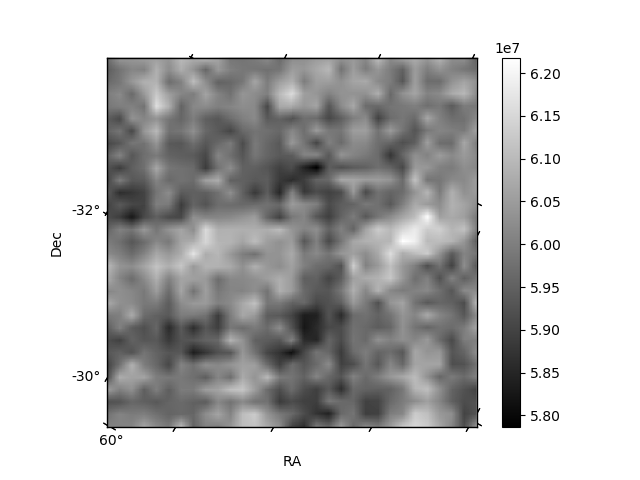
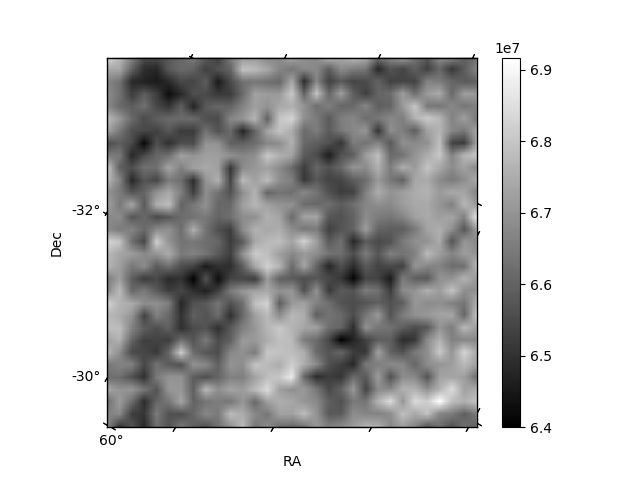
Histogram calculated using DETX and DETY for each event in the final _common_clean file
| Quadrant A | 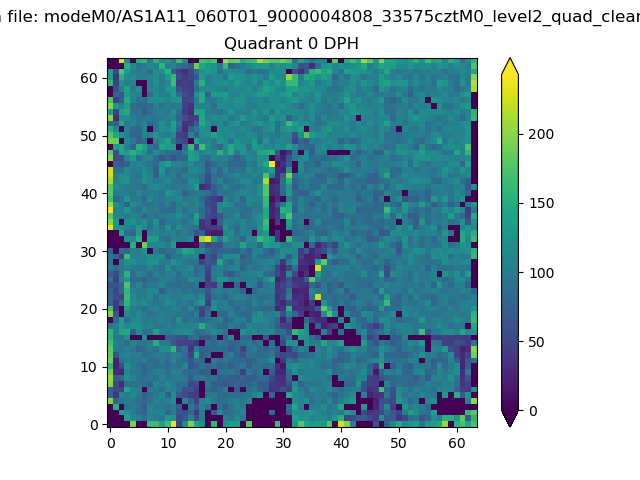 |
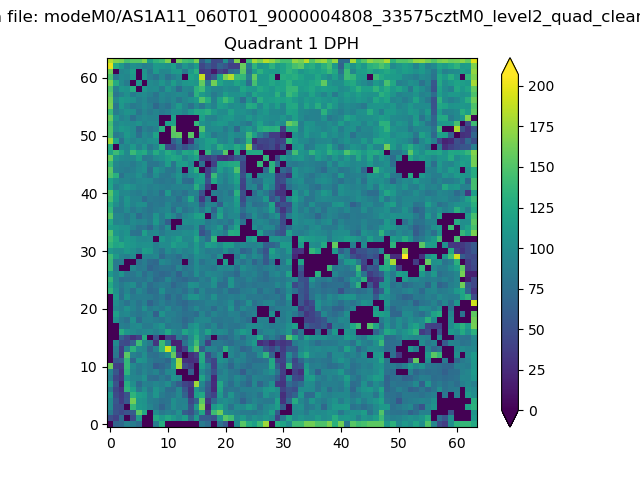 |
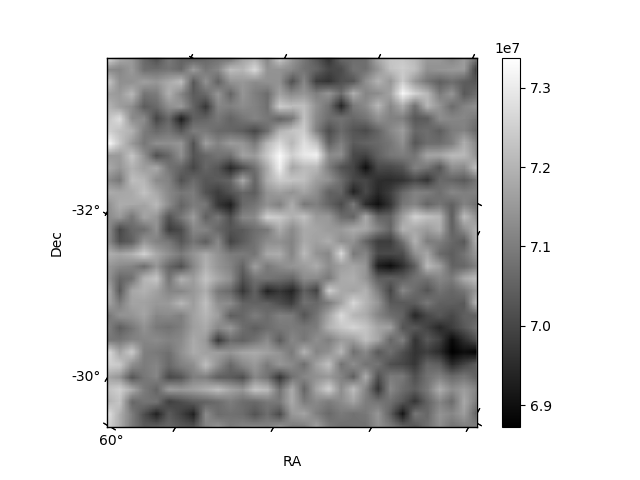
Quadrant B |
|---|---|---|---|
| Quadrant D | 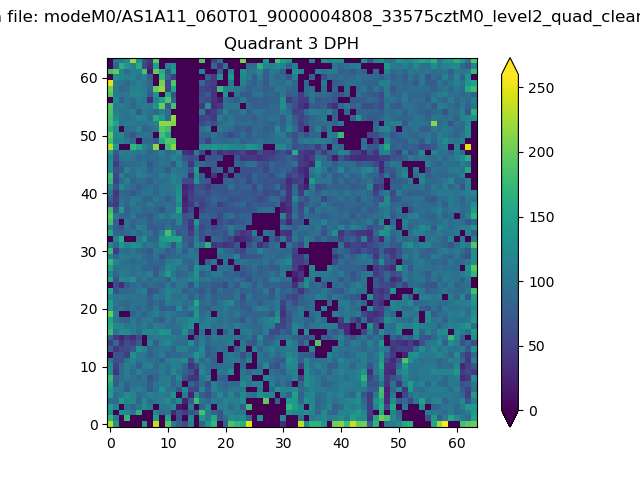 |
 |
Quadrant C |
| Plot type | Count rate plots | Images |
|---|---|---|
| Comparison with Poisson distribution Blue bars denote a histogram of data divided into 1 sec bins. Red curve is a Poisson curve with rate = median count rate of data. |
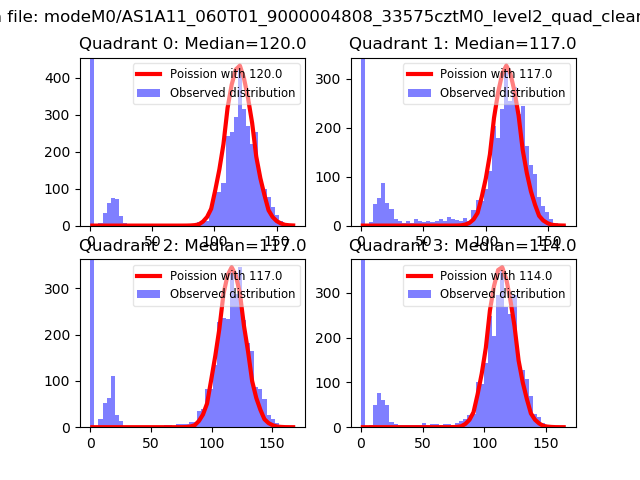 |
 |
| Quadrant-wise count rates Data is divided into 100 sec bins |
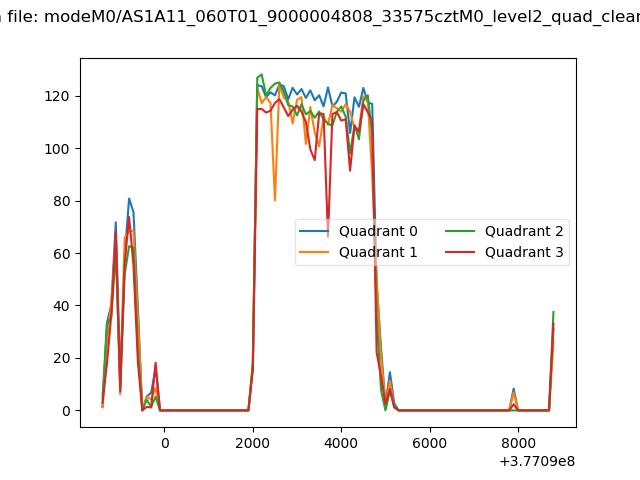 |
|
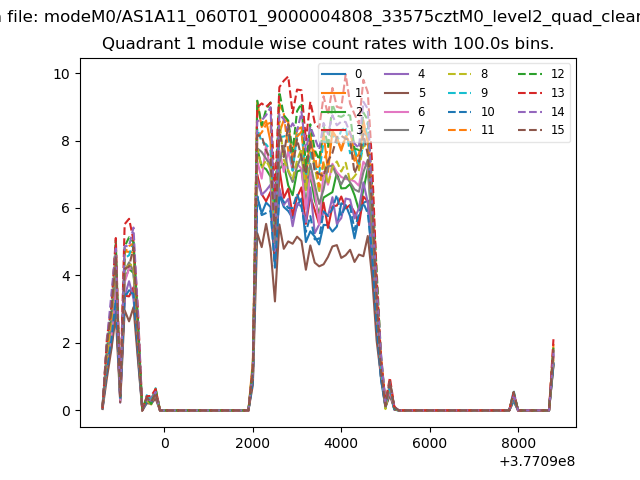
| Module-wise count rates for Quadrant A Data is divided into 100 sec bins |
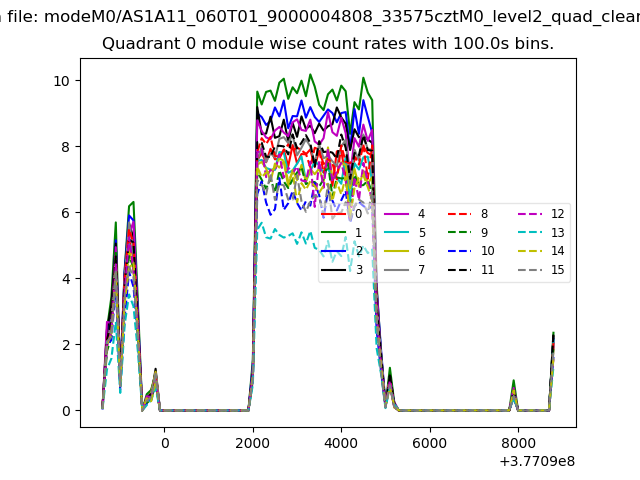 |
 |
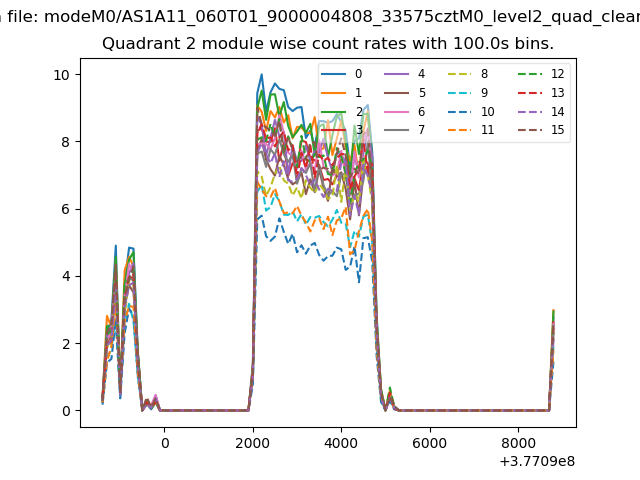
| Module-wise count rates for Quadrant B Data is divided into 100 sec bins |
 |
 |
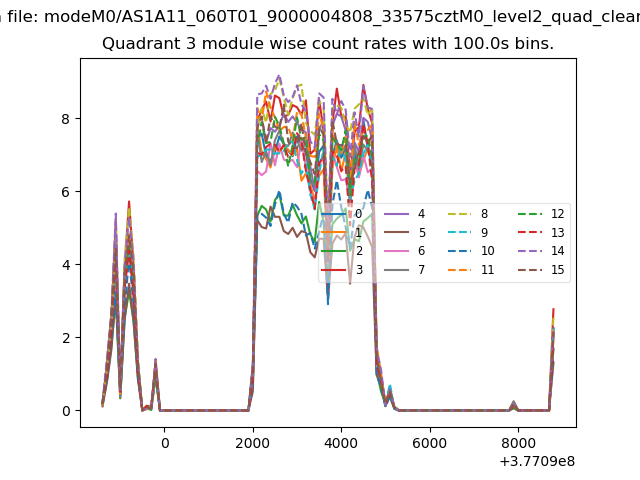
| Module-wise count rates for Quadrant C Data is divided into 100 sec bins |
 |
 |
| Module-wise count rates for Quadrant D Data is divided into 100 sec bins |
 |
 |
| Parameter | Plot |
|---|---|
| CZT HV Monitor | 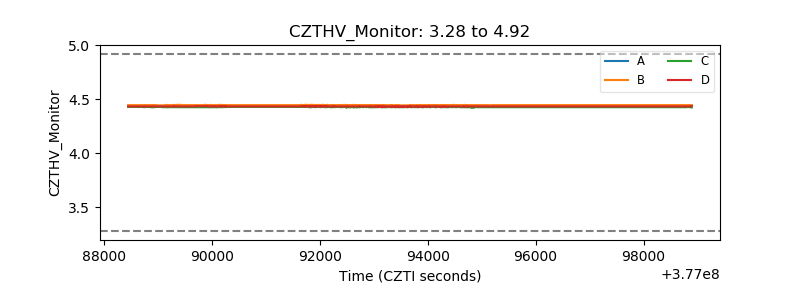 |
| D_VDD | 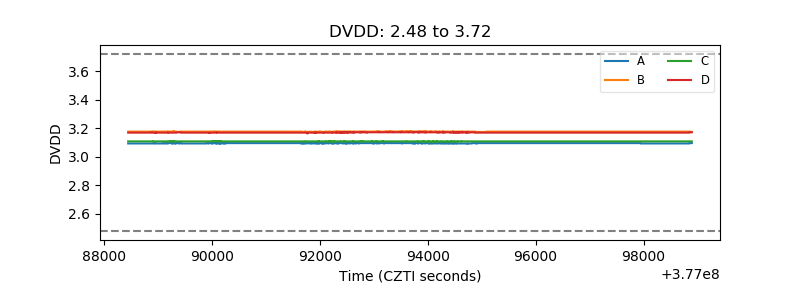 |
| Temperature 1 |  |
| Veto HV Monitor | 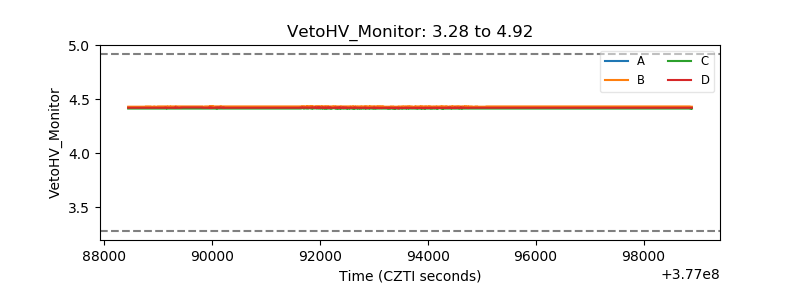 |
| Veto LLD | 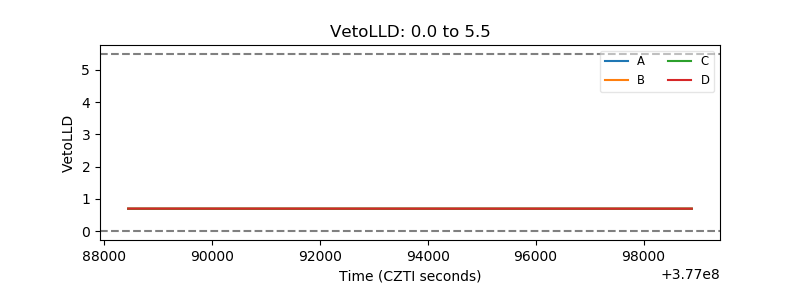 |
| Alpha Counter | 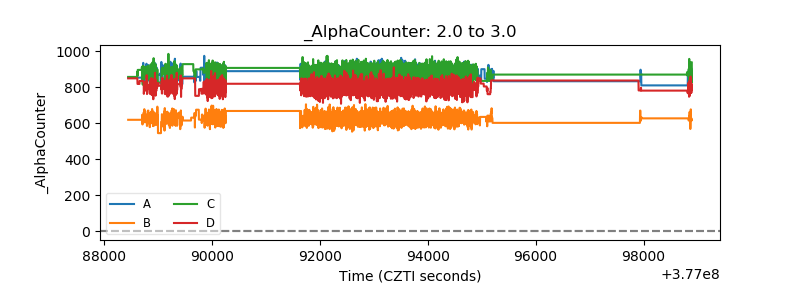 |
| _CPM_Rate | 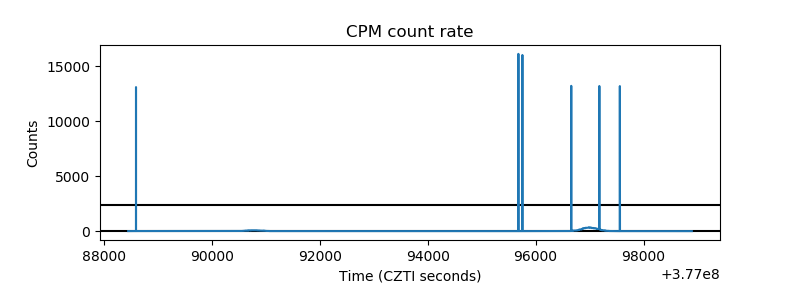 |
| CZT Counter | 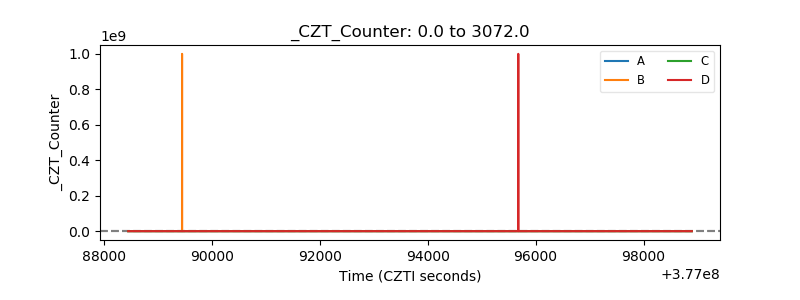 |
| +2.5 Volts monitor |  |
| +5 Volts monitor |  |
| _ROLL_ROT | 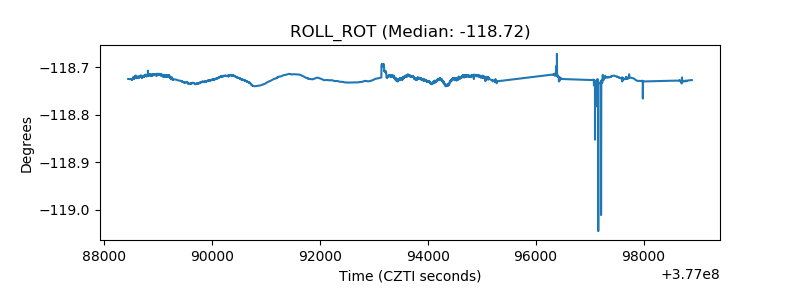 |
| _Roll_DEC |  |
| _Roll_RA | 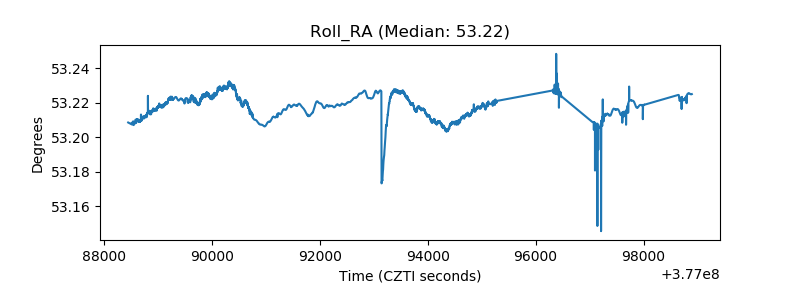 |
| Veto Counter | 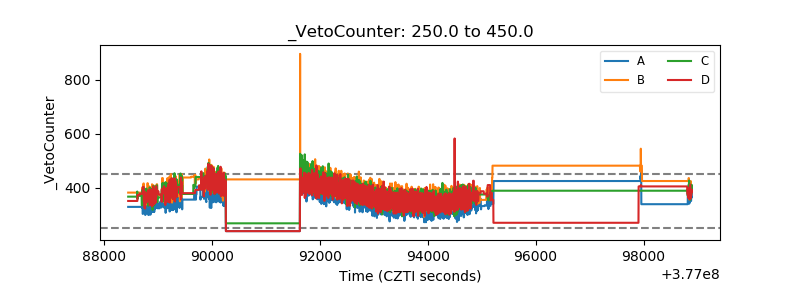 |