| Param | Original file | Final file |
|---|---|---|
| Filename | modeM0/AS1A11_060T01_9000004808_33576cztM0_level2.evt | modeM0/AS1A11_060T01_9000004808_33576cztM0_level2_quad_clean.evt |
| Size (bytes) | 944,366,400 | 156,009,600 |
| Size | 900.6 MB | 148.8 MB |
| Events in quadrant A | 5,204,166 | 1,029,231 |
| Events in quadrant B | 7,222,548 | 999,322 |
| Events in quadrant C | 7,678,171 | 1,001,689 |
| Events in quadrant D | 7,773,637 | 954,192 |
| Mode M0 | |||
|---|---|---|---|
| Quadrant | BADHDUFLAG | Total packets | Discarded packets |
| A | 0 | 21722 | 4 |
| B | 0 | 28314 | 3 |
| C | 0 | 30197 | 3 |
| D | 0 | 30549 | 3 |
| Mode M9 | |||
|---|---|---|---|
| Quadrant | BADHDUFLAG | Total packets | Discarded packets |
| A | 0 | 32 | 0 |
| B | 0 | 32 | 0 |
| C | 0 | 32 | 0 |
| D | 0 | 33 | 0 |
| Mode SS | |||
|---|---|---|---|
| Quadrant | BADHDUFLAG | Total packets | Discarded packets |
| A | 0 | 218 | 0 |
| B | 0 | 218 | 0 |
| C | 0 | 218 | 0 |
| D | 0 | 218 | 0 |
| Quadrant | Total seconds | Saturated seconds | Saturation percentage |
|---|---|---|---|
| A | 10692 | 14 | 0.130939% |
| B | 10692 | 624 | 5.836139% |
| C | 10692 | 229 | 2.141788% |
| D | 10692 | 451 | 4.218107% |
Noise dominated data is calculated using 1-second bins in cleaned event files. If a bin has >2000 counts, and if more than 50% of those come from <1% of pixels, then it is considered to be noise-dominated and hence unusable.
| Quadrant | # 1 sec bins | Bins with >0 counts | Bins with >2000 counts | High rate bins dominated by noise | Noise dominated (total time) | Noise dominated (detector-on time) | Marked lightcurve |
|---|---|---|---|---|---|---|---|
| A | 13528 | 10694 | 0 | 0 | 0.00% | 0.00% |  |
| B | 13528 | 10694 | 469 | 469 | 3.47% | 4.39% | 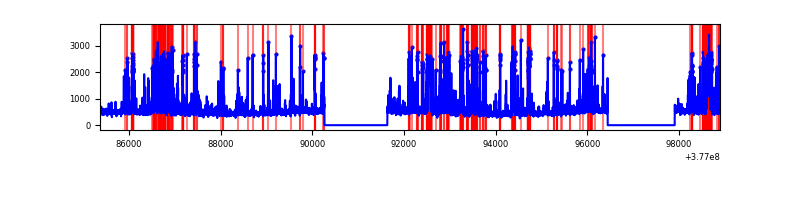 |
| C | 13528 | 10694 | 181 | 181 | 1.34% | 1.69% | 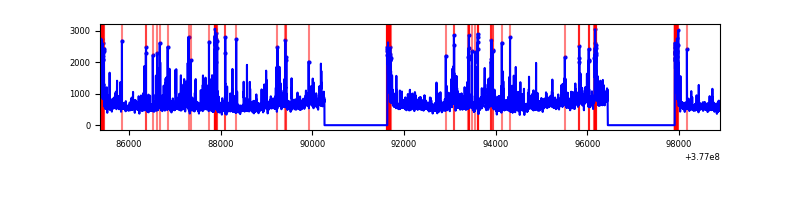 |
| D | 13528 | 10694 | 400 | 400 | 2.96% | 3.74% | 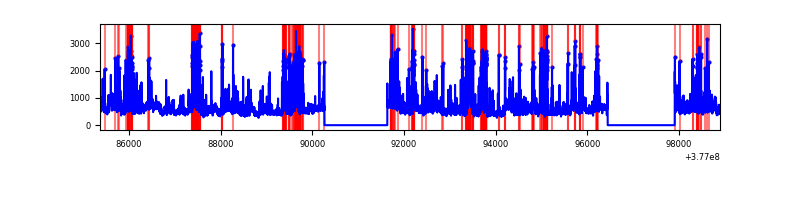 |
Top three noisy pixels from each quadrant. If the there are fewer than three noisy pixels in the level2.evt file, extra rows are filled as -1
| Pixel properties | Quadrant properties | ||||||
|---|---|---|---|---|---|---|---|
| Quadrant | DetID | PixID | Counts | Sigma | Mean | Median | Sigma |
| A | 15 | 169 | 325592 | 1279.76 | 1258 | 1231 | 253.5 |
| A | 13 | 254 | 19021 | 70.19 | 1258 | 1231 | 253.5 |
| A | 3 | 137 | 13046 | 46.62 | 1258 | 1231 | 253.5 |
| B | 5 | 172 | 1948170 | 8188.71 | 1229 | 1196 | 237.8 |
| B | 5 | 255 | 121860 | 507.49 | 1229 | 1196 | 237.8 |
| B | 0 | 190 | 92004 | 381.92 | 1229 | 1196 | 237.8 |
| C | 3 | 233 | 1843422 | 6571.19 | 1209 | 1220 | 280.3 |
| C | 15 | 214 | 450652 | 1603.14 | 1209 | 1220 | 280.3 |
| C | 0 | 10 | 393991 | 1401.03 | 1209 | 1220 | 280.3 |
| D | 8 | 195 | 946165 | 3201.63 | 1203 | 1169 | 295.2 |
| D | 2 | 250 | 712343 | 2409.45 | 1203 | 1169 | 295.2 |
| D | 13 | 249 | 411218 | 1389.24 | 1203 | 1169 | 295.2 |
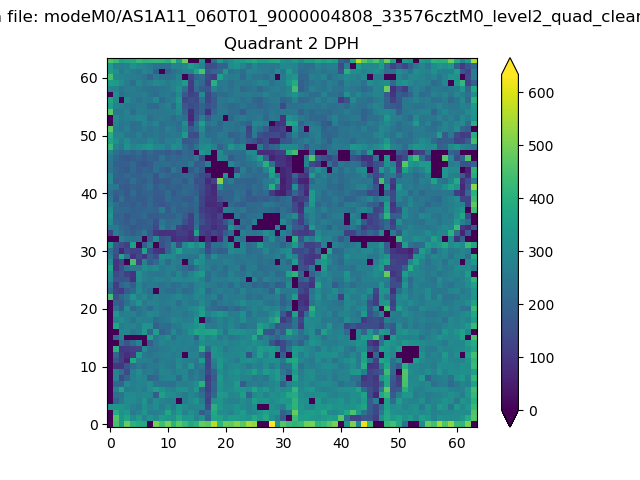
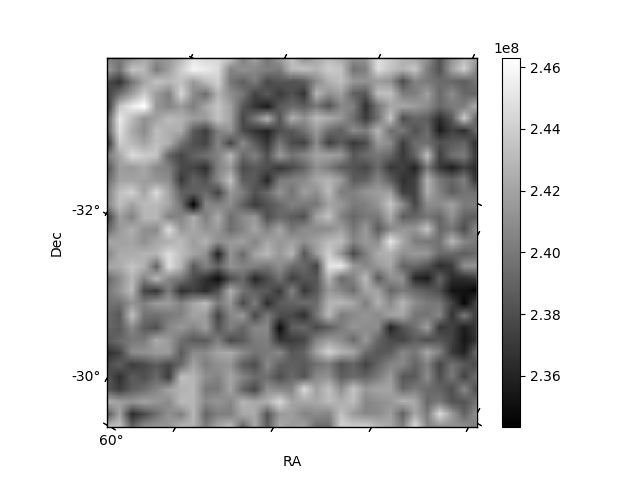
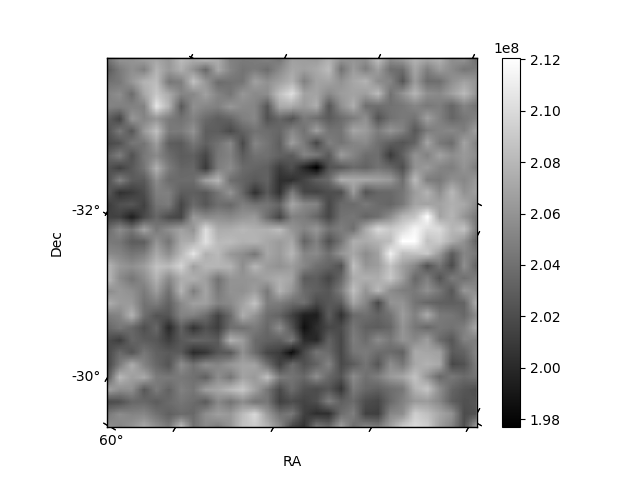
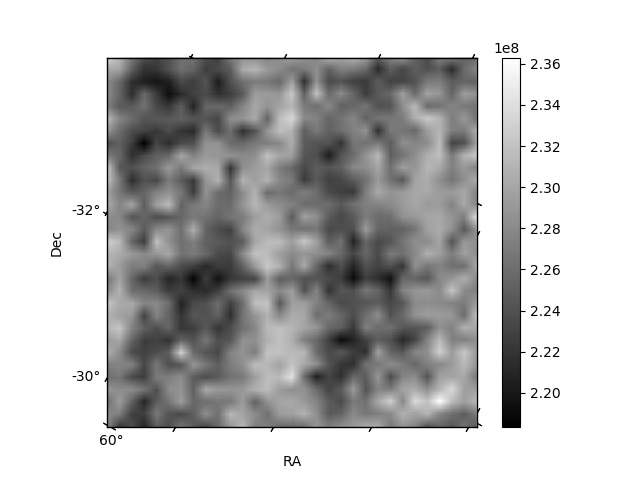
Histogram calculated using DETX and DETY for each event in the final _common_clean file
| Quadrant A | 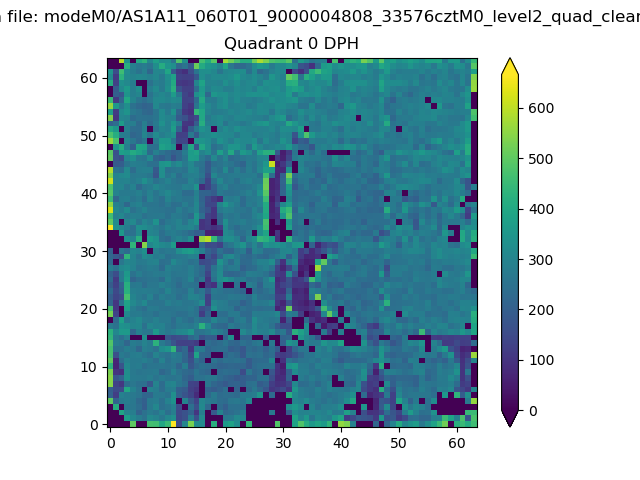 |
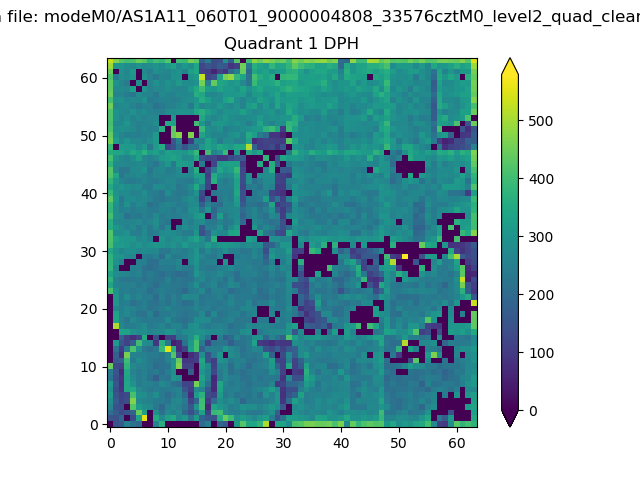 |
Quadrant B |
|---|---|---|---|
| Quadrant D | 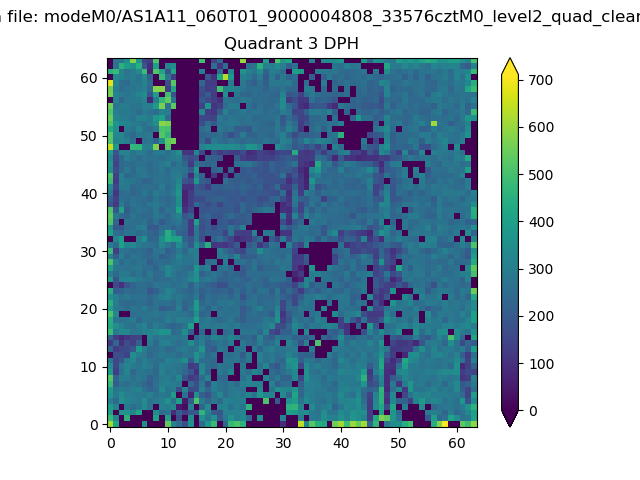 |
 |
Quadrant C |
| Plot type | Count rate plots | Images |
|---|---|---|
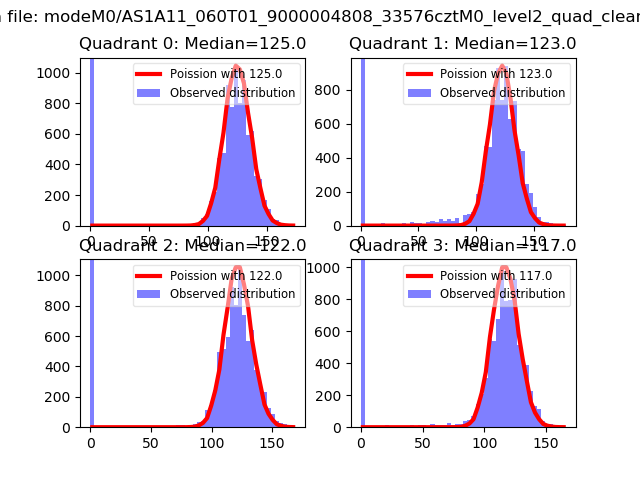
| Comparison with Poisson distribution Blue bars denote a histogram of data divided into 1 sec bins. Red curve is a Poisson curve with rate = median count rate of data. |
 |
 |
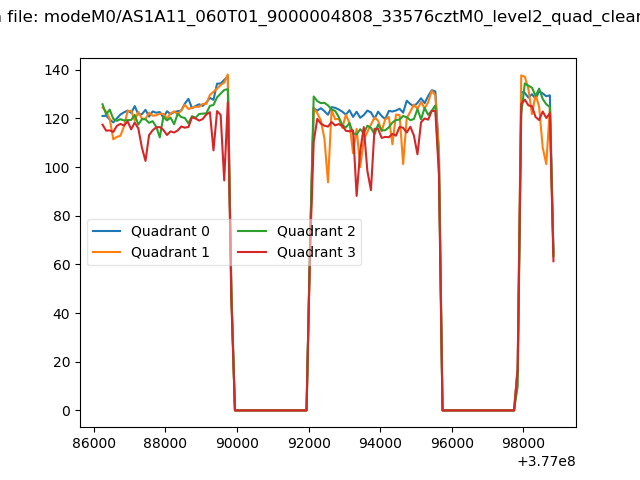
| Quadrant-wise count rates Data is divided into 100 sec bins |
 |
|
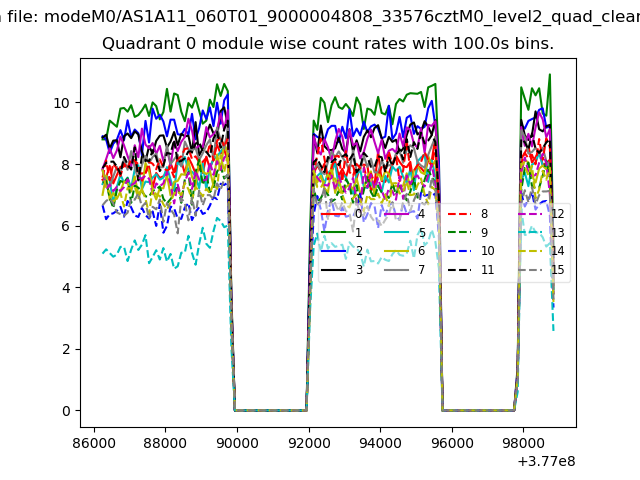
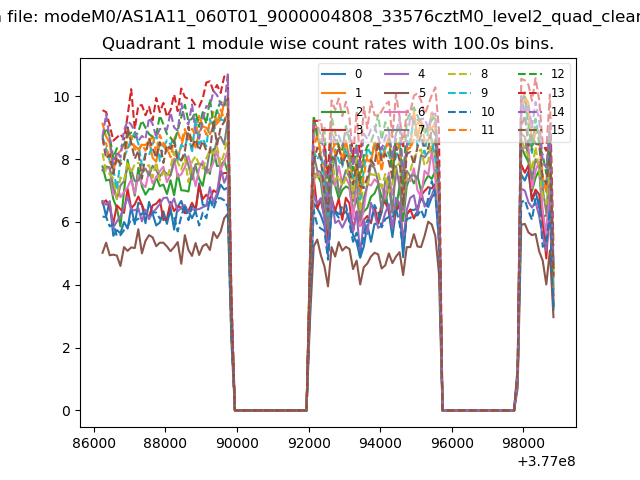
| Module-wise count rates for Quadrant A Data is divided into 100 sec bins |
 |
 |
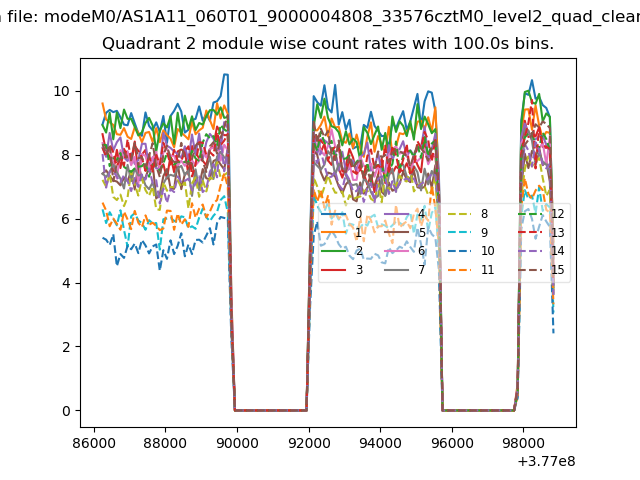
| Module-wise count rates for Quadrant B Data is divided into 100 sec bins |
 |
 |
| Module-wise count rates for Quadrant C Data is divided into 100 sec bins |
 |
 |
| Module-wise count rates for Quadrant D Data is divided into 100 sec bins |
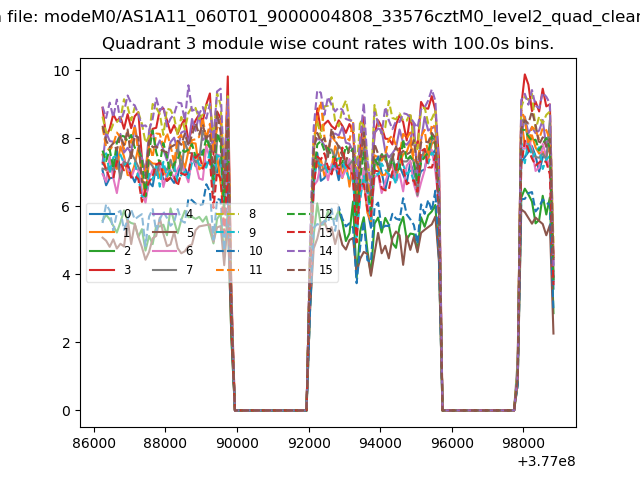 |
 |
| Parameter | Plot |
|---|---|
| CZT HV Monitor | 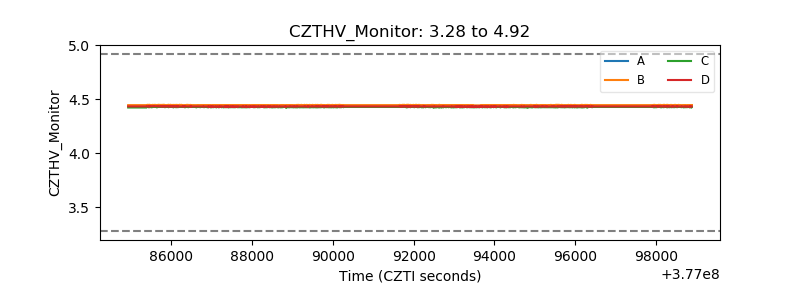 |
| D_VDD | 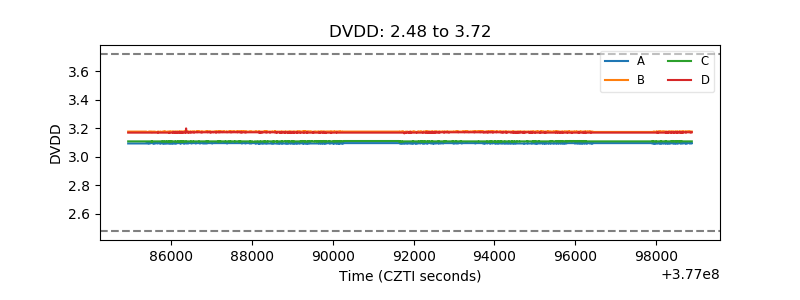 |
| Temperature 1 | 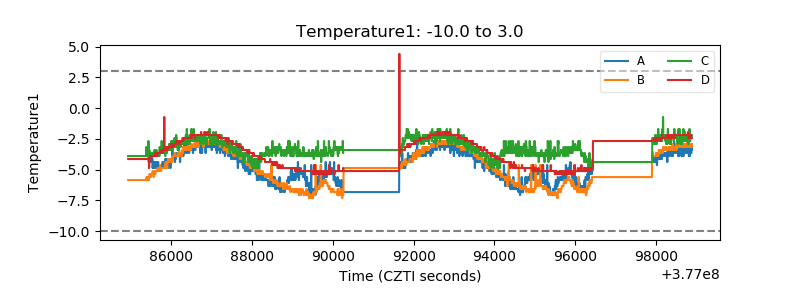 |
| Veto HV Monitor | 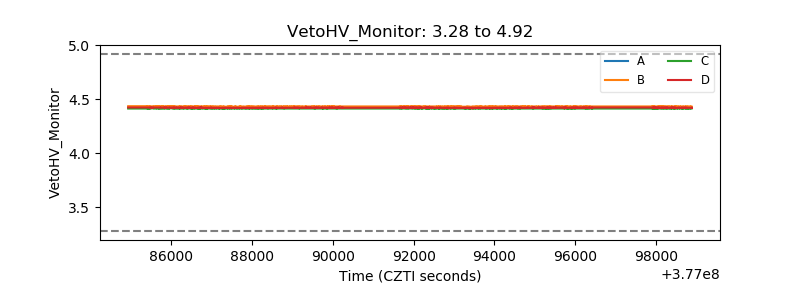 |
| Veto LLD | 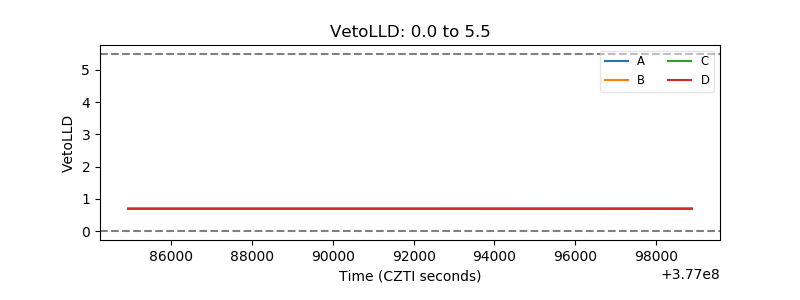 |
| Alpha Counter | 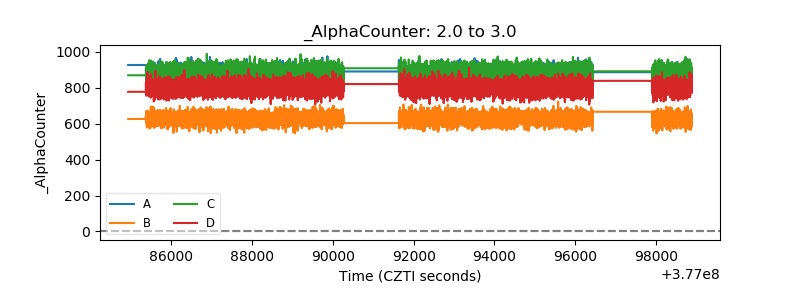 |
| _CPM_Rate | 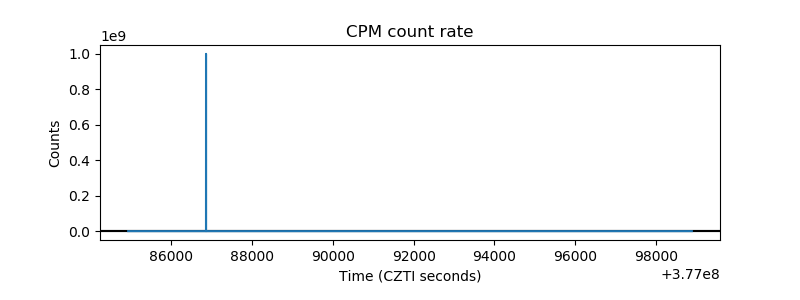 |
| CZT Counter | 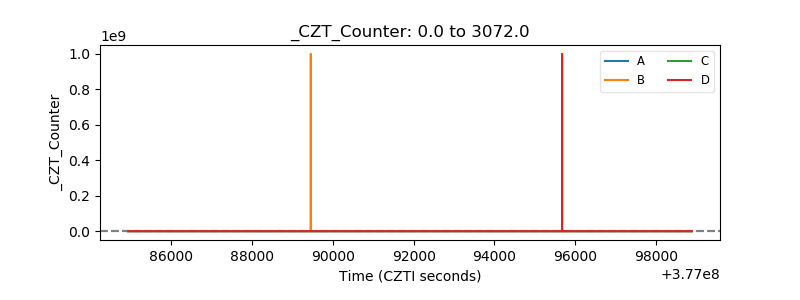 |
| +2.5 Volts monitor |  |
| +5 Volts monitor |  |
| _ROLL_ROT | 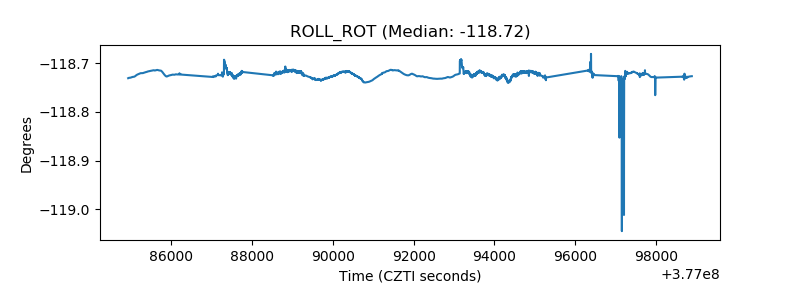 |
| _Roll_DEC |  |
| _Roll_RA | 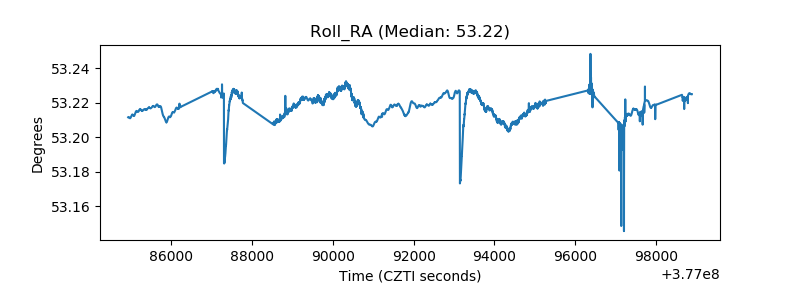 |
| Veto Counter | 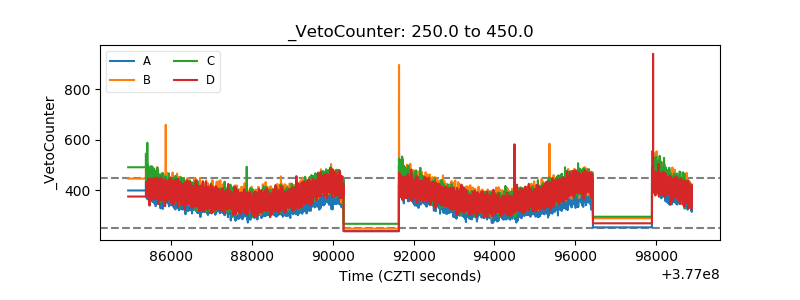 |