| Param | Original file | Final file |
|---|---|---|
| Filename | modeM0/AS1A11_060T01_9000004808_33577cztM0_level2.evt | modeM0/AS1A11_060T01_9000004808_33577cztM0_level2_quad_clean.evt |
| Size (bytes) | 550,978,560 | 88,295,040 |
| Size | 525.5 MB | 84.2 MB |
| Events in quadrant A | 2,812,134 | 589,361 |
| Events in quadrant B | 4,757,382 | 567,149 |
| Events in quadrant C | 4,530,184 | 567,719 |
| Events in quadrant D | 4,202,217 | 552,346 |
| Mode M0 | |||
|---|---|---|---|
| Quadrant | BADHDUFLAG | Total packets | Discarded packets |
| A | 0 | 11703 | 3 |
| B | 0 | 17954 | 2 |
| C | 0 | 17497 | 2 |
| D | 0 | 16612 | 2 |
| Mode M9 | |||
|---|---|---|---|
| Quadrant | BADHDUFLAG | Total packets | Discarded packets |
| A | 0 | 20 | 0 |
| B | 0 | 20 | 0 |
| C | 0 | 20 | 0 |
| D | 0 | 21 | 0 |
| Mode SS | |||
|---|---|---|---|
| Quadrant | BADHDUFLAG | Total packets | Discarded packets |
| A | 0 | 116 | 0 |
| B | 0 | 116 | 0 |
| C | 0 | 116 | 0 |
| D | 0 | 116 | 0 |
| Quadrant | Total seconds | Saturated seconds | Saturation percentage |
|---|---|---|---|
| A | 5678 | 9 | 0.158507% |
| B | 5678 | 670 | 11.799930% |
| C | 5678 | 188 | 3.311025% |
| D | 5678 | 182 | 3.205354% |
Noise dominated data is calculated using 1-second bins in cleaned event files. If a bin has >2000 counts, and if more than 50% of those come from <1% of pixels, then it is considered to be noise-dominated and hence unusable.
| Quadrant | # 1 sec bins | Bins with >0 counts | Bins with >2000 counts | High rate bins dominated by noise | Noise dominated (total time) | Noise dominated (detector-on time) | Marked lightcurve |
|---|---|---|---|---|---|---|---|
| A | 7261 | 5679 | 0 | 0 | 0.00% | 0.00% | 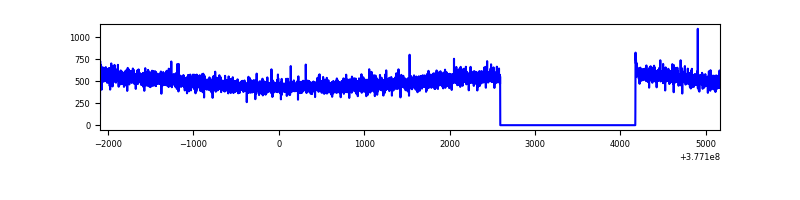 |
| B | 7261 | 5679 | 481 | 481 | 6.62% | 8.47% | 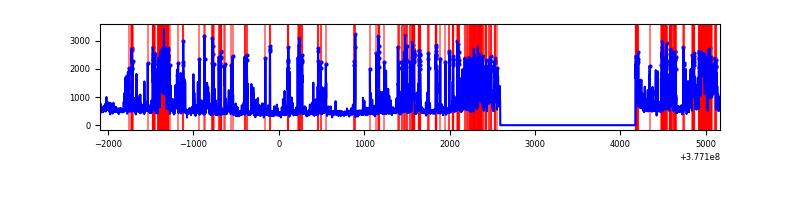 |
| C | 7261 | 5679 | 144 | 144 | 1.98% | 2.54% | 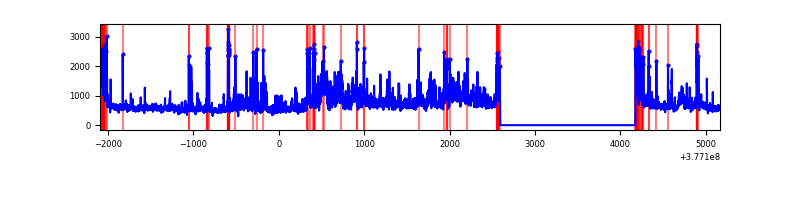 |
| D | 7261 | 5679 | 157 | 157 | 2.16% | 2.76% | 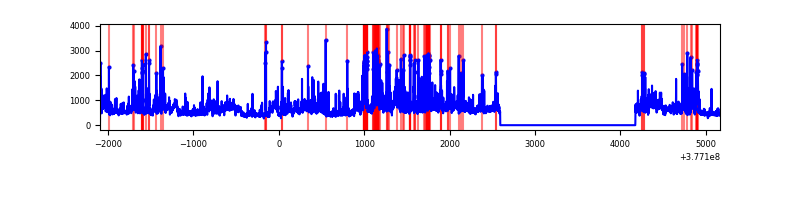 |
Top three noisy pixels from each quadrant. If the there are fewer than three noisy pixels in the level2.evt file, extra rows are filled as -1
| Pixel properties | Quadrant properties | ||||||
|---|---|---|---|---|---|---|---|
| Quadrant | DetID | PixID | Counts | Sigma | Mean | Median | Sigma |
| A | 15 | 169 | 188651 | 1377.07 | 676 | 662 | 136.5 |
| A | 13 | 254 | 10353 | 70.99 | 676 | 662 | 136.5 |
| A | 3 | 137 | 7049 | 46.79 | 676 | 662 | 136.5 |
| B | 5 | 172 | 1869197 | 14764.31 | 643 | 626 | 126.6 |
| B | 5 | 255 | 172318 | 1356.61 | 643 | 626 | 126.6 |
| B | 4 | 251 | 49101 | 383.02 | 643 | 626 | 126.6 |
| C | 3 | 233 | 1387226 | 9331.23 | 639 | 645 | 148.6 |
| C | 0 | 10 | 249172 | 1672.5 | 639 | 645 | 148.6 |
| C | 15 | 214 | 240807 | 1616.21 | 639 | 645 | 148.6 |
| D | 8 | 195 | 593812 | 3726.8 | 644 | 626 | 159.2 |
| D | 2 | 250 | 325120 | 2038.7 | 644 | 626 | 159.2 |
| D | 13 | 249 | 176610 | 1105.65 | 644 | 626 | 159.2 |
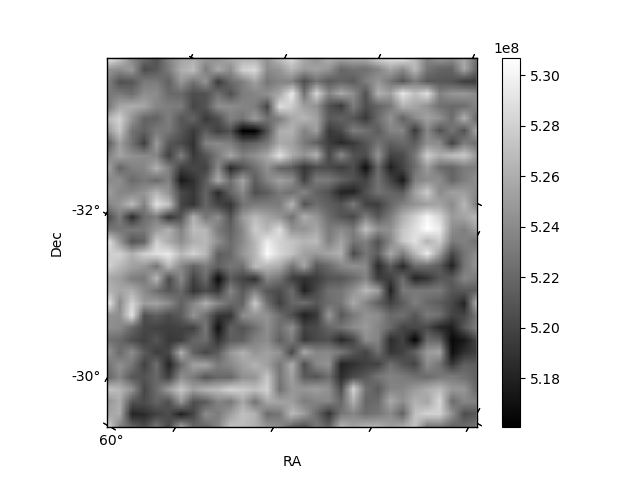
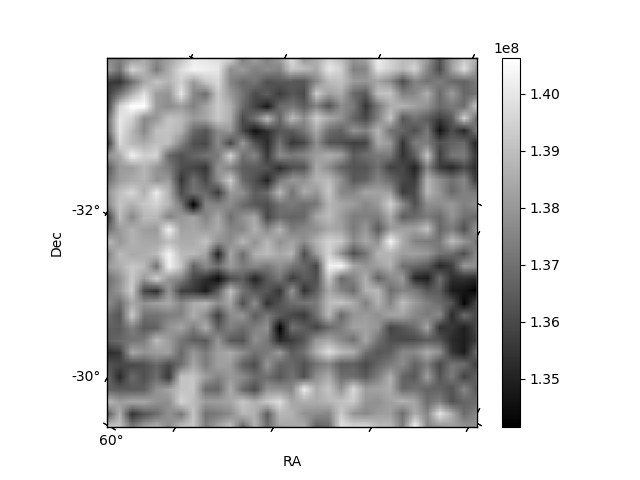
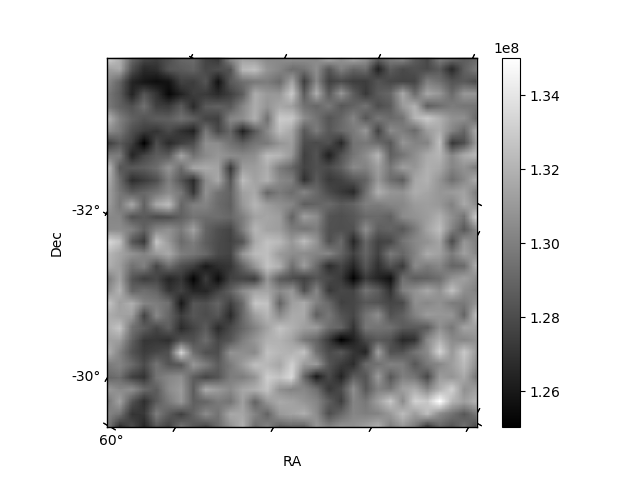
Histogram calculated using DETX and DETY for each event in the final _common_clean file
| Quadrant A | 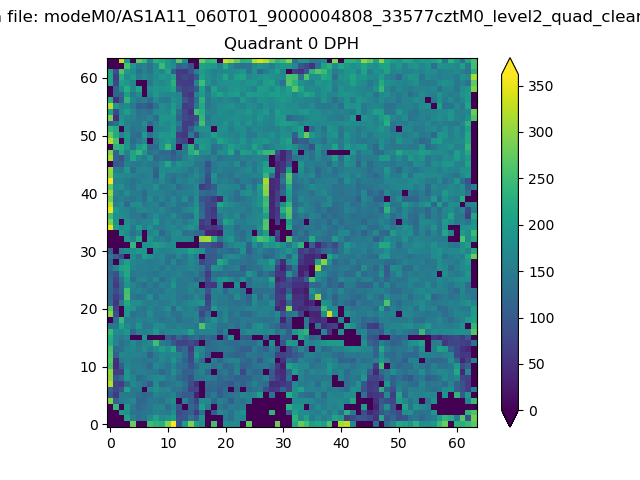 |
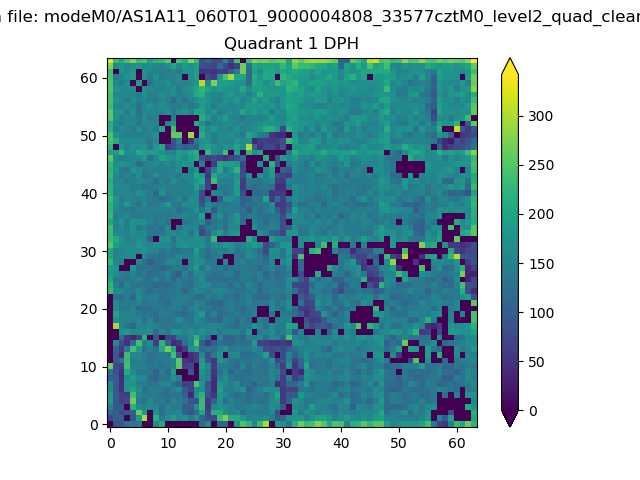 |
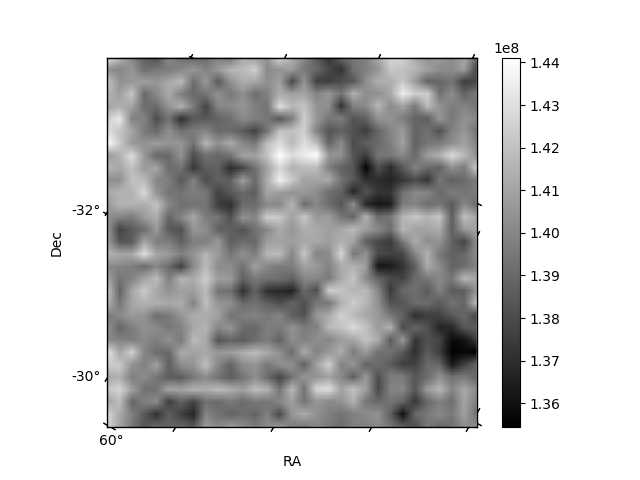
Quadrant B |
|---|---|---|---|
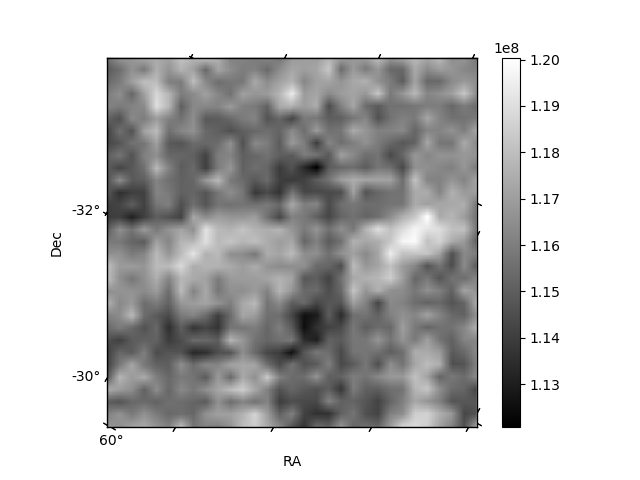
| Quadrant D | 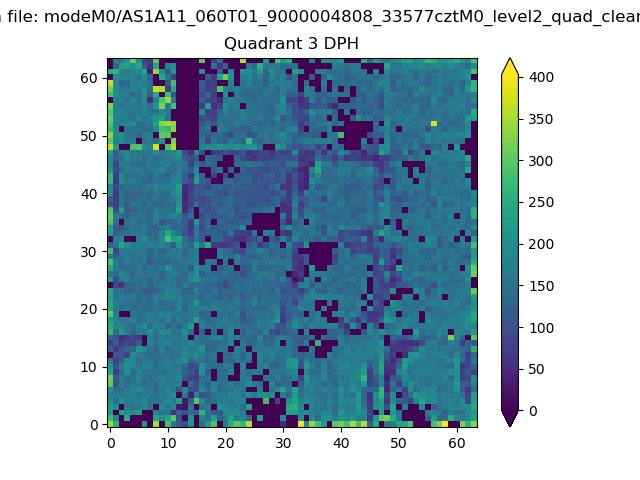 |
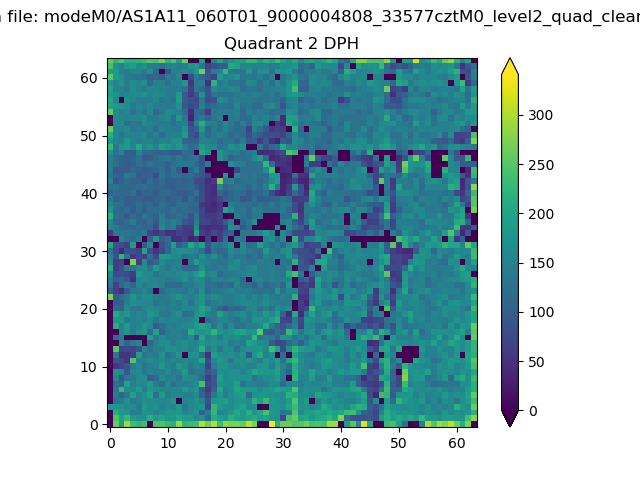 |
Quadrant C |
| Plot type | Count rate plots | Images |
|---|---|---|
| Comparison with Poisson distribution Blue bars denote a histogram of data divided into 1 sec bins. Red curve is a Poisson curve with rate = median count rate of data. |
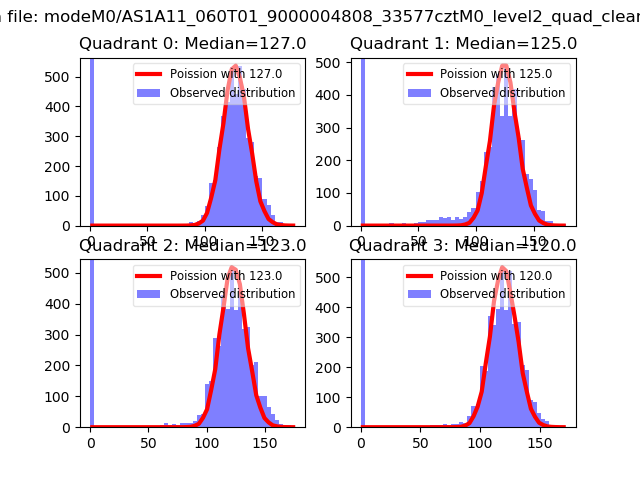 |
 |
| Quadrant-wise count rates Data is divided into 100 sec bins |
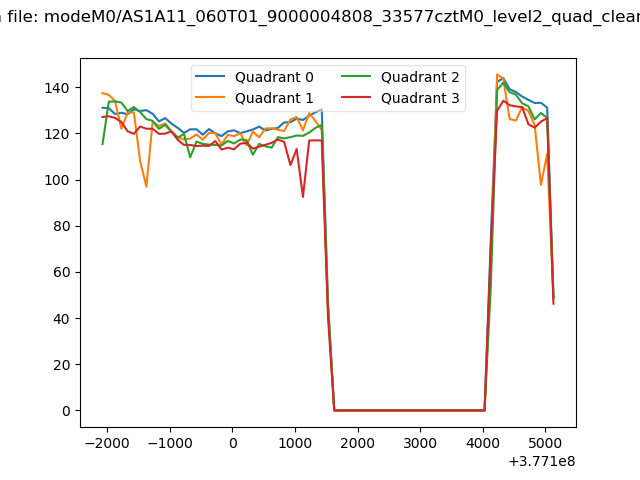 |
|
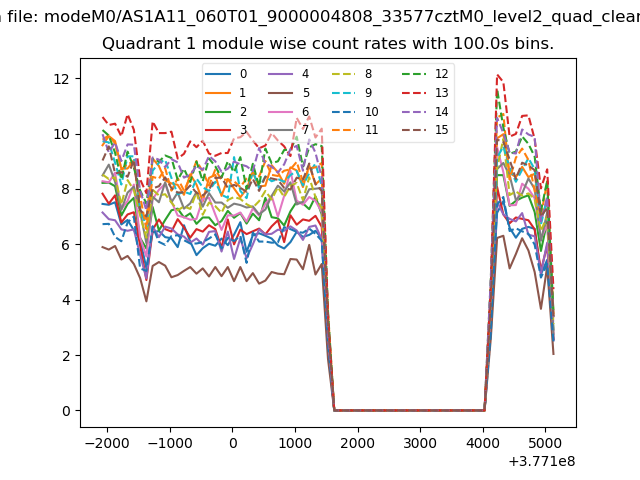
| Module-wise count rates for Quadrant A Data is divided into 100 sec bins |
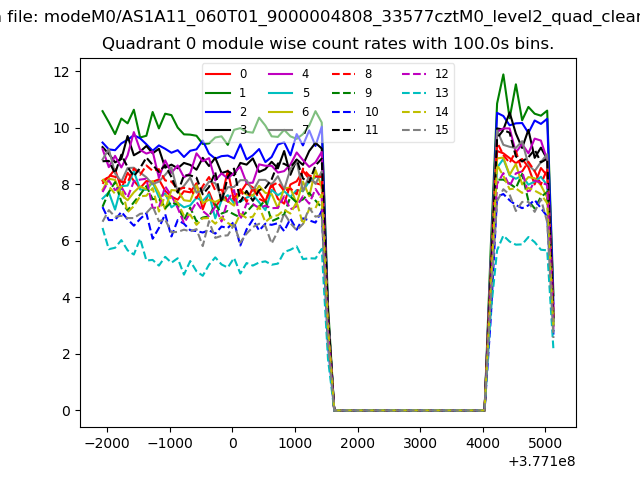 |
 |
| Module-wise count rates for Quadrant B Data is divided into 100 sec bins |
 |
 |
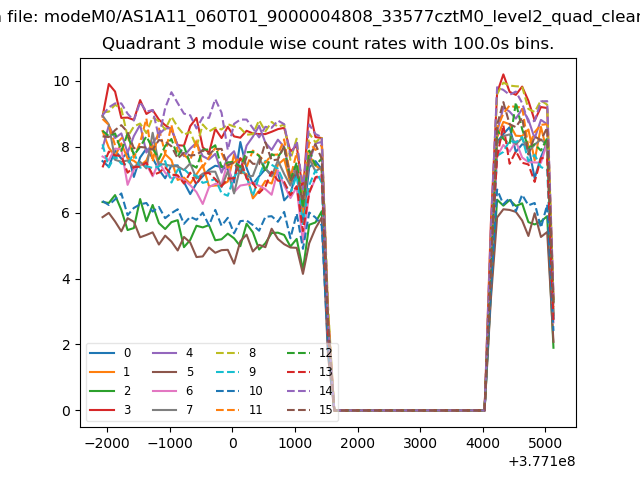
| Module-wise count rates for Quadrant C Data is divided into 100 sec bins |
 |
 |
| Module-wise count rates for Quadrant D Data is divided into 100 sec bins |
 |
 |
| Parameter | Plot |
|---|---|
| CZT HV Monitor |  |
| D_VDD | 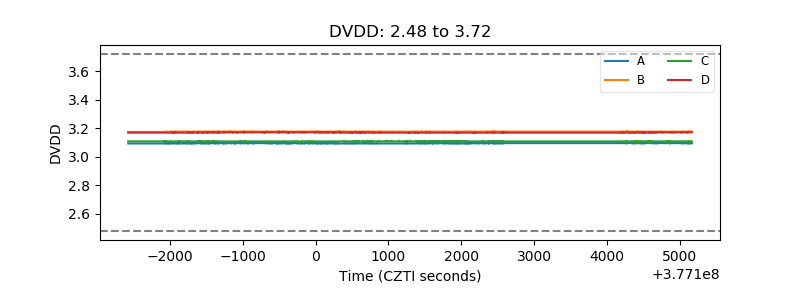 |
| Temperature 1 | 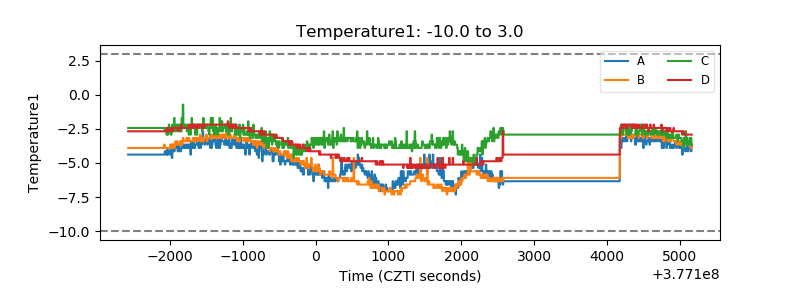 |
| Veto HV Monitor | 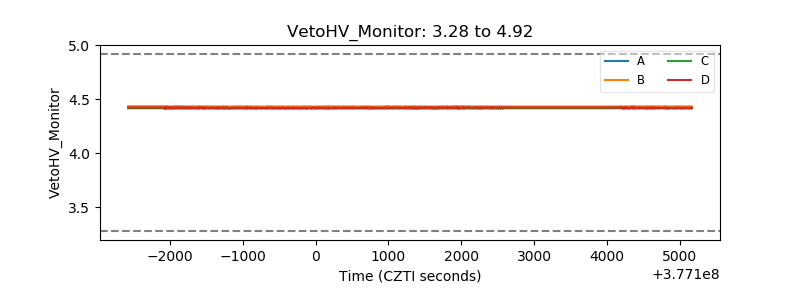 |
| Veto LLD | 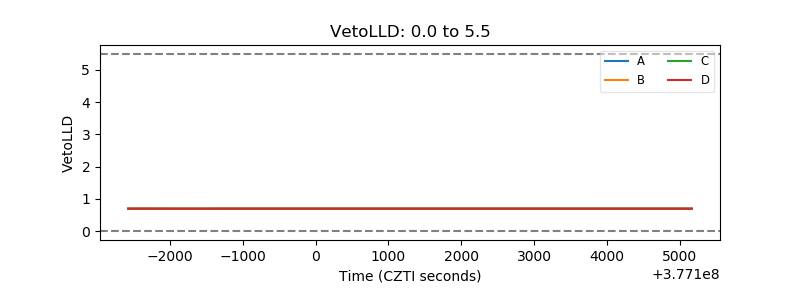 |
| Alpha Counter | 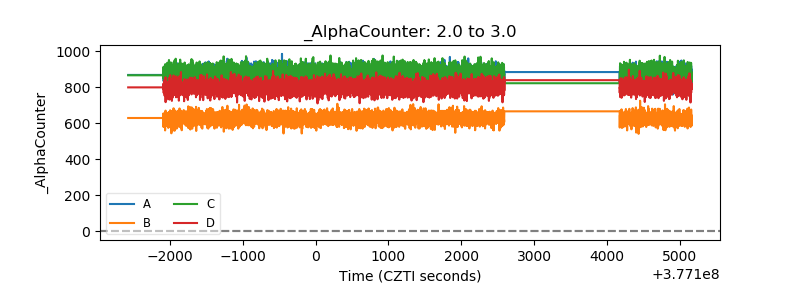 |
| _CPM_Rate | 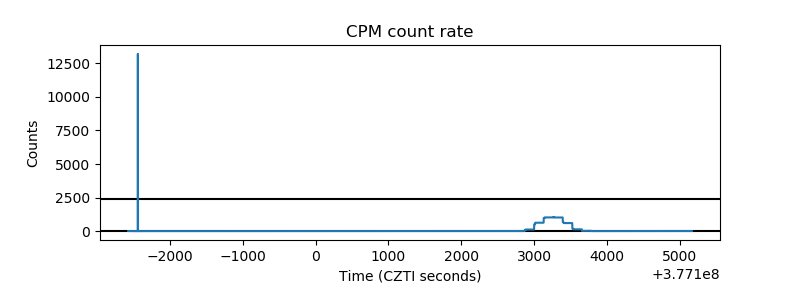 |
| CZT Counter | 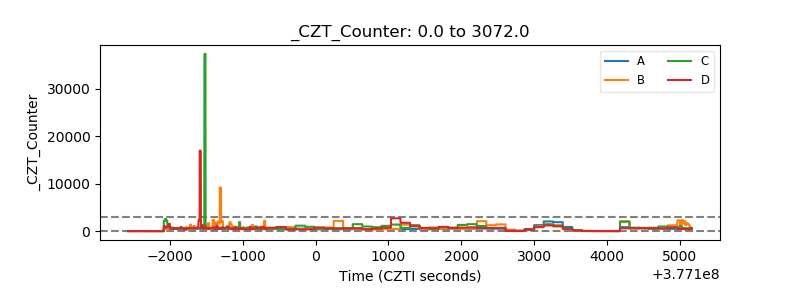 |
| +2.5 Volts monitor | 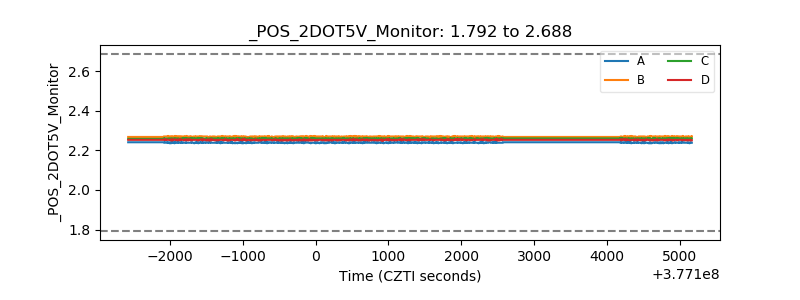 |
| +5 Volts monitor | 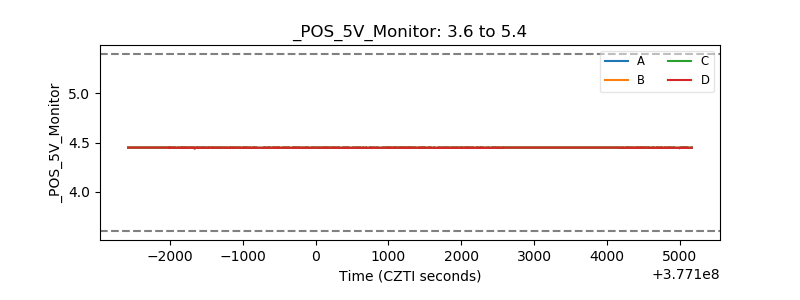 |
| _ROLL_ROT | 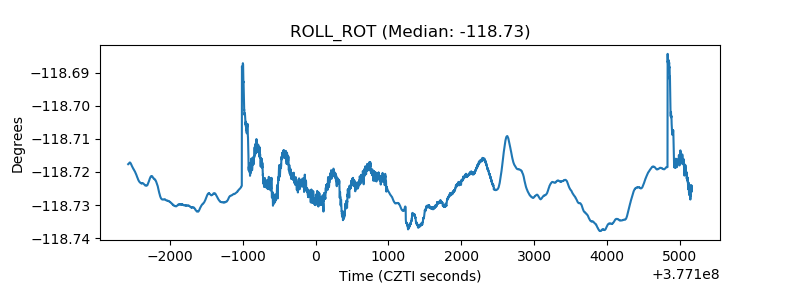 |
| _Roll_DEC | 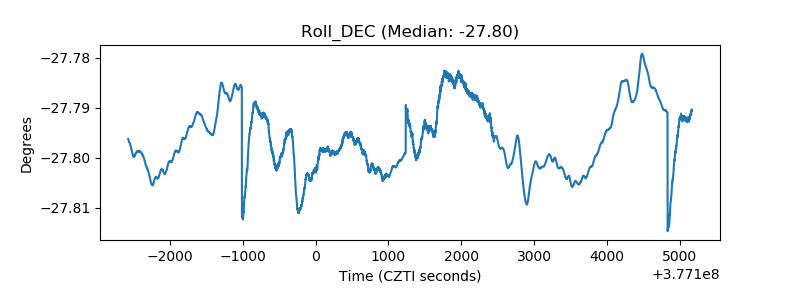 |
| _Roll_RA | 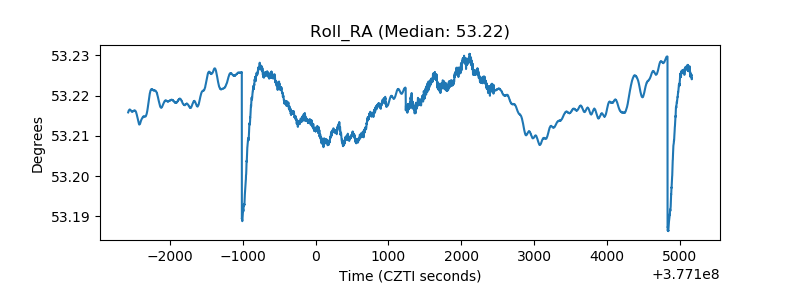 |
| Veto Counter | 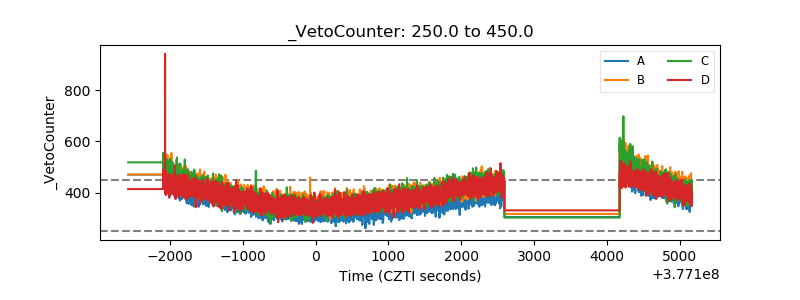 |