| Param | Original file | Final file |
|---|---|---|
| Filename | modeM0/AS1A11_060T01_9000004808_33578cztM0_level2.evt | modeM0/AS1A11_060T01_9000004808_33578cztM0_level2_quad_clean.evt |
| Size (bytes) | 550,431,360 | 84,957,120 |
| Size | 524.9 MB | 81.0 MB |
| Events in quadrant A | 2,807,510 | 571,610 |
| Events in quadrant B | 4,943,647 | 540,856 |
| Events in quadrant C | 4,702,460 | 539,944 |
| Events in quadrant D | 3,836,113 | 527,042 |
| Mode M0 | |||
|---|---|---|---|
| Quadrant | BADHDUFLAG | Total packets | Discarded packets |
| A | 0 | 11713 | 3 |
| B | 0 | 18442 | 2 |
| C | 0 | 18042 | 2 |
| D | 0 | 15339 | 2 |
| Mode M9 | |||
|---|---|---|---|
| Quadrant | BADHDUFLAG | Total packets | Discarded packets |
| A | 0 | 17 | 0 |
| B | 0 | 17 | 0 |
| C | 0 | 17 | 0 |
| D | 0 | 17 | 0 |
| Mode SS | |||
|---|---|---|---|
| Quadrant | BADHDUFLAG | Total packets | Discarded packets |
| A | 0 | 114 | 0 |
| B | 0 | 114 | 0 |
| C | 0 | 114 | 0 |
| D | 0 | 114 | 0 |
| Quadrant | Total seconds | Saturated seconds | Saturation percentage |
|---|---|---|---|
| A | 5619 | 3 | 0.053390% |
| B | 5619 | 625 | 11.122976% |
| C | 5619 | 237 | 4.217832% |
| D | 5620 | 117 | 2.081851% |
Noise dominated data is calculated using 1-second bins in cleaned event files. If a bin has >2000 counts, and if more than 50% of those come from <1% of pixels, then it is considered to be noise-dominated and hence unusable.
| Quadrant | # 1 sec bins | Bins with >0 counts | Bins with >2000 counts | High rate bins dominated by noise | Noise dominated (total time) | Noise dominated (detector-on time) | Marked lightcurve |
|---|---|---|---|---|---|---|---|
| A | 7321 | 5620 | 0 | 0 | 0.00% | 0.00% | 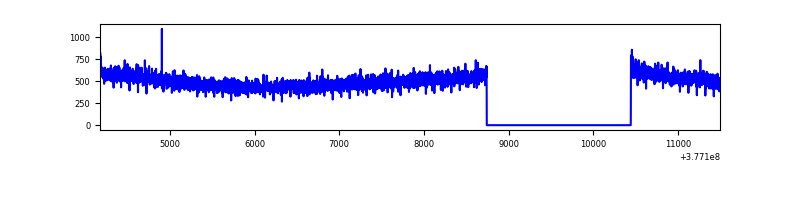 |
| B | 7321 | 5620 | 516 | 516 | 7.05% | 9.18% | 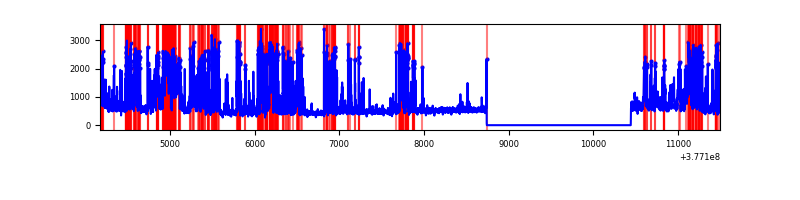 |
| C | 7321 | 5620 | 190 | 190 | 2.60% | 3.38% | 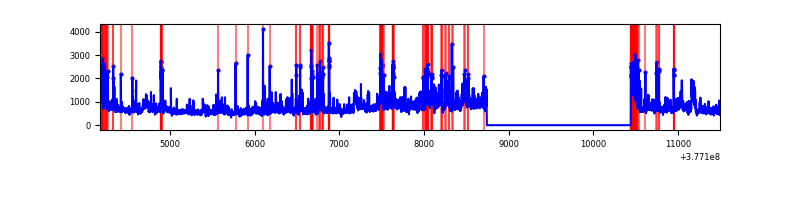 |
| D | 7322 | 5621 | 106 | 106 | 1.45% | 1.89% | 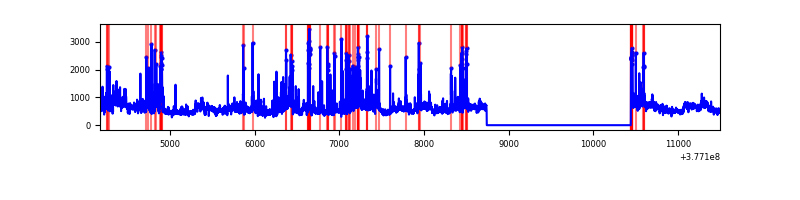 |
Top three noisy pixels from each quadrant. If the there are fewer than three noisy pixels in the level2.evt file, extra rows are filled as -1
| Pixel properties | Quadrant properties | ||||||
|---|---|---|---|---|---|---|---|
| Quadrant | DetID | PixID | Counts | Sigma | Mean | Median | Sigma |
| A | 15 | 169 | 192708 | 1404.82 | 674 | 661 | 136.7 |
| A | 13 | 254 | 10289 | 70.43 | 674 | 661 | 136.7 |
| A | 3 | 137 | 6667 | 43.93 | 674 | 661 | 136.7 |
| B | 5 | 172 | 2023386 | 16227.58 | 645 | 630 | 124.6 |
| B | 5 | 255 | 202614 | 1620.42 | 645 | 630 | 124.6 |
| B | 15 | 222 | 87534 | 697.19 | 645 | 630 | 124.6 |
| C | 3 | 233 | 1578421 | 10717.8 | 634 | 639 | 147.2 |
| C | 0 | 10 | 279811 | 1896.4 | 634 | 639 | 147.2 |
| C | 15 | 214 | 237031 | 1605.8 | 634 | 639 | 147.2 |
| D | 8 | 195 | 595300 | 3798.43 | 640 | 623 | 156.6 |
| D | 2 | 250 | 184680 | 1175.64 | 640 | 623 | 156.6 |
| D | 2 | 249 | 173704 | 1105.54 | 640 | 623 | 156.6 |
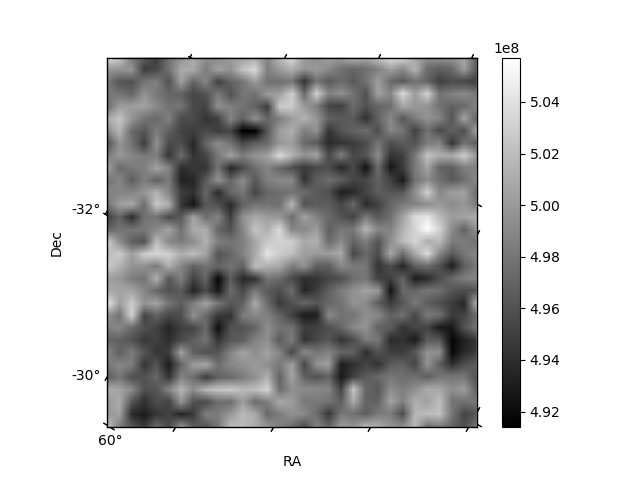
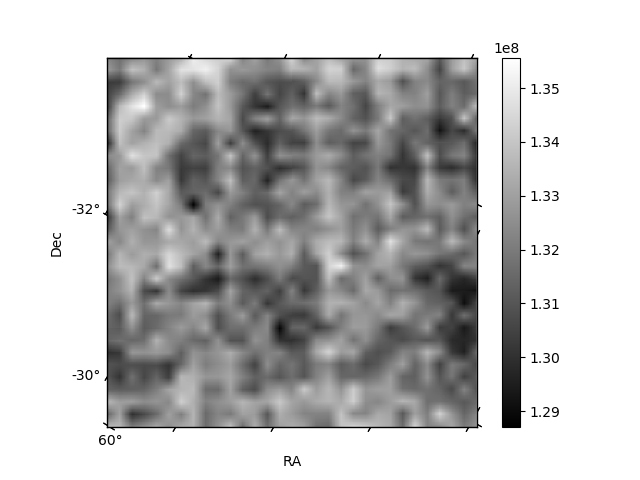
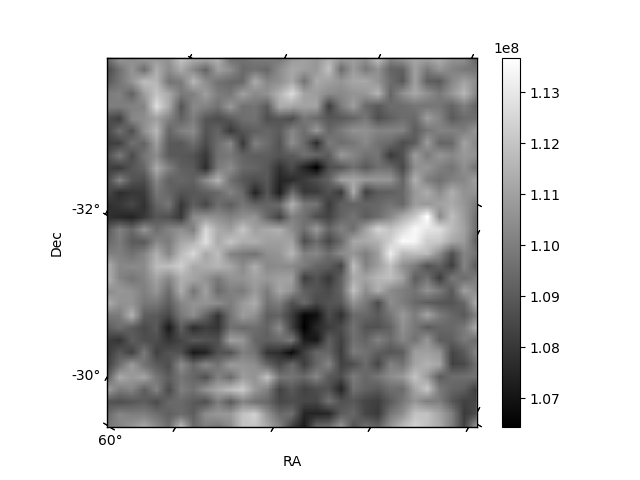
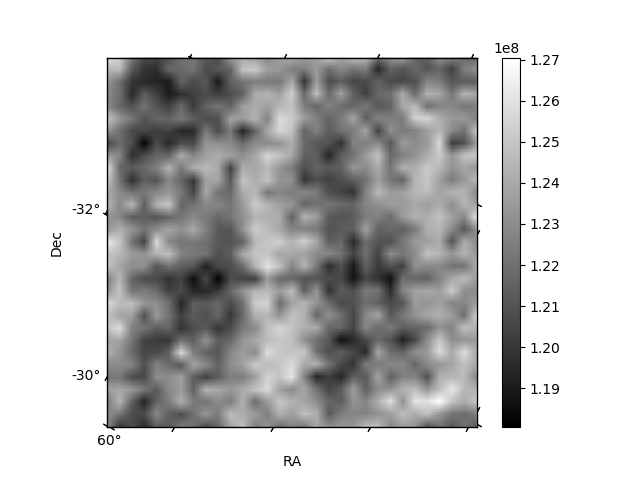
Histogram calculated using DETX and DETY for each event in the final _common_clean file
| Quadrant A | 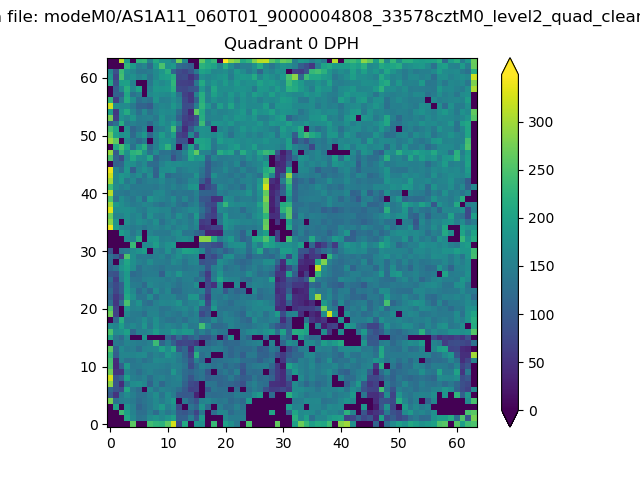 |
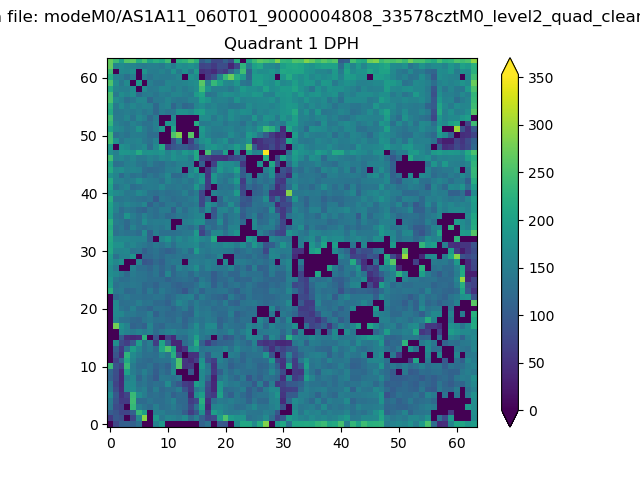 |
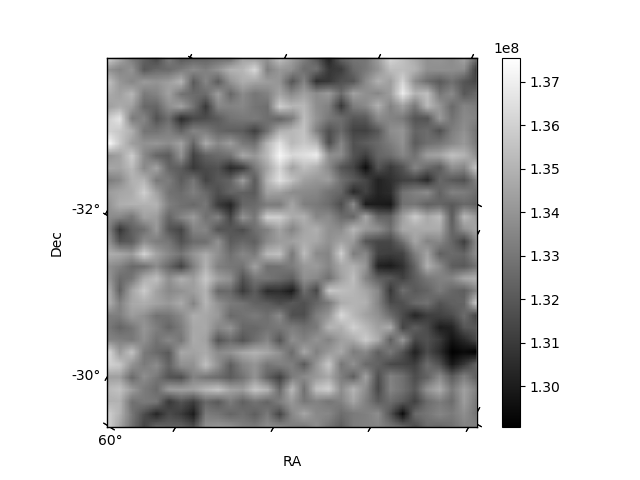
Quadrant B |
|---|---|---|---|
| Quadrant D | 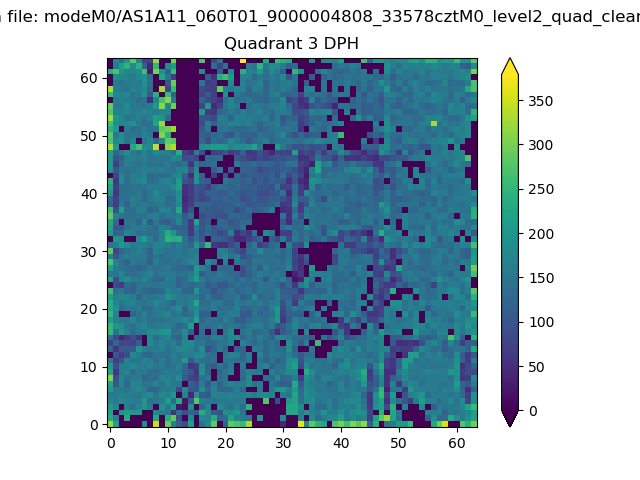 |
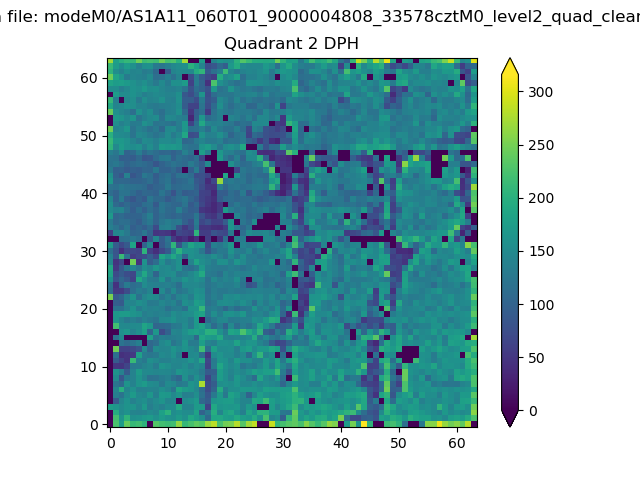 |
Quadrant C |
| Plot type | Count rate plots | Images |
|---|---|---|
| Comparison with Poisson distribution Blue bars denote a histogram of data divided into 1 sec bins. Red curve is a Poisson curve with rate = median count rate of data. |
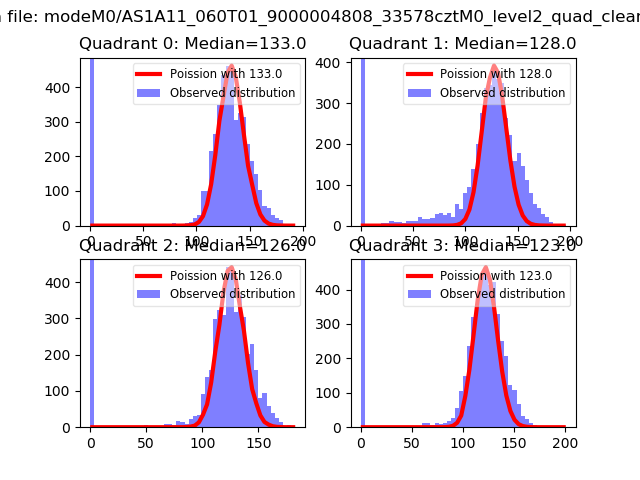 |
 |
| Quadrant-wise count rates Data is divided into 100 sec bins |
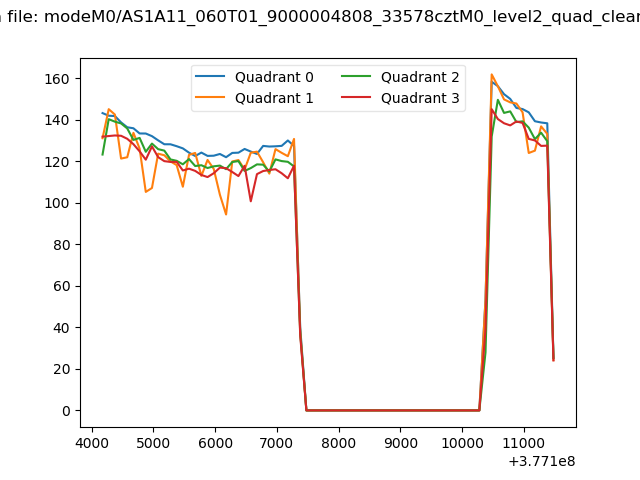 |
|
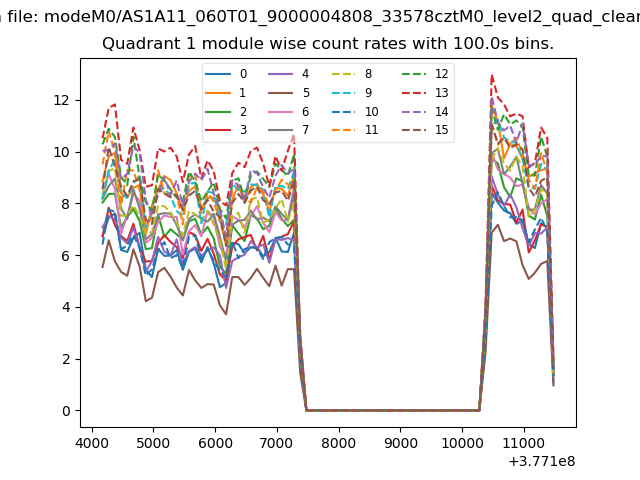
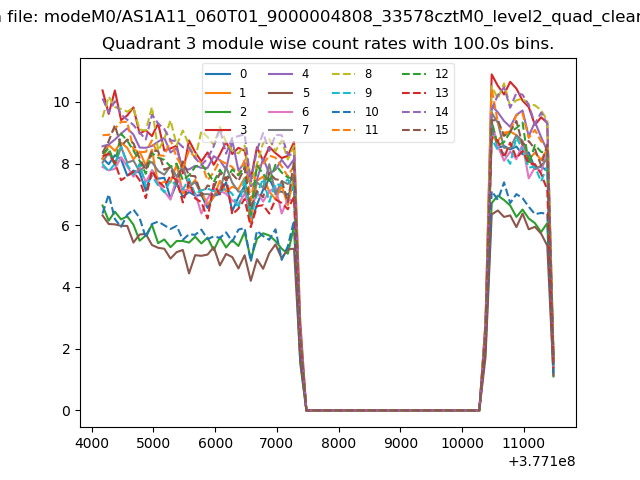
| Module-wise count rates for Quadrant A Data is divided into 100 sec bins |
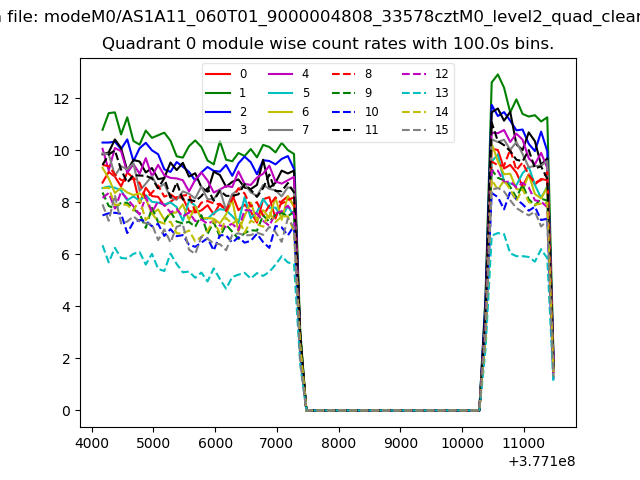 |
 |
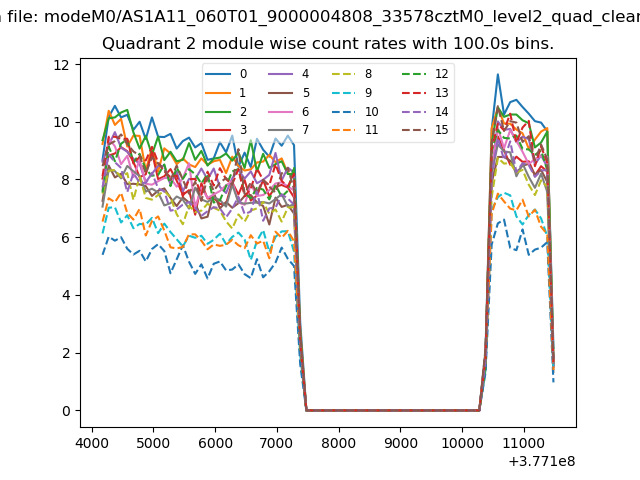
| Module-wise count rates for Quadrant B Data is divided into 100 sec bins |
 |
 |
| Module-wise count rates for Quadrant C Data is divided into 100 sec bins |
 |
 |
| Module-wise count rates for Quadrant D Data is divided into 100 sec bins |
 |
 |
| Parameter | Plot |
|---|---|
| CZT HV Monitor | 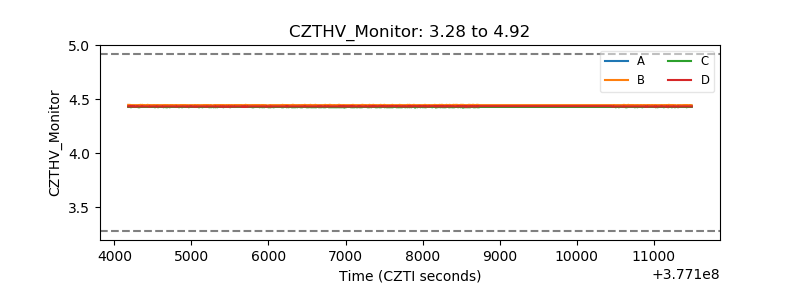 |
| D_VDD | 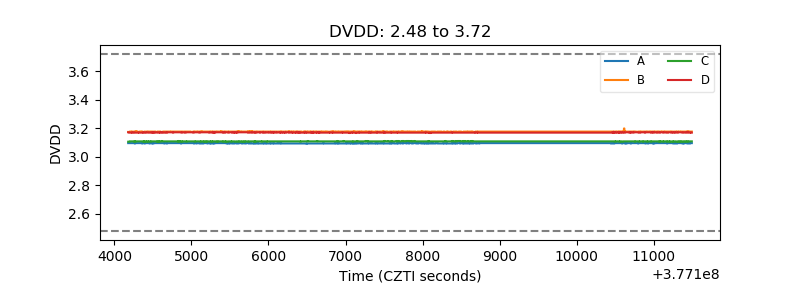 |
| Temperature 1 |  |
| Veto HV Monitor |  |
| Veto LLD | 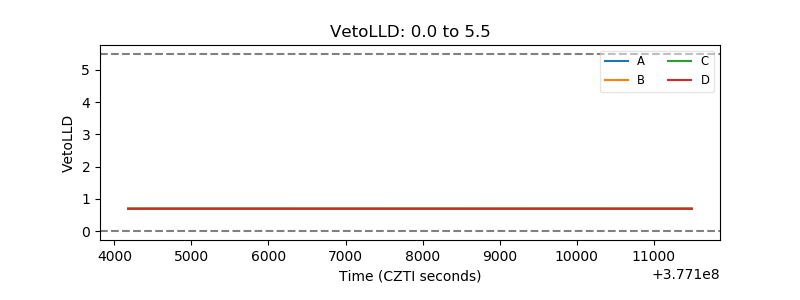 |
| Alpha Counter | 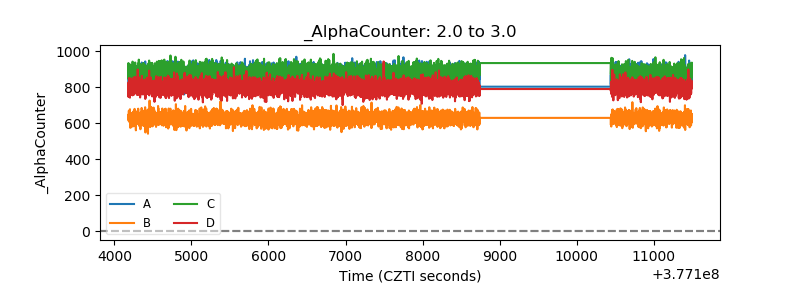 |
| _CPM_Rate | 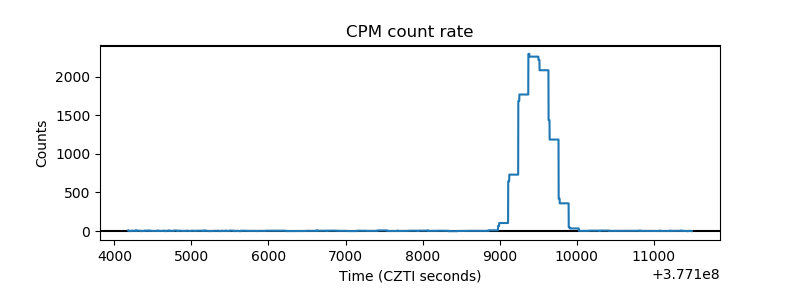 |
| CZT Counter | 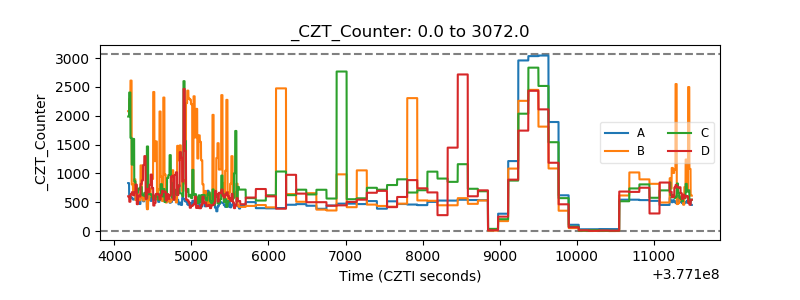 |
| +2.5 Volts monitor |  |
| +5 Volts monitor | 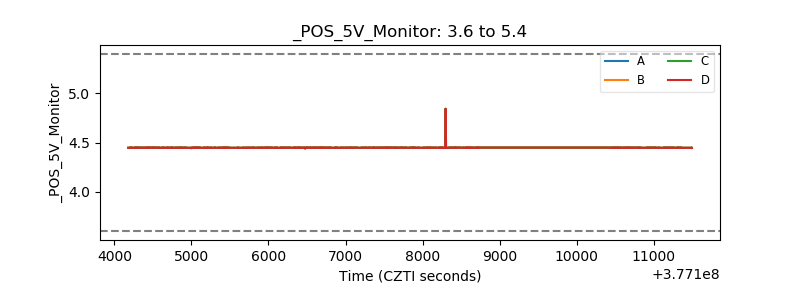 |
| _ROLL_ROT | 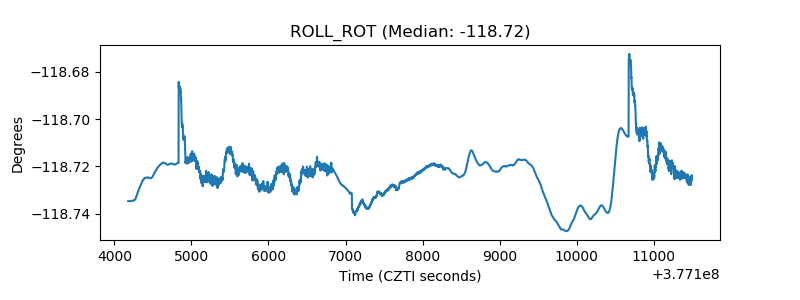 |
| _Roll_DEC | 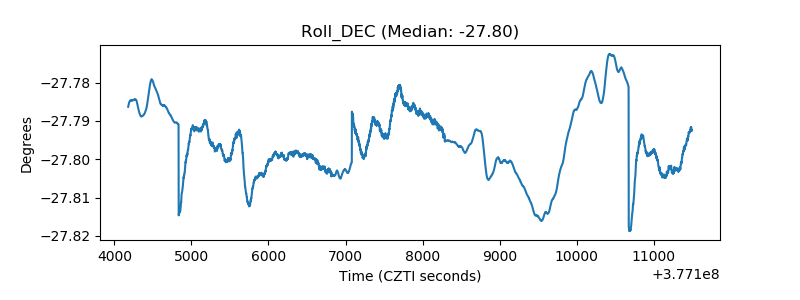 |
| _Roll_RA | 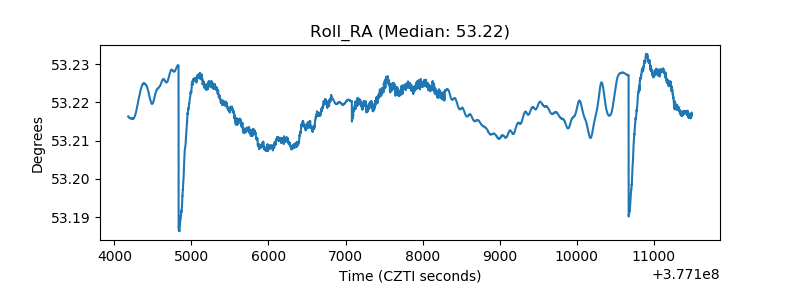 |
| Veto Counter | 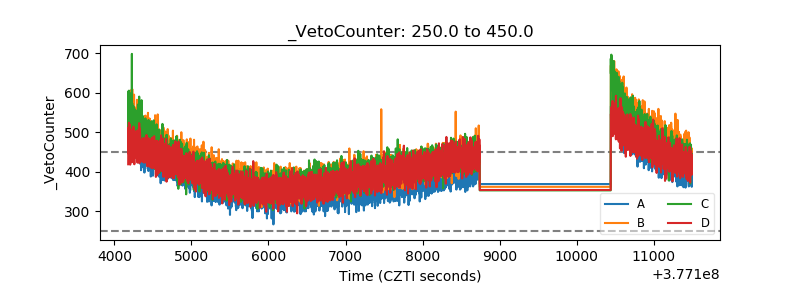 |