| Param | Original file | Final file |
|---|---|---|
| Filename | modeM0/AS1A11_060T01_9000004808_33581cztM0_level2.evt | modeM0/AS1A11_060T01_9000004808_33581cztM0_level2_quad_clean.evt |
| Size (bytes) | 567,648,000 | 75,337,920 |
| Size | 541.4 MB | 71.8 MB |
| Events in quadrant A | 3,358,108 | 496,874 |
| Events in quadrant B | 4,151,112 | 504,485 |
| Events in quadrant C | 4,605,466 | 474,346 |
| Events in quadrant D | 4,720,032 | 435,839 |
| Mode M0 | |||
|---|---|---|---|
| Quadrant | BADHDUFLAG | Total packets | Discarded packets |
| A | 0 | 13139 | 3 |
| B | 0 | 15700 | 2 |
| C | 0 | 17530 | 2 |
| D | 0 | 17718 | 2 |
| Mode M9 | |||
|---|---|---|---|
| Quadrant | BADHDUFLAG | Total packets | Discarded packets |
| A | 0 | 25 | 0 |
| B | 0 | 25 | 0 |
| C | 0 | 25 | 0 |
| D | 0 | 26 | 0 |
| Mode SS | |||
|---|---|---|---|
| Quadrant | BADHDUFLAG | Total packets | Discarded packets |
| A | 0 | 108 | 0 |
| B | 0 | 108 | 0 |
| C | 0 | 108 | 0 |
| D | 0 | 108 | 0 |
| Quadrant | Total seconds | Saturated seconds | Saturation percentage |
|---|---|---|---|
| A | 5273 | 116 | 2.199886% |
| B | 5273 | 540 | 10.240850% |
| C | 5273 | 242 | 4.589418% |
| D | 5273 | 453 | 8.590935% |
Noise dominated data is calculated using 1-second bins in cleaned event files. If a bin has >2000 counts, and if more than 50% of those come from <1% of pixels, then it is considered to be noise-dominated and hence unusable.
| Quadrant | # 1 sec bins | Bins with >0 counts | Bins with >2000 counts | High rate bins dominated by noise | Noise dominated (total time) | Noise dominated (detector-on time) | Marked lightcurve |
|---|---|---|---|---|---|---|---|
| A | 7246 | 5274 | 115 | 115 | 1.59% | 2.18% | 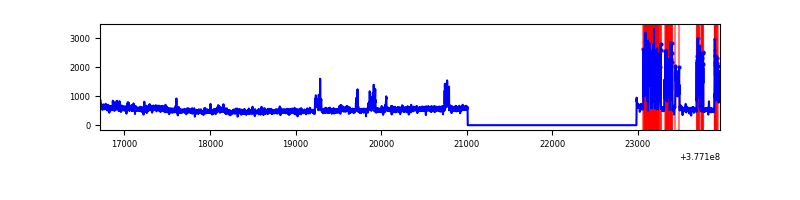 |
| B | 7246 | 5273 | 412 | 412 | 5.69% | 7.81% | 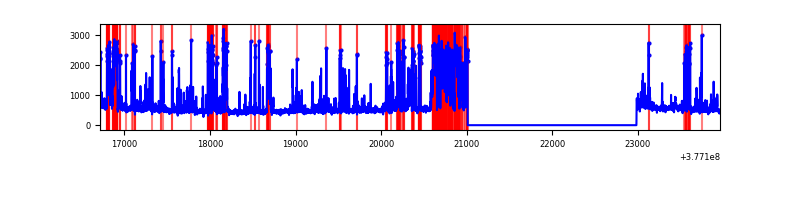 |
| C | 7246 | 5274 | 212 | 212 | 2.93% | 4.02% | 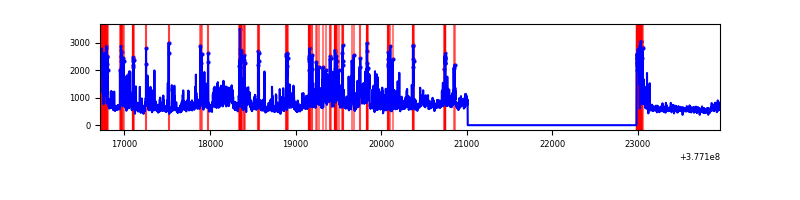 |
| D | 7246 | 5274 | 500 | 500 | 6.90% | 9.48% | 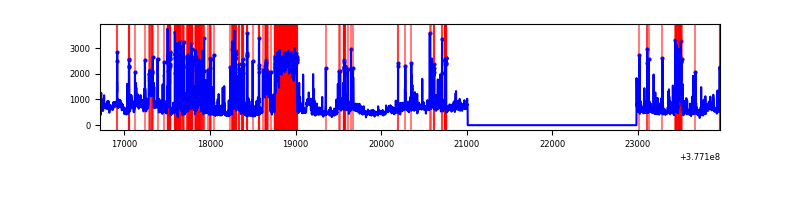 |
Top three noisy pixels from each quadrant. If the there are fewer than three noisy pixels in the level2.evt file, extra rows are filled as -1
| Pixel properties | Quadrant properties | ||||||
|---|---|---|---|---|---|---|---|
| Quadrant | DetID | PixID | Counts | Sigma | Mean | Median | Sigma |
| A | 15 | 169 | 814838 | 6313.05 | 655 | 646 | 129.0 |
| A | 13 | 254 | 8799 | 63.22 | 655 | 646 | 129.0 |
| A | 3 | 137 | 6240 | 43.37 | 655 | 646 | 129.0 |
| B | 5 | 172 | 1502572 | 12465.16 | 633 | 619 | 120.5 |
| B | 15 | 222 | 67499 | 555.06 | 633 | 619 | 120.5 |
| B | 0 | 190 | 27913 | 226.52 | 633 | 619 | 120.5 |
| C | 3 | 233 | 1427476 | 9844.43 | 627 | 635 | 144.9 |
| C | 0 | 10 | 274031 | 1886.29 | 627 | 635 | 144.9 |
| C | 14 | 254 | 223619 | 1538.47 | 627 | 635 | 144.9 |
| D | 15 | 0 | 1316768 | 8885.01 | 609 | 593 | 148.1 |
| D | 8 | 195 | 453765 | 3059.2 | 609 | 593 | 148.1 |
| D | 2 | 249 | 224792 | 1513.49 | 609 | 593 | 148.1 |
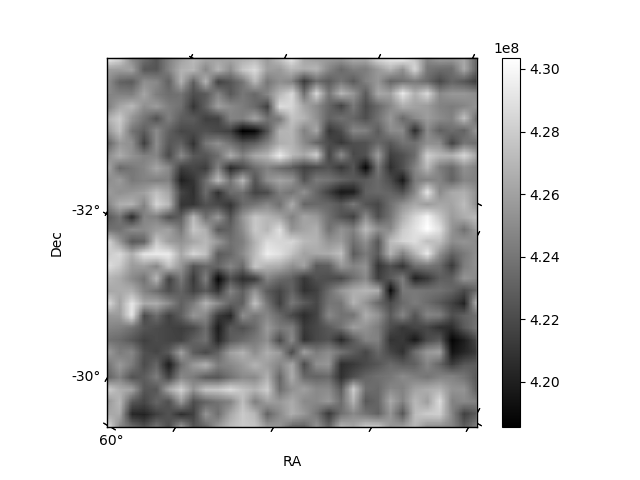
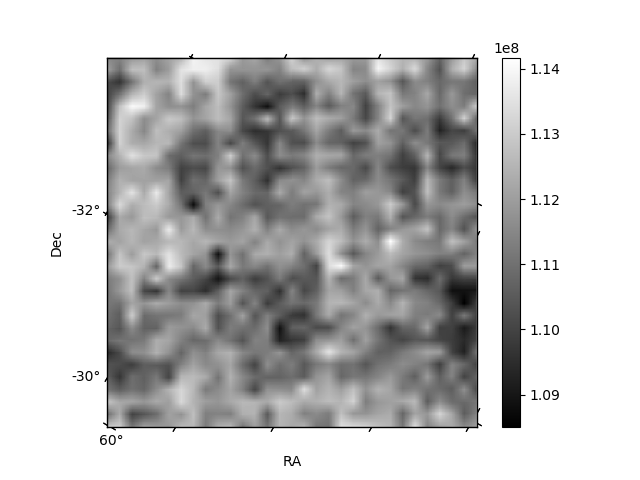
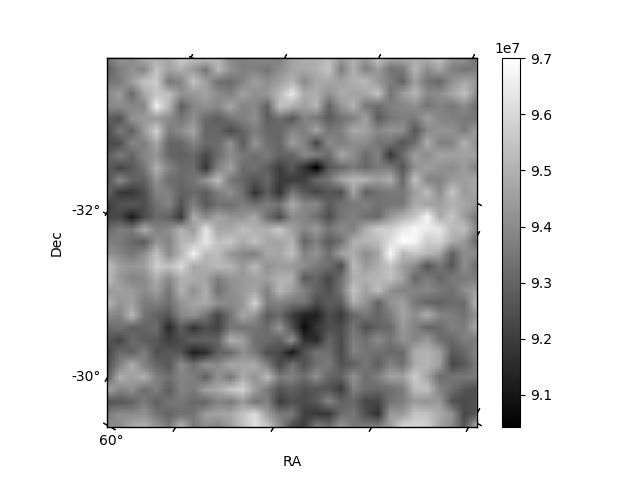
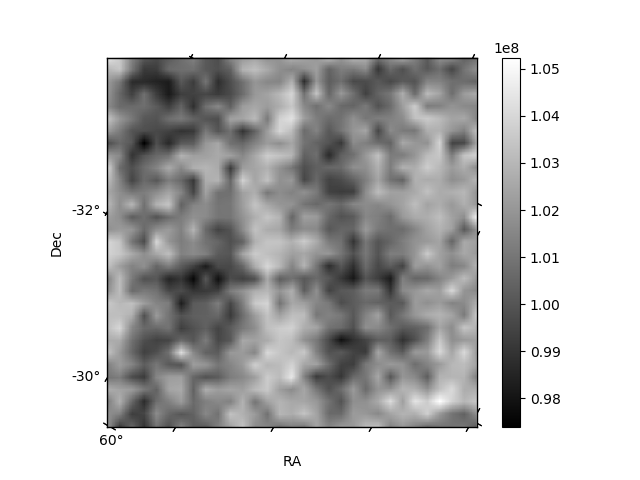
Histogram calculated using DETX and DETY for each event in the final _common_clean file
| Quadrant A | 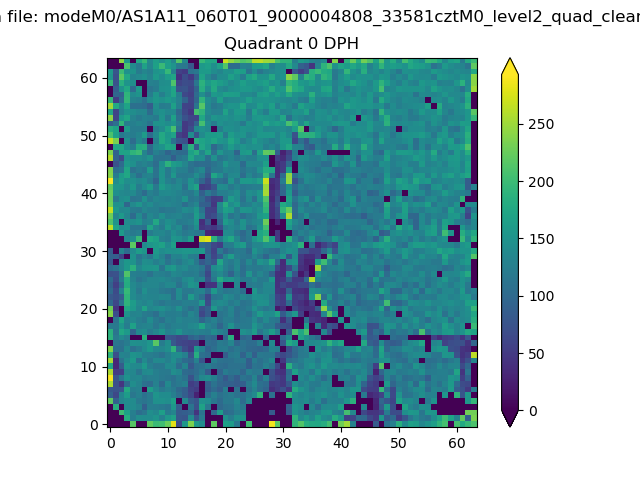 |
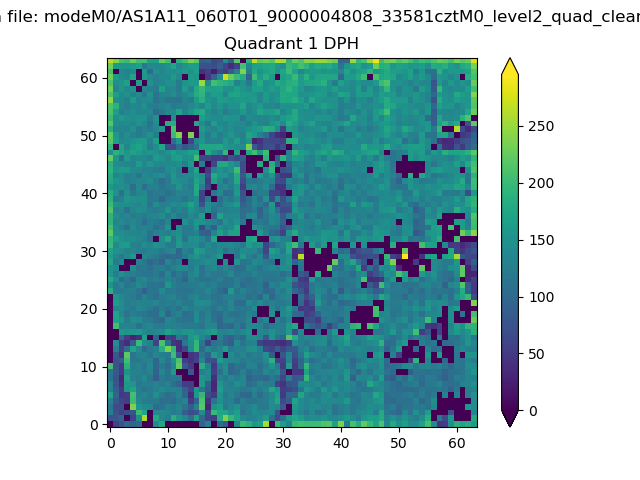 |
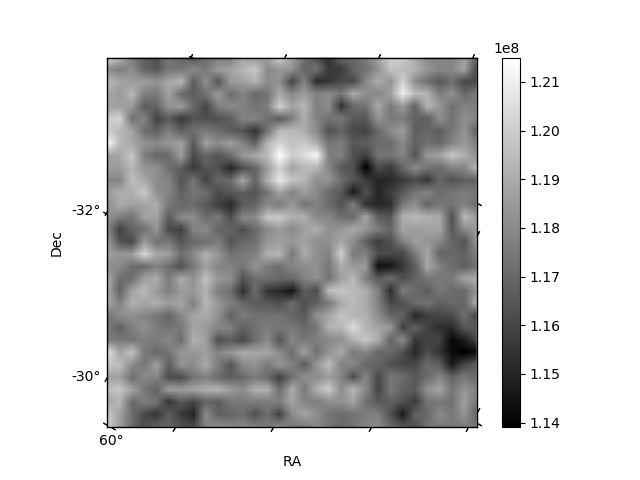
Quadrant B |
|---|---|---|---|
| Quadrant D | 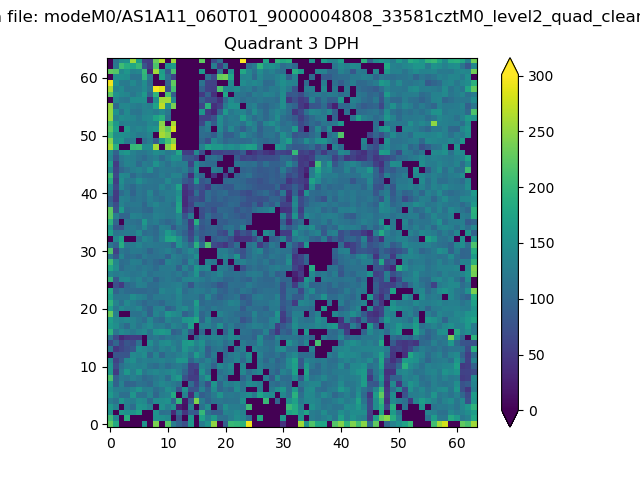 |
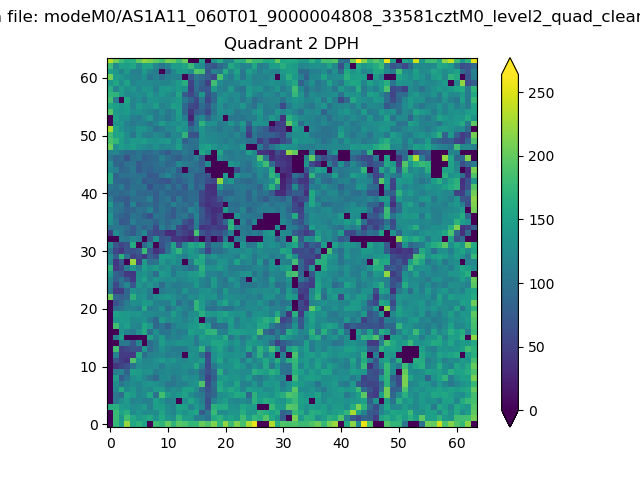 |
Quadrant C |
| Plot type | Count rate plots | Images |
|---|---|---|
| Comparison with Poisson distribution Blue bars denote a histogram of data divided into 1 sec bins. Red curve is a Poisson curve with rate = median count rate of data. |
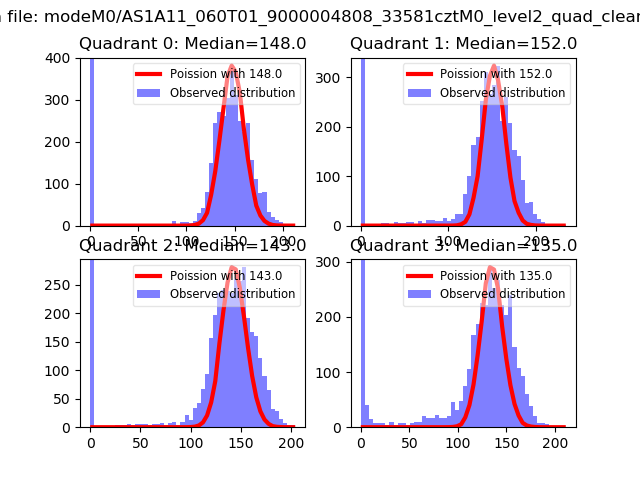 |
 |
| Quadrant-wise count rates Data is divided into 100 sec bins |
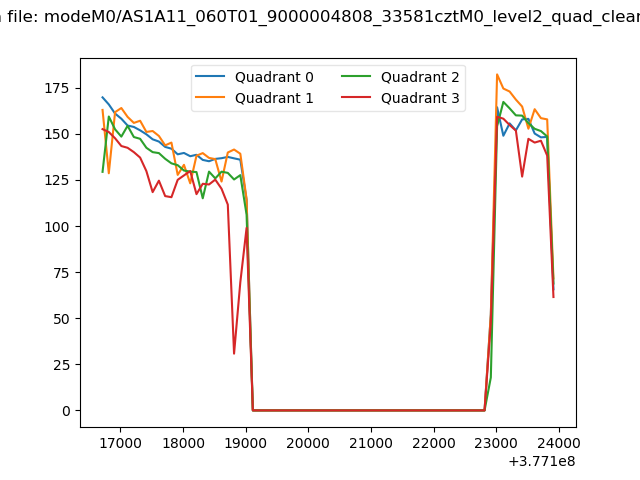 |
|
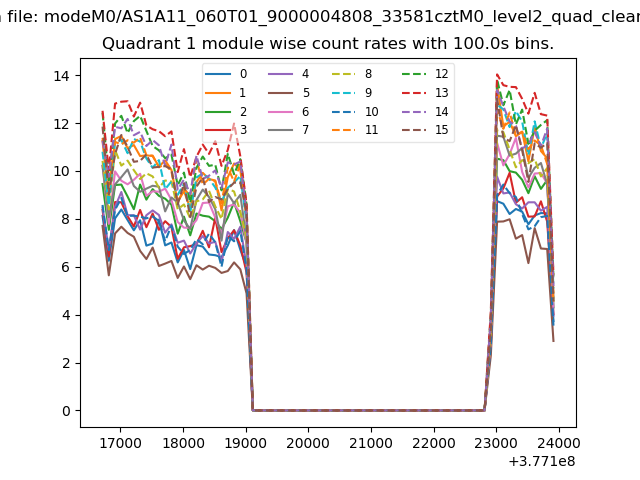
| Module-wise count rates for Quadrant A Data is divided into 100 sec bins |
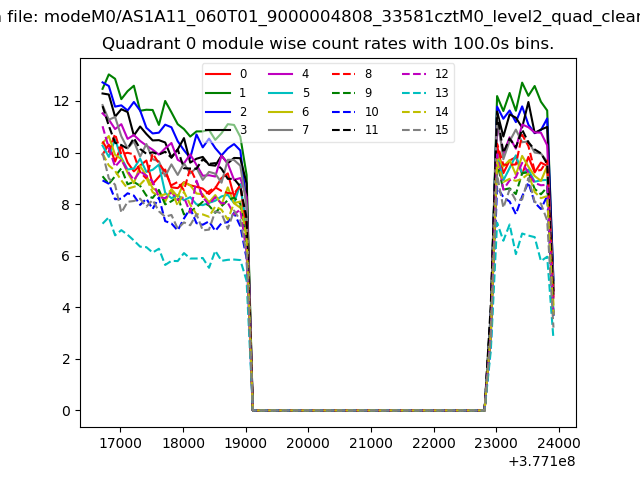 |
 |
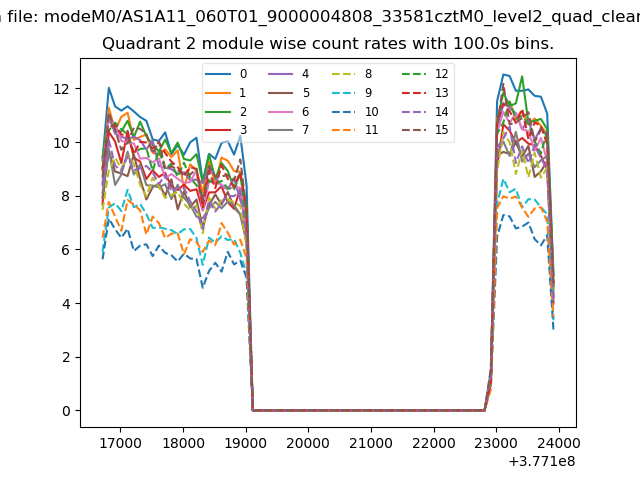
| Module-wise count rates for Quadrant B Data is divided into 100 sec bins |
 |
 |
| Module-wise count rates for Quadrant C Data is divided into 100 sec bins |
 |
 |
| Module-wise count rates for Quadrant D Data is divided into 100 sec bins |
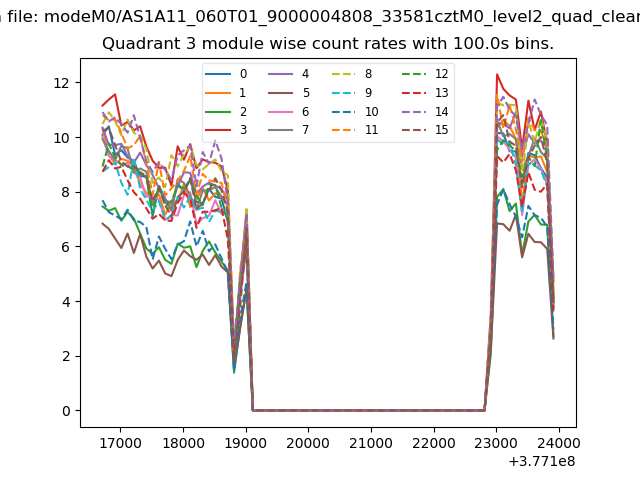 |
 |
| Parameter | Plot |
|---|---|
| CZT HV Monitor | 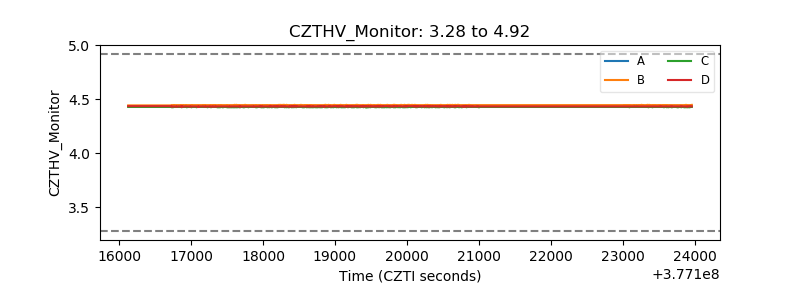 |
| D_VDD | 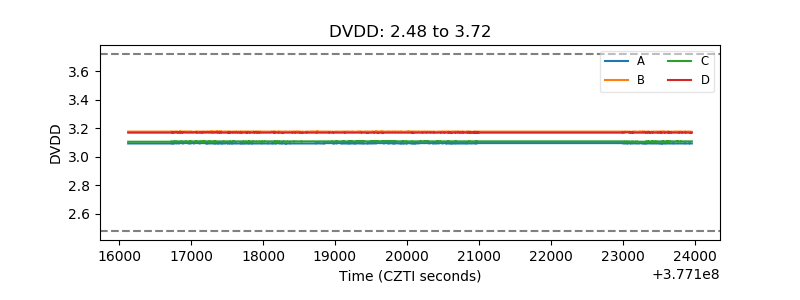 |
| Temperature 1 |  |
| Veto HV Monitor | 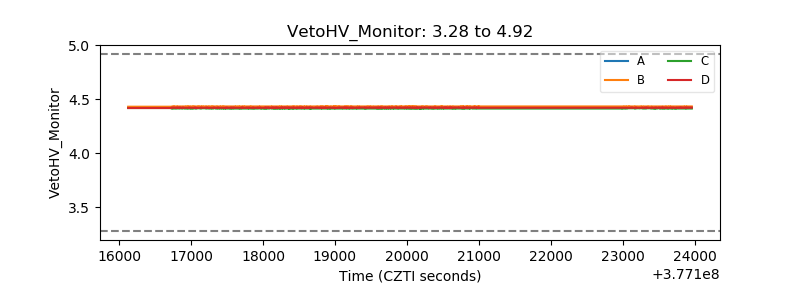 |
| Veto LLD | 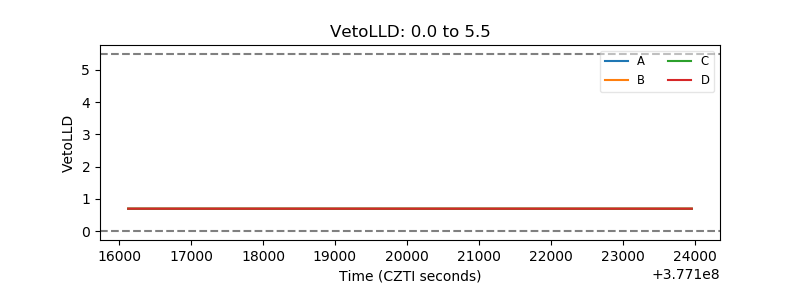 |
| Alpha Counter | 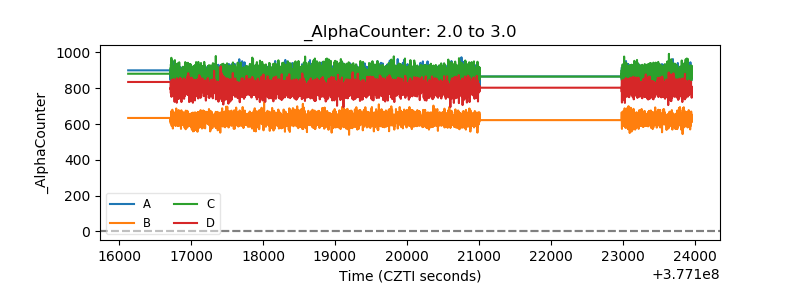 |
| _CPM_Rate | 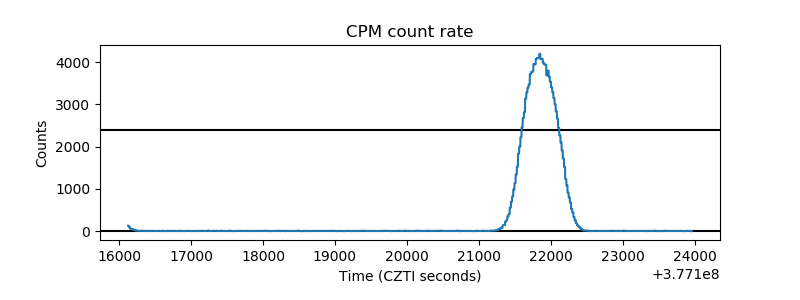 |
| CZT Counter | 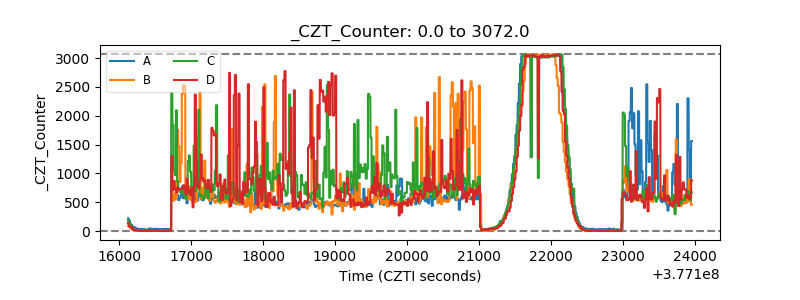 |
| +2.5 Volts monitor |  |
| +5 Volts monitor |  |
| _ROLL_ROT | 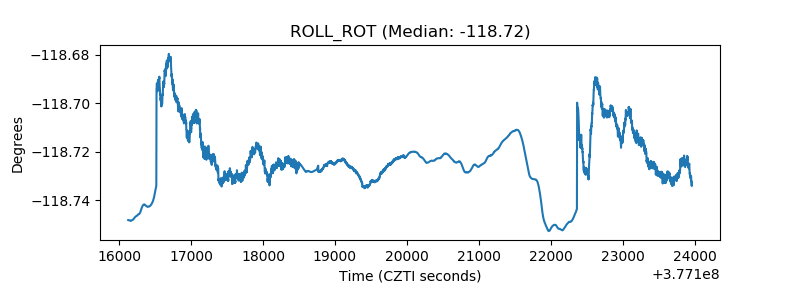 |
| _Roll_DEC | 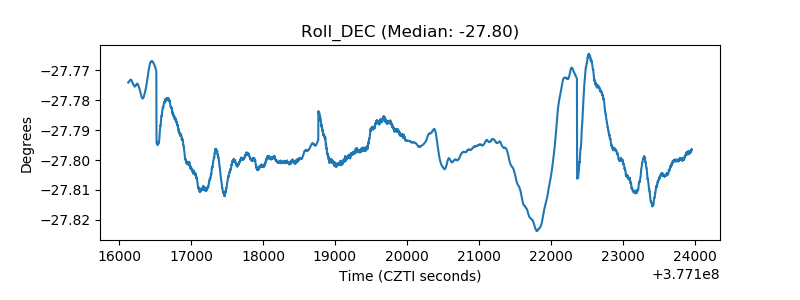 |
| _Roll_RA | 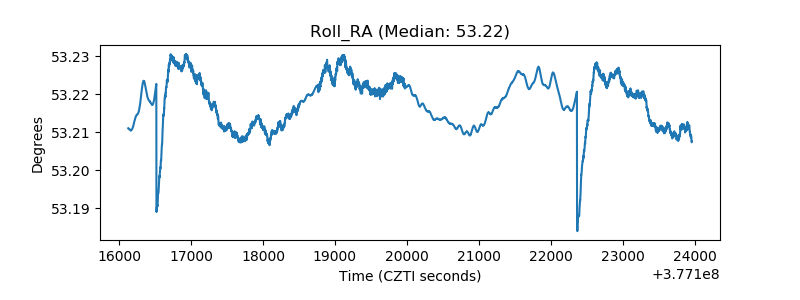 |
| Veto Counter | 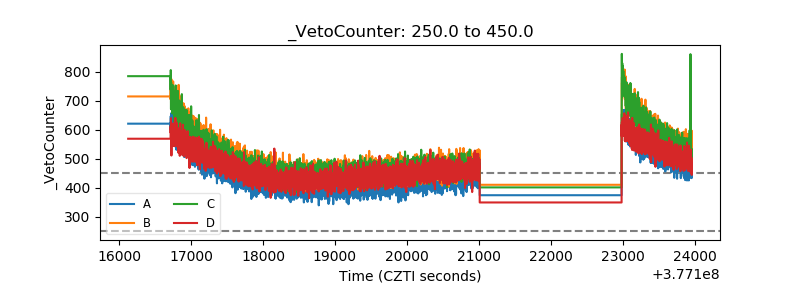 |