| Param | Original file | Final file |
|---|---|---|
| Filename | modeM0/AS1A11_060T01_9000004808_33582cztM0_level2.evt | modeM0/AS1A11_060T01_9000004808_33582cztM0_level2_quad_clean.evt |
| Size (bytes) | 561,003,840 | 71,447,040 |
| Size | 535.0 MB | 68.1 MB |
| Events in quadrant A | 4,266,243 | 455,534 |
| Events in quadrant B | 4,082,017 | 460,382 |
| Events in quadrant C | 4,190,817 | 450,802 |
| Events in quadrant D | 4,096,692 | 429,572 |
| Mode M0 | |||
|---|---|---|---|
| Quadrant | BADHDUFLAG | Total packets | Discarded packets |
| A | 0 | 16033 | 3 |
| B | 0 | 15389 | 2 |
| C | 0 | 16289 | 2 |
| D | 0 | 15745 | 2 |
| Mode M9 | |||
|---|---|---|---|
| Quadrant | BADHDUFLAG | Total packets | Discarded packets |
| A | 0 | 36 | 0 |
| B | 0 | 36 | 0 |
| C | 0 | 36 | 0 |
| D | 0 | 37 | 0 |
| Mode SS | |||
|---|---|---|---|
| Quadrant | BADHDUFLAG | Total packets | Discarded packets |
| A | 0 | 106 | 0 |
| B | 0 | 106 | 0 |
| C | 0 | 106 | 0 |
| D | 0 | 106 | 0 |
| Quadrant | Total seconds | Saturated seconds | Saturation percentage |
|---|---|---|---|
| A | 5242 | 156 | 2.975963% |
| B | 5242 | 493 | 9.404807% |
| C | 5242 | 204 | 3.891644% |
| D | 5242 | 269 | 5.131629% |
Noise dominated data is calculated using 1-second bins in cleaned event files. If a bin has >2000 counts, and if more than 50% of those come from <1% of pixels, then it is considered to be noise-dominated and hence unusable.
| Quadrant | # 1 sec bins | Bins with >0 counts | Bins with >2000 counts | High rate bins dominated by noise | Noise dominated (total time) | Noise dominated (detector-on time) | Marked lightcurve |
|---|---|---|---|---|---|---|---|
| A | 7305 | 5243 | 141 | 141 | 1.93% | 2.69% | 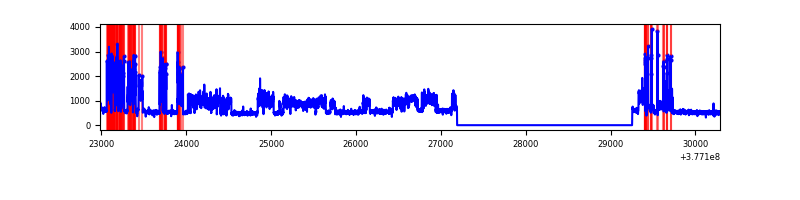 |
| B | 7305 | 5242 | 403 | 403 | 5.52% | 7.69% | 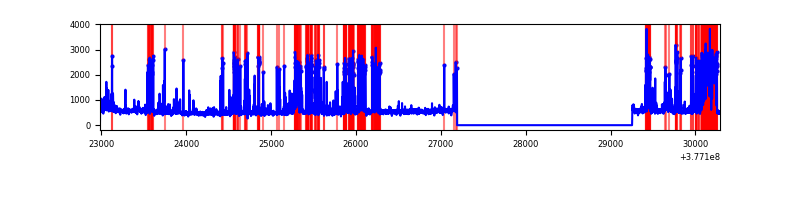 |
| C | 7305 | 5243 | 186 | 186 | 2.55% | 3.55% | 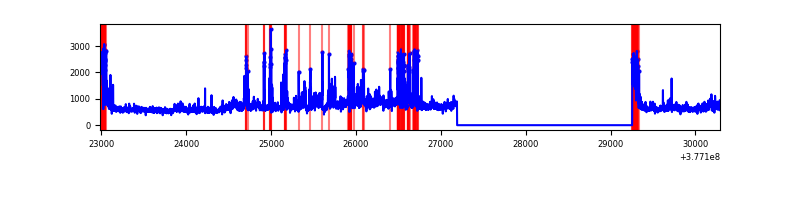 |
| D | 7305 | 5243 | 243 | 243 | 3.33% | 4.63% | 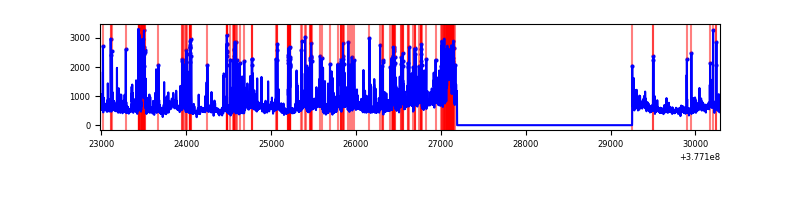 |
Top three noisy pixels from each quadrant. If the there are fewer than three noisy pixels in the level2.evt file, extra rows are filled as -1
| Pixel properties | Quadrant properties | ||||||
|---|---|---|---|---|---|---|---|
| Quadrant | DetID | PixID | Counts | Sigma | Mean | Median | Sigma |
| A | 15 | 169 | 1725428 | 13176.47 | 656 | 646 | 130.9 |
| A | 13 | 254 | 8321 | 58.63 | 656 | 646 | 130.9 |
| A | 10 | 83 | 6140 | 41.97 | 656 | 646 | 130.9 |
| B | 5 | 172 | 1371713 | 11237.77 | 644 | 629 | 122.0 |
| B | 15 | 222 | 64132 | 520.49 | 644 | 629 | 122.0 |
| B | 5 | 255 | 39824 | 321.25 | 644 | 629 | 122.0 |
| C | 3 | 233 | 870780 | 5880.74 | 641 | 647 | 148.0 |
| C | 0 | 10 | 432801 | 2920.69 | 641 | 647 | 148.0 |
| C | 15 | 214 | 221676 | 1493.81 | 641 | 647 | 148.0 |
| D | 8 | 195 | 447986 | 2914.93 | 631 | 613 | 153.5 |
| D | 2 | 249 | 323366 | 2102.95 | 631 | 613 | 153.5 |
| D | 13 | 249 | 303260 | 1971.95 | 631 | 613 | 153.5 |
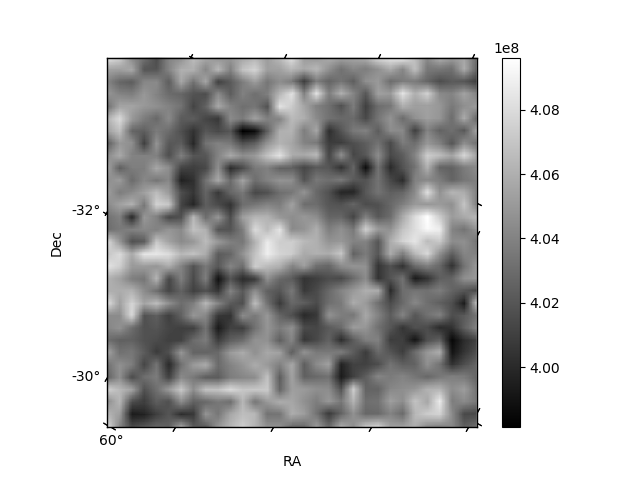
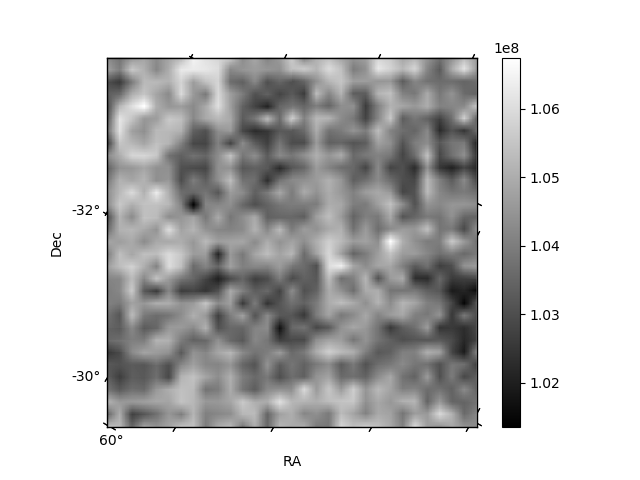
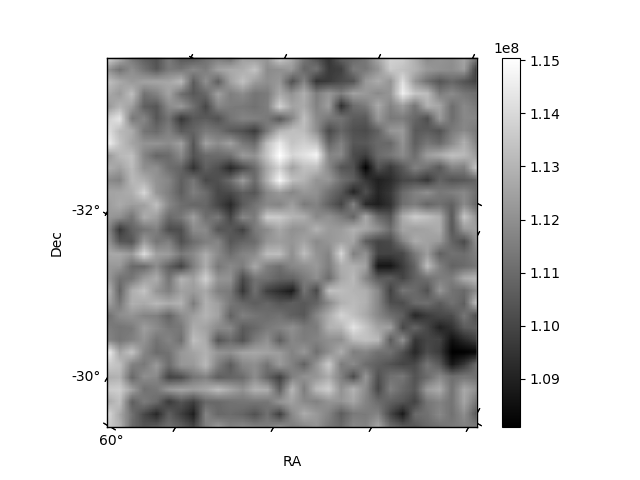
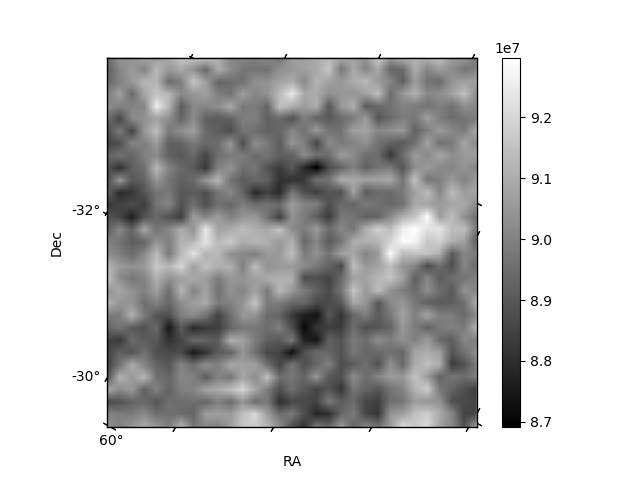
Histogram calculated using DETX and DETY for each event in the final _common_clean file
| Quadrant A | 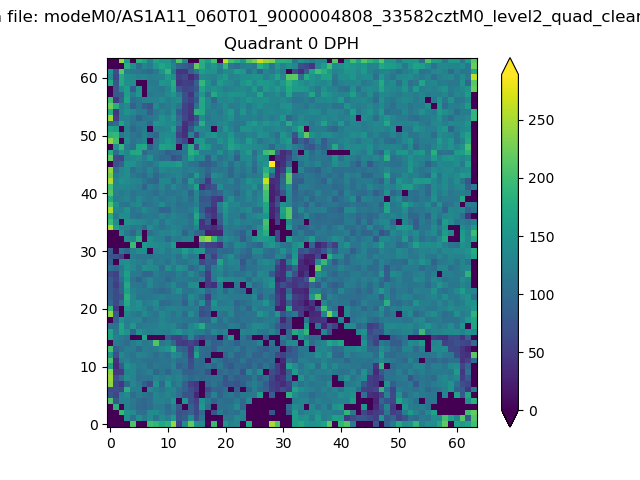 |
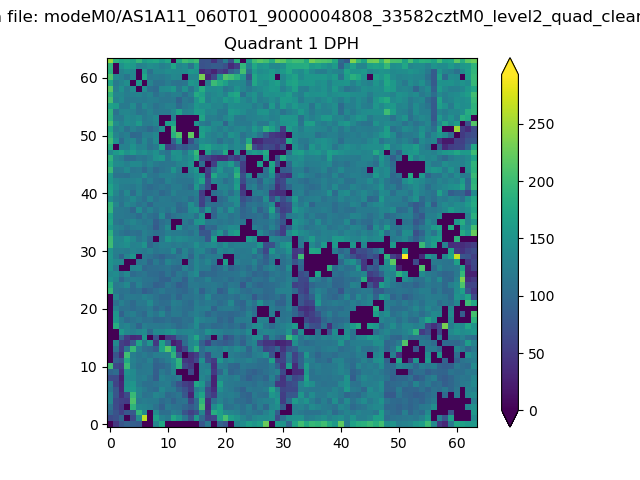 |
Quadrant B |
|---|---|---|---|
| Quadrant D |  |
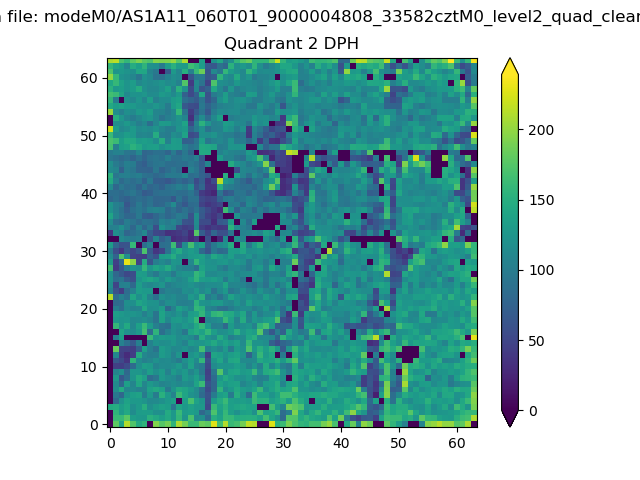 |
Quadrant C |
| Plot type | Count rate plots | Images |
|---|---|---|
| Comparison with Poisson distribution Blue bars denote a histogram of data divided into 1 sec bins. Red curve is a Poisson curve with rate = median count rate of data. |
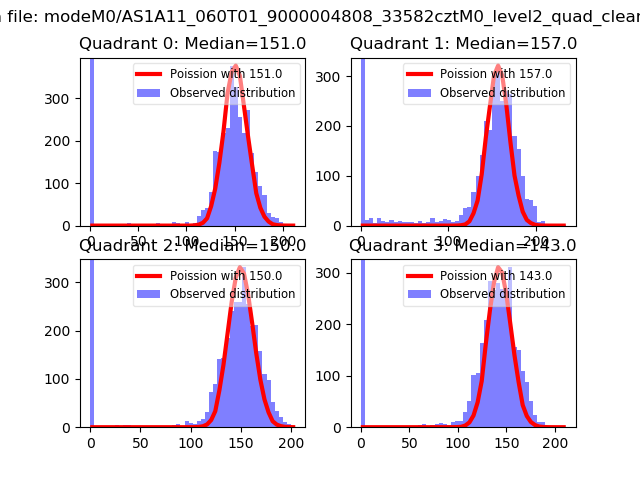 |
 |
| Quadrant-wise count rates Data is divided into 100 sec bins |
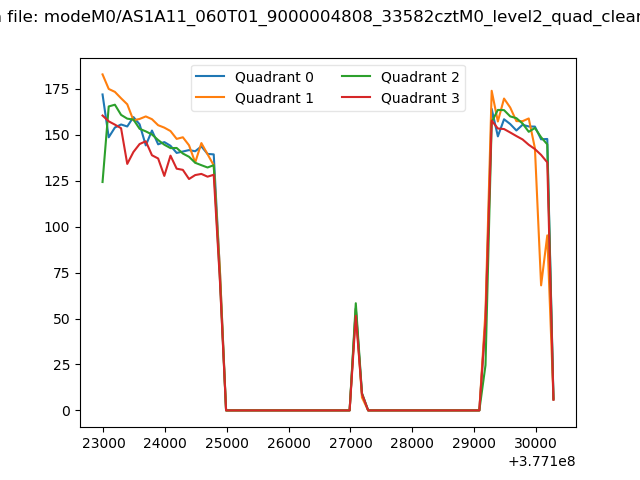 |
|
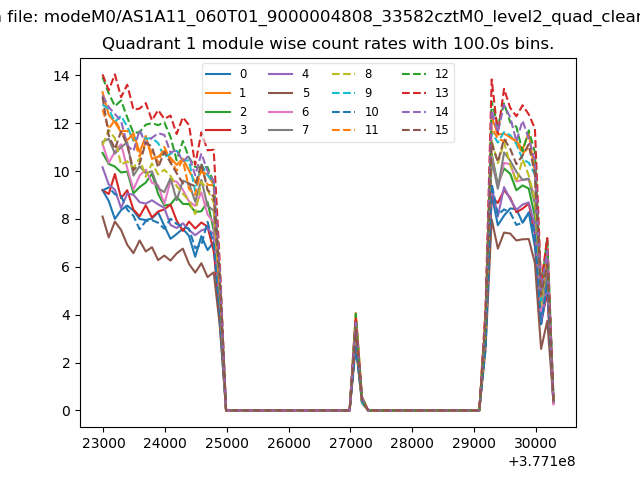
| Module-wise count rates for Quadrant A Data is divided into 100 sec bins |
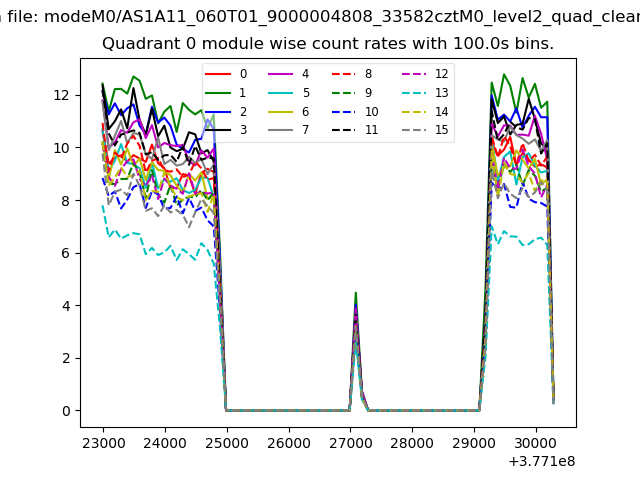 |
 |
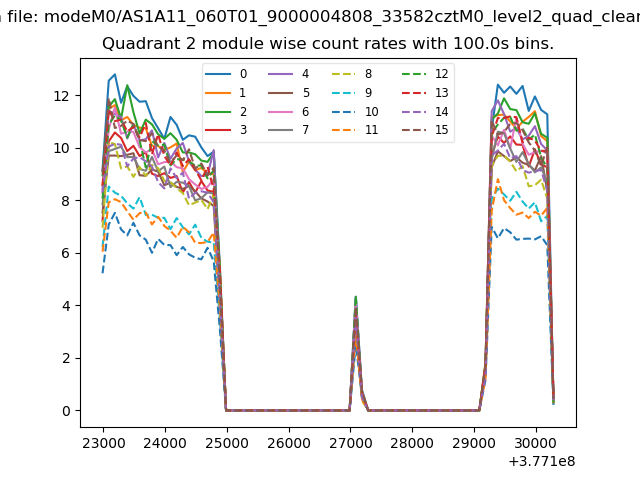
| Module-wise count rates for Quadrant B Data is divided into 100 sec bins |
 |
 |
| Module-wise count rates for Quadrant C Data is divided into 100 sec bins |
 |
 |
| Module-wise count rates for Quadrant D Data is divided into 100 sec bins |
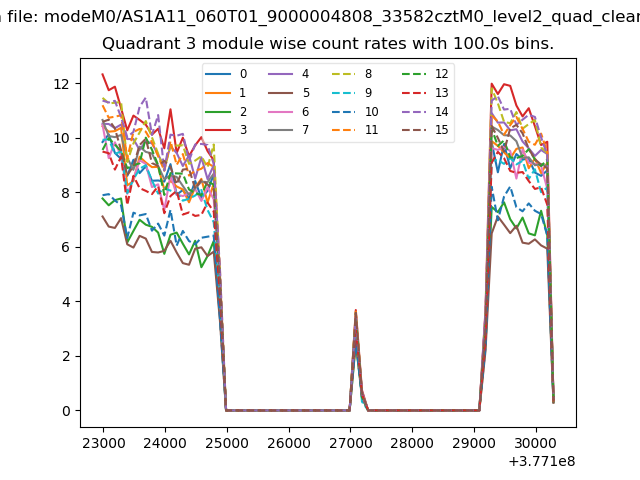 |
 |
| Parameter | Plot |
|---|---|
| CZT HV Monitor |  |
| D_VDD | 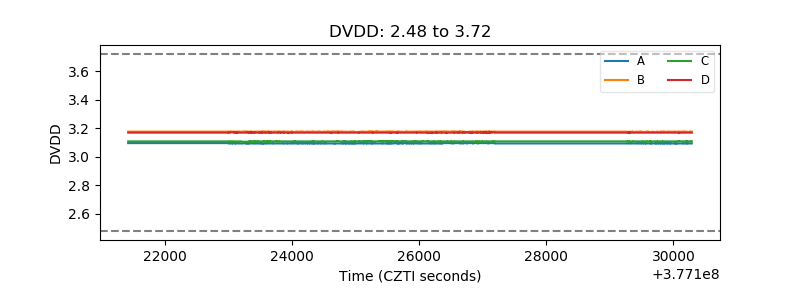 |
| Temperature 1 | 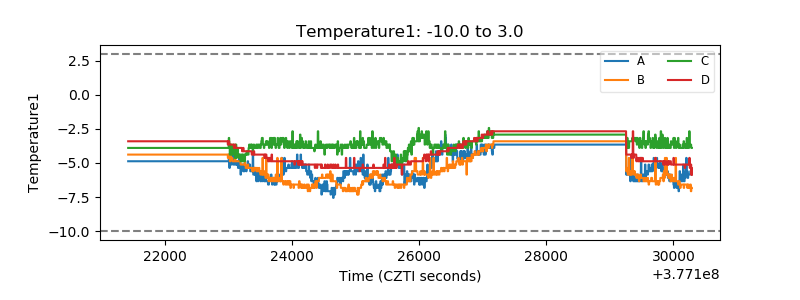 |
| Veto HV Monitor | 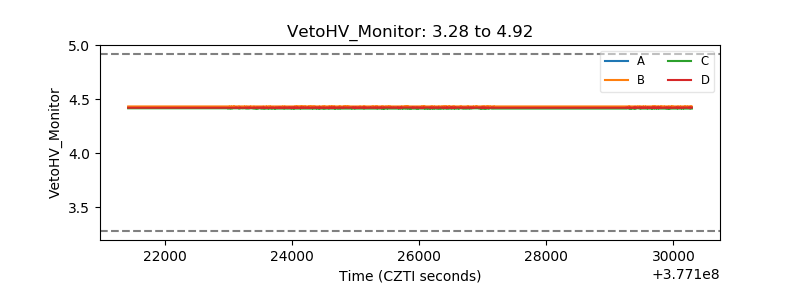 |
| Veto LLD | 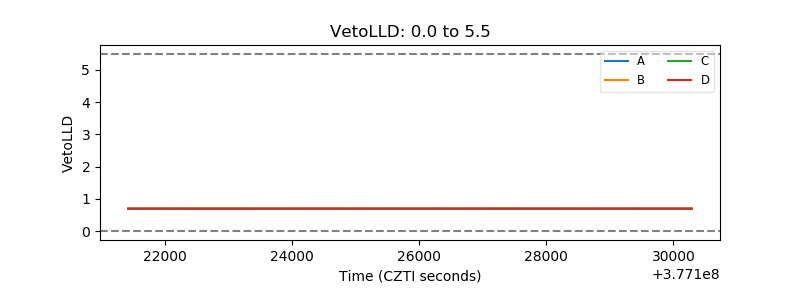 |
| Alpha Counter | 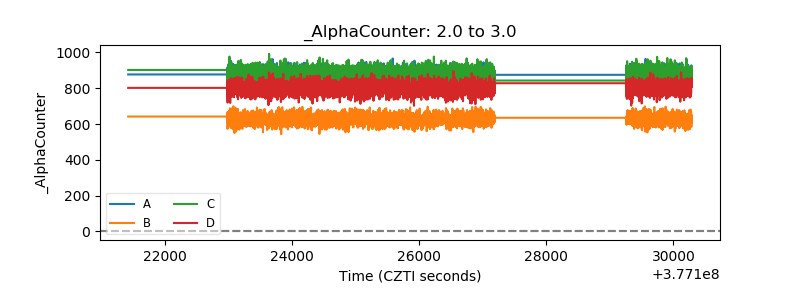 |
| _CPM_Rate | 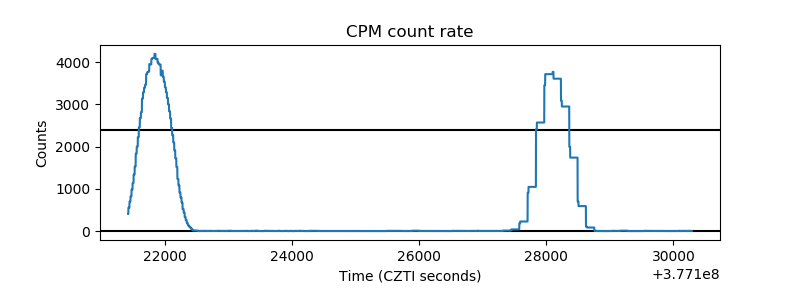 |
| CZT Counter | 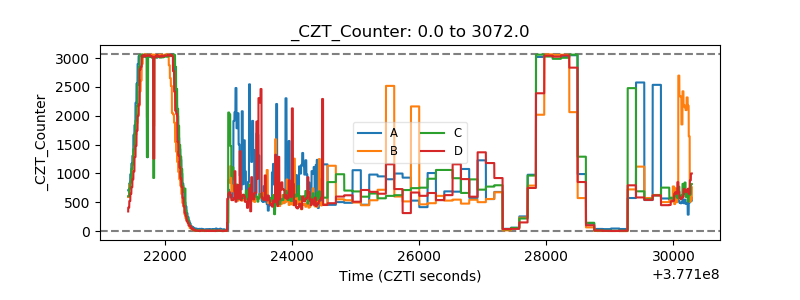 |
| +2.5 Volts monitor |  |
| +5 Volts monitor |  |
| _ROLL_ROT | 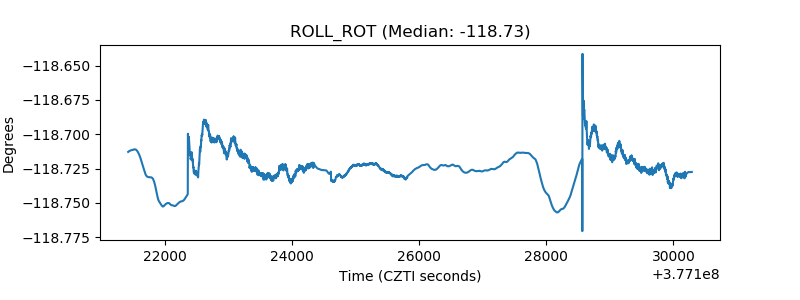 |
| _Roll_DEC |  |
| _Roll_RA | 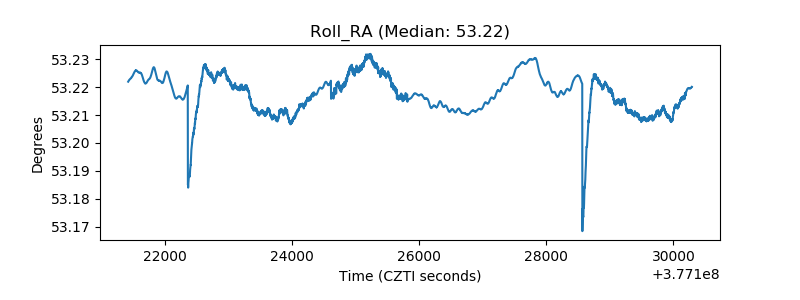 |
| Veto Counter | 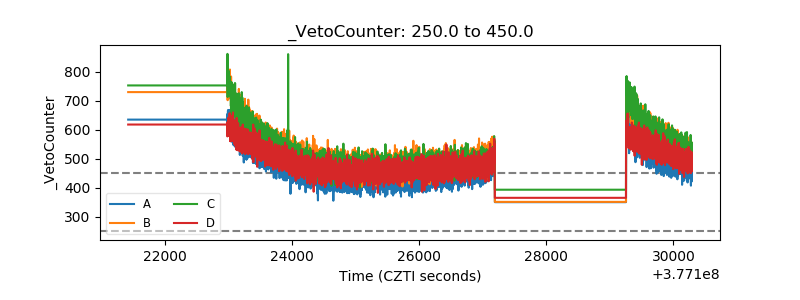 |