| Param | Original file | Final file |
|---|---|---|
| Filename | modeM0/AS1A11_060T01_9000004808_33584cztM0_level2.evt | modeM0/AS1A11_060T01_9000004808_33584cztM0_level2_quad_clean.evt |
| Size (bytes) | 503,651,520 | 59,929,920 |
| Size | 480.3 MB | 57.2 MB |
| Events in quadrant A | 2,653,098 | 378,371 |
| Events in quadrant B | 4,003,543 | 361,402 |
| Events in quadrant C | 3,483,834 | 370,032 |
| Events in quadrant D | 4,766,114 | 345,913 |
| Mode M0 | |||
|---|---|---|---|
| Quadrant | BADHDUFLAG | Total packets | Discarded packets |
| A | 0 | 10717 | 2 |
| B | 0 | 15034 | 1 |
| C | 0 | 13725 | 1 |
| D | 0 | 17756 | 1 |
| Mode M9 | |||
|---|---|---|---|
| Quadrant | BADHDUFLAG | Total packets | Discarded packets |
| A | 0 | 34 | 0 |
| B | 0 | 34 | 0 |
| C | 0 | 34 | 0 |
| D | 0 | 35 | 0 |
| Mode SS | |||
|---|---|---|---|
| Quadrant | BADHDUFLAG | Total packets | Discarded packets |
| A | 0 | 104 | 0 |
| B | 0 | 104 | 0 |
| C | 0 | 104 | 0 |
| D | 0 | 104 | 0 |
| Quadrant | Total seconds | Saturated seconds | Saturation percentage |
|---|---|---|---|
| A | 5118 | 8 | 0.156311% |
| B | 5118 | 485 | 9.476358% |
| C | 5118 | 114 | 2.227433% |
| D | 5118 | 412 | 8.050020% |
Noise dominated data is calculated using 1-second bins in cleaned event files. If a bin has >2000 counts, and if more than 50% of those come from <1% of pixels, then it is considered to be noise-dominated and hence unusable.
| Quadrant | # 1 sec bins | Bins with >0 counts | Bins with >2000 counts | High rate bins dominated by noise | Noise dominated (total time) | Noise dominated (detector-on time) | Marked lightcurve |
|---|---|---|---|---|---|---|---|
| A | 7241 | 5119 | 0 | 0 | 0.00% | 0.00% | 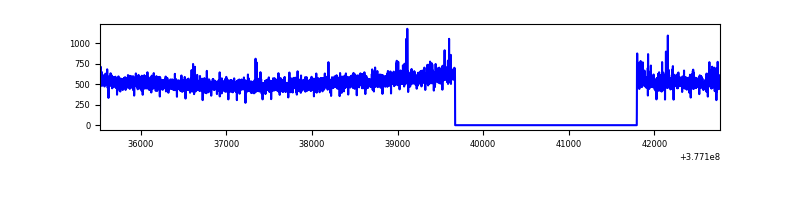 |
| B | 7241 | 5118 | 385 | 385 | 5.32% | 7.52% | 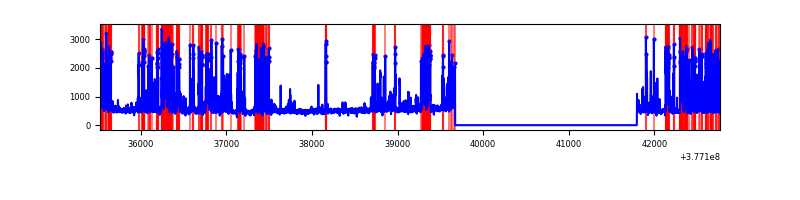 |
| C | 7241 | 5119 | 111 | 111 | 1.53% | 2.17% | 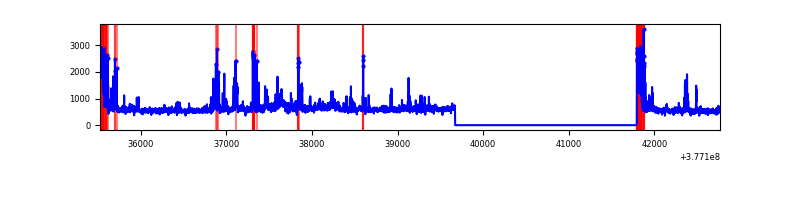 |
| D | 7241 | 5119 | 409 | 409 | 5.65% | 7.99% | 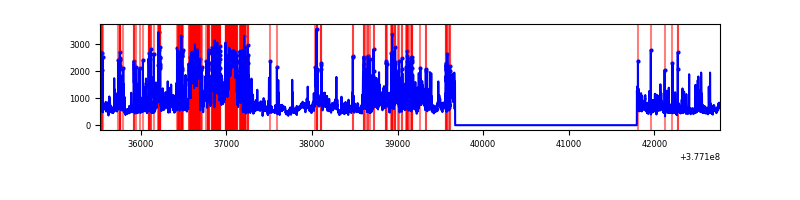 |
Top three noisy pixels from each quadrant. If the there are fewer than three noisy pixels in the level2.evt file, extra rows are filled as -1
| Pixel properties | Quadrant properties | ||||||
|---|---|---|---|---|---|---|---|
| Quadrant | DetID | PixID | Counts | Sigma | Mean | Median | Sigma |
| A | 15 | 169 | 209894 | 1646.26 | 629 | 619 | 127.1 |
| A | 13 | 254 | 8147 | 59.22 | 629 | 619 | 127.1 |
| A | 3 | 137 | 6016 | 42.46 | 629 | 619 | 127.1 |
| B | 5 | 172 | 1503253 | 13146.55 | 607 | 593 | 114.3 |
| B | 0 | 190 | 54405 | 470.79 | 607 | 593 | 114.3 |
| B | 4 | 171 | 27665 | 236.85 | 607 | 593 | 114.3 |
| C | 3 | 233 | 461855 | 3228.57 | 619 | 627 | 142.9 |
| C | 0 | 10 | 374590 | 2617.72 | 619 | 627 | 142.9 |
| C | 15 | 214 | 217282 | 1516.57 | 619 | 627 | 142.9 |
| D | 1 | 47 | 1022504 | 6937.06 | 603 | 587 | 147.3 |
| D | 8 | 195 | 509198 | 3452.6 | 603 | 587 | 147.3 |
| D | 13 | 249 | 305795 | 2071.84 | 603 | 587 | 147.3 |
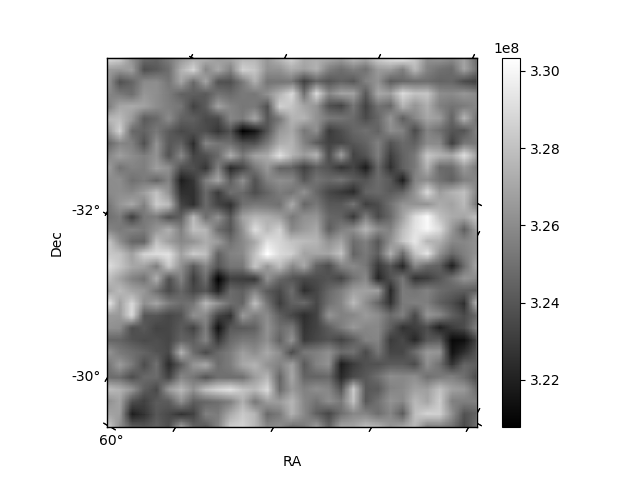
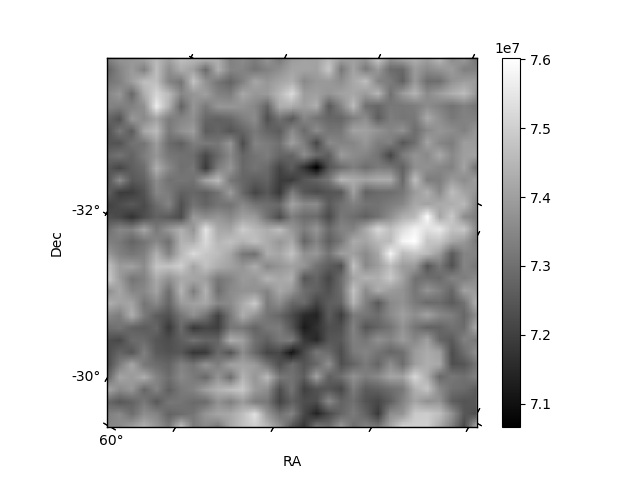
Histogram calculated using DETX and DETY for each event in the final _common_clean file
| Quadrant A | 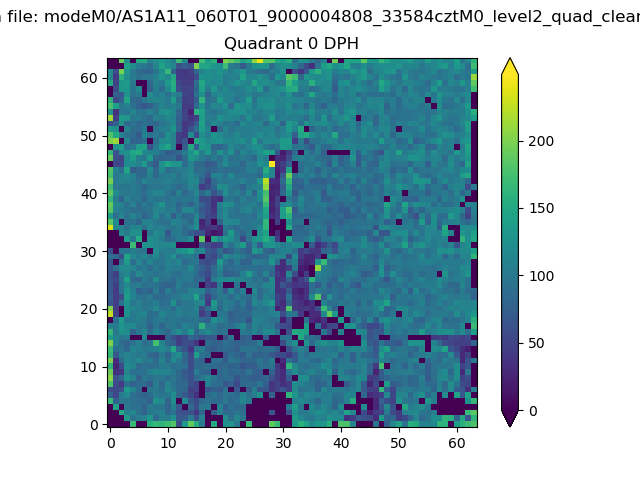 |
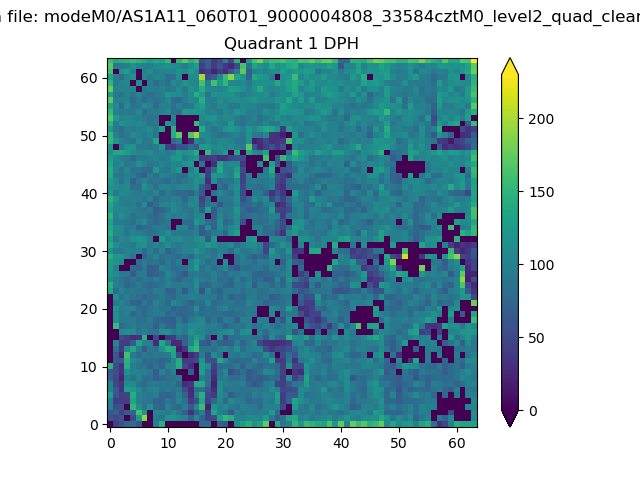 |
Quadrant B |
|---|---|---|---|
| Quadrant D | 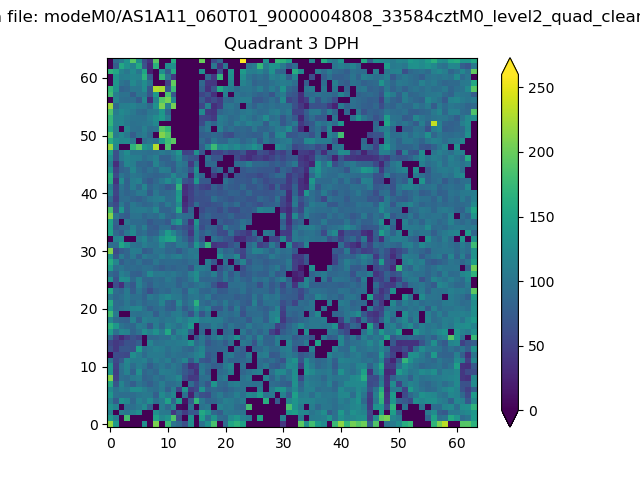 |
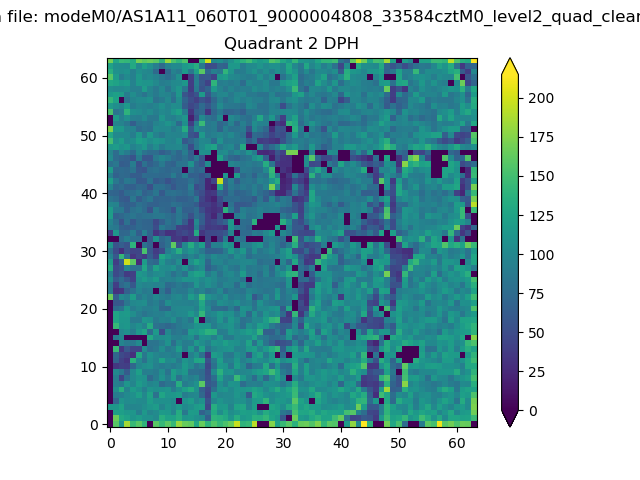 |
Quadrant C |
| Plot type | Count rate plots | Images |
|---|---|---|
| Comparison with Poisson distribution Blue bars denote a histogram of data divided into 1 sec bins. Red curve is a Poisson curve with rate = median count rate of data. |
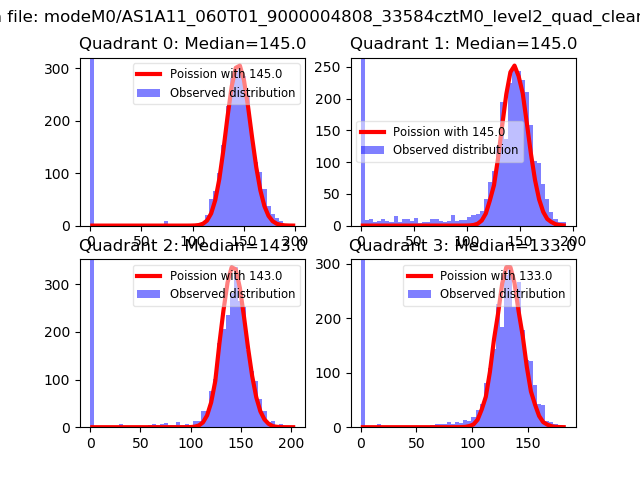 |
 |
| Quadrant-wise count rates Data is divided into 100 sec bins |
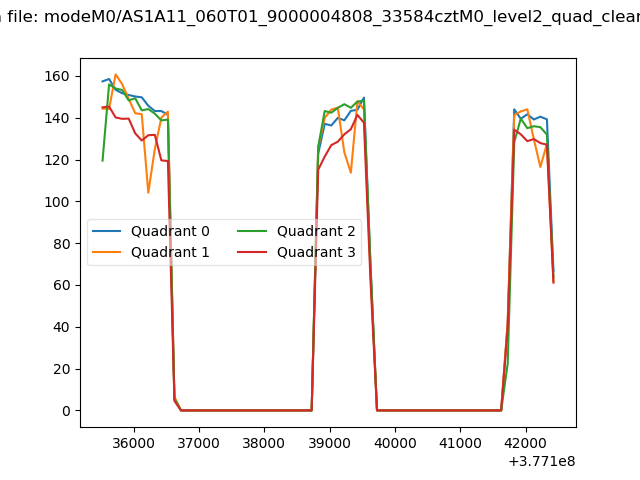 |
|
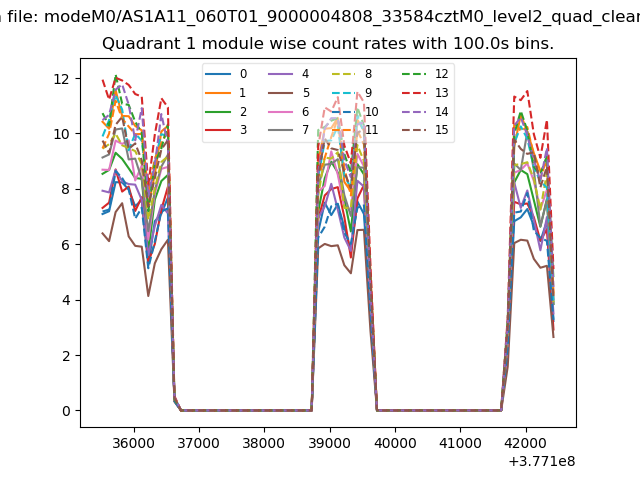
| Module-wise count rates for Quadrant A Data is divided into 100 sec bins |
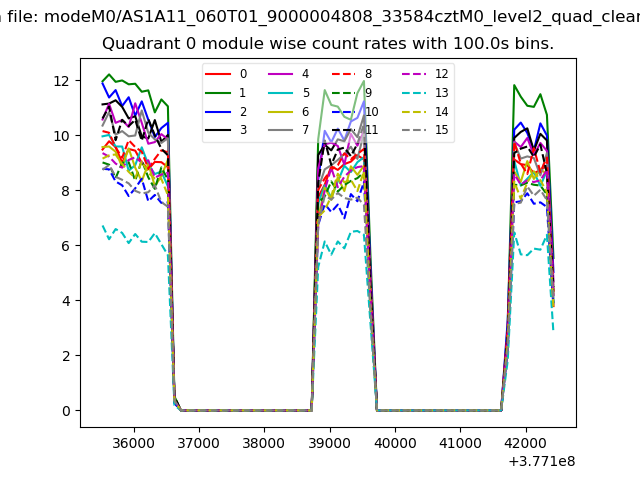 |
 |
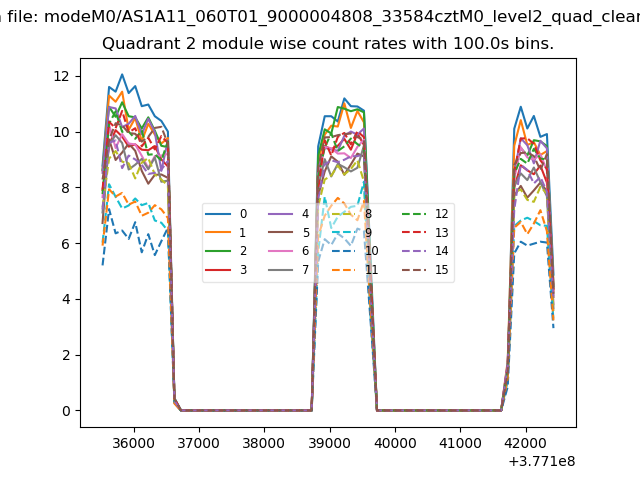
| Module-wise count rates for Quadrant B Data is divided into 100 sec bins |
 |
 |
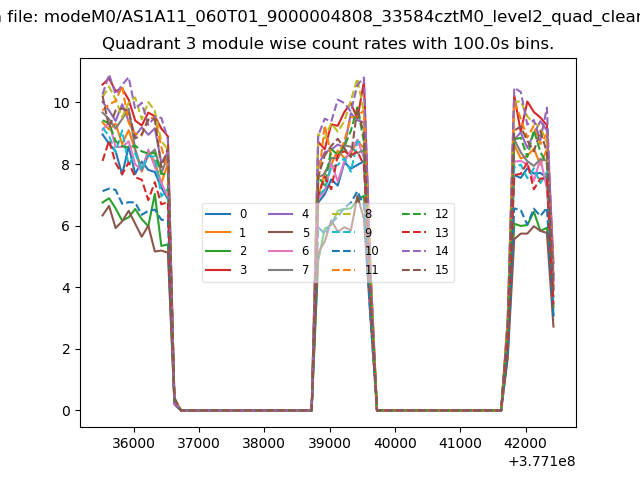
| Module-wise count rates for Quadrant C Data is divided into 100 sec bins |
 |
 |
| Module-wise count rates for Quadrant D Data is divided into 100 sec bins |
 |
 |
| Parameter | Plot |
|---|---|
| CZT HV Monitor | 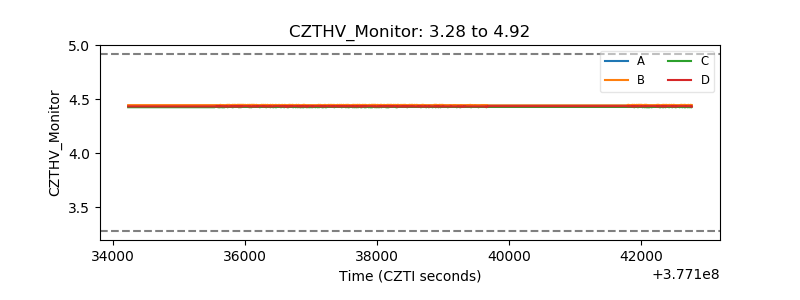 |
| D_VDD | 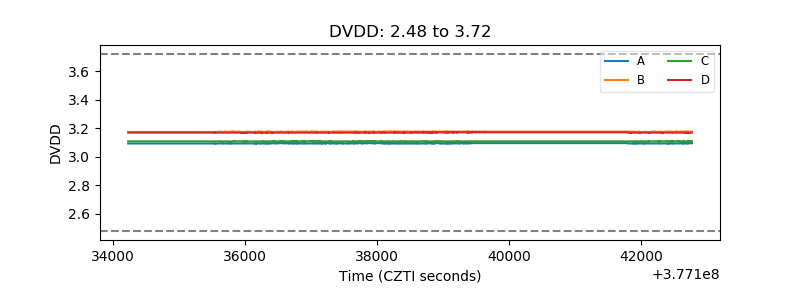 |
| Temperature 1 |  |
| Veto HV Monitor | 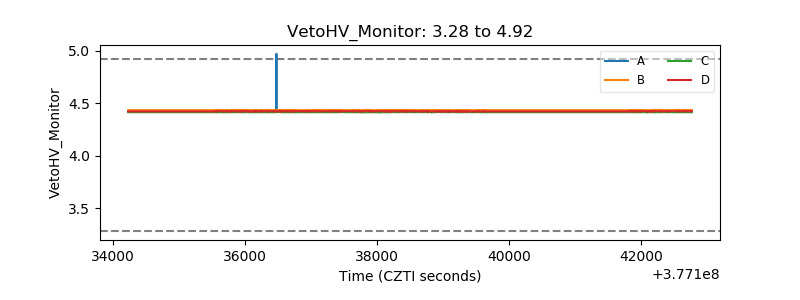 |
| Veto LLD | 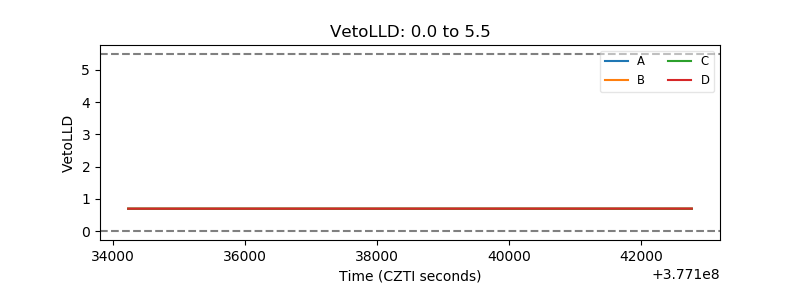 |
| Alpha Counter | 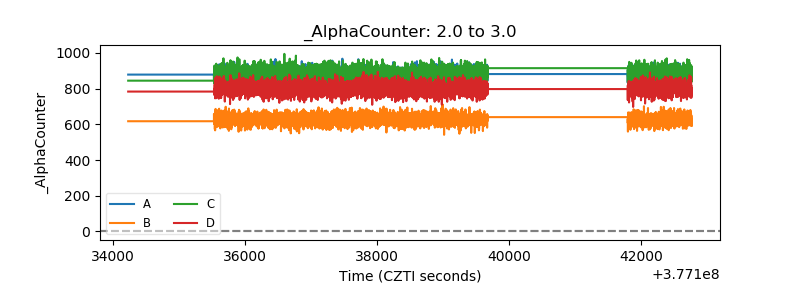 |
| _CPM_Rate | 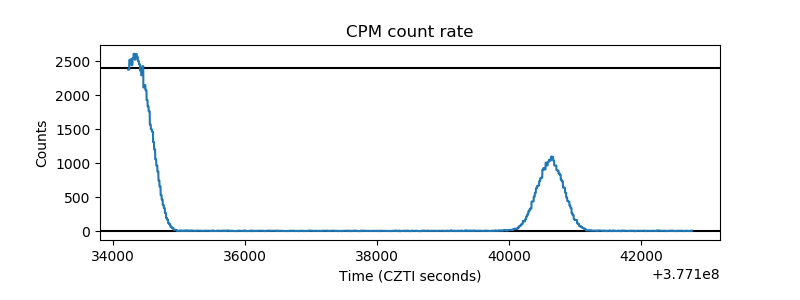 |
| CZT Counter | 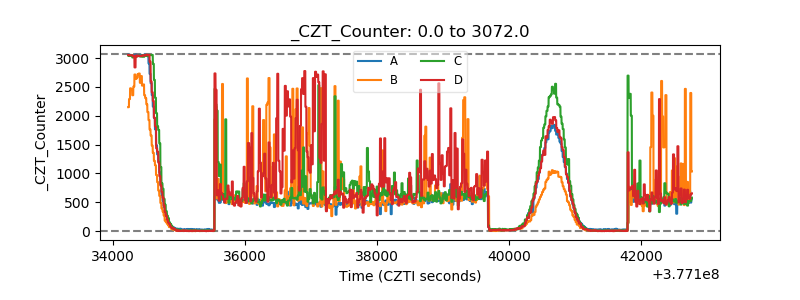 |
| +2.5 Volts monitor |  |
| +5 Volts monitor | 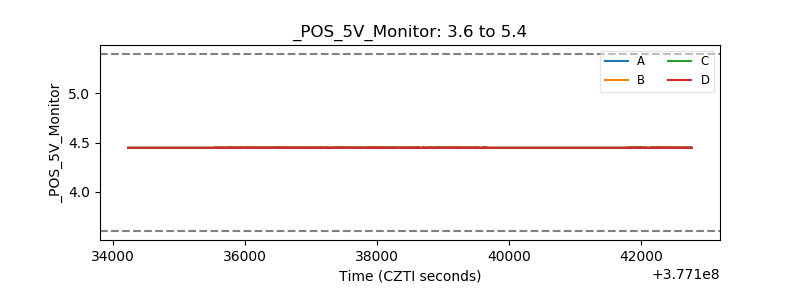 |
| _ROLL_ROT | 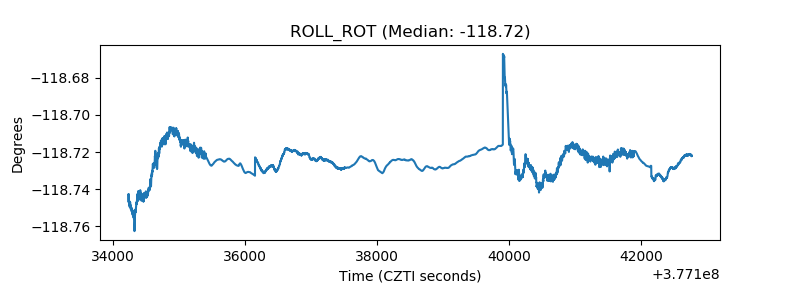 |
| _Roll_DEC | 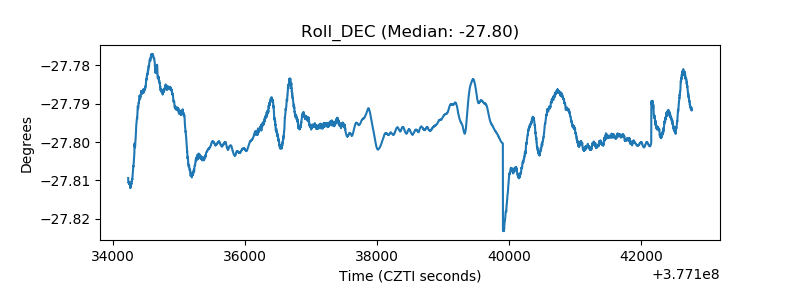 |
| _Roll_RA | 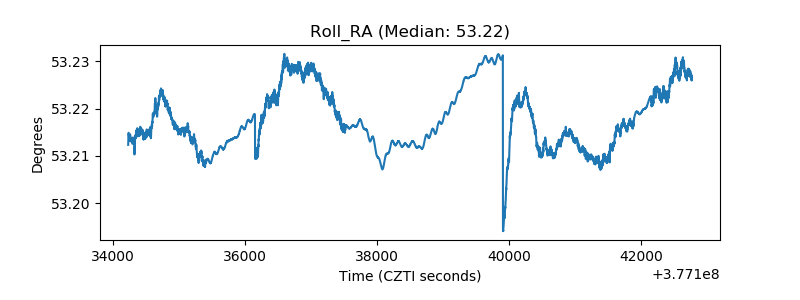 |
| Veto Counter | 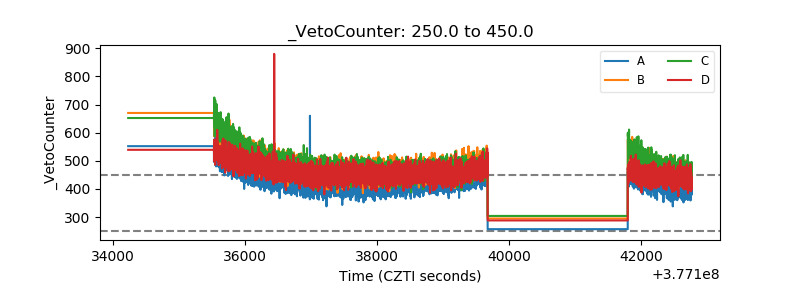 |