| Param | Original file | Final file |
|---|---|---|
| Filename | modeM0/AS1A11_060T01_9000004808_33585cztM0_level2.evt | modeM0/AS1A11_060T01_9000004808_33585cztM0_level2_quad_clean.evt |
| Size (bytes) | 533,799,360 | 51,344,640 |
| Size | 509.1 MB | 49.0 MB |
| Events in quadrant A | 4,549,209 | 278,821 |
| Events in quadrant B | 4,160,044 | 301,539 |
| Events in quadrant C | 3,326,789 | 311,806 |
| Events in quadrant D | 3,782,539 | 302,329 |
| Mode M0 | |||
|---|---|---|---|
| Quadrant | BADHDUFLAG | Total packets | Discarded packets |
| A | 0 | 16511 | 3 |
| B | 0 | 15612 | 2 |
| C | 0 | 12985 | 2 |
| D | 0 | 14751 | 2 |
| Mode M9 | |||
|---|---|---|---|
| Quadrant | BADHDUFLAG | Total packets | Discarded packets |
| A | 0 | 29 | 0 |
| B | 0 | 29 | 0 |
| C | 0 | 29 | 0 |
| D | 0 | 30 | 0 |
| Mode SS | |||
|---|---|---|---|
| Quadrant | BADHDUFLAG | Total packets | Discarded packets |
| A | 0 | 104 | 0 |
| B | 0 | 104 | 0 |
| C | 0 | 104 | 0 |
| D | 0 | 104 | 0 |
| Quadrant | Total seconds | Saturated seconds | Saturation percentage |
|---|---|---|---|
| A | 5131 | 925 | 18.027675% |
| B | 5131 | 570 | 11.108946% |
| C | 5131 | 131 | 2.553109% |
| D | 5131 | 70 | 1.364256% |
Noise dominated data is calculated using 1-second bins in cleaned event files. If a bin has >2000 counts, and if more than 50% of those come from <1% of pixels, then it is considered to be noise-dominated and hence unusable.
| Quadrant | # 1 sec bins | Bins with >0 counts | Bins with >2000 counts | High rate bins dominated by noise | Noise dominated (total time) | Noise dominated (detector-on time) | Marked lightcurve |
|---|---|---|---|---|---|---|---|
| A | 7104 | 5132 | 869 | 869 | 12.23% | 16.93% | 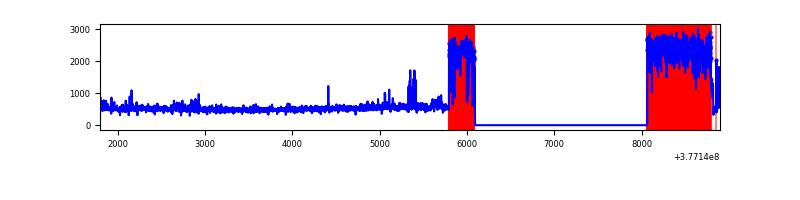 |
| B | 7104 | 5131 | 459 | 459 | 6.46% | 8.95% | 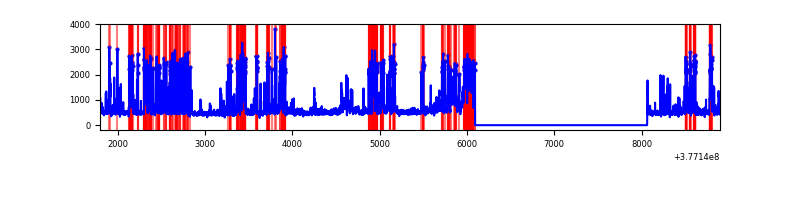 |
| C | 7104 | 5132 | 120 | 120 | 1.69% | 2.34% | 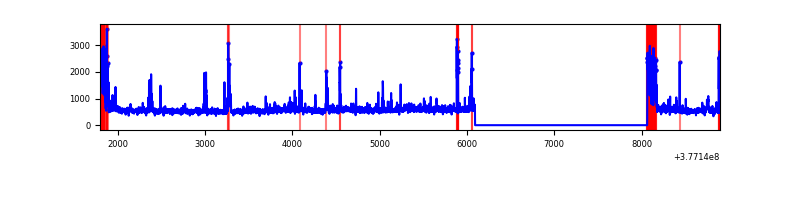 |
| D | 7104 | 5132 | 60 | 60 | 0.84% | 1.17% | 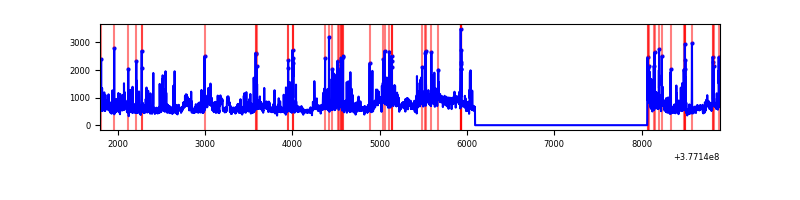 |
Top three noisy pixels from each quadrant. If the there are fewer than three noisy pixels in the level2.evt file, extra rows are filled as -1
| Pixel properties | Quadrant properties | ||||||
|---|---|---|---|---|---|---|---|
| Quadrant | DetID | PixID | Counts | Sigma | Mean | Median | Sigma |
| A | 15 | 169 | 2317127 | 20249.06 | 563 | 552 | 114.4 |
| A | 12 | 16 | 36860 | 317.37 | 563 | 552 | 114.4 |
| A | 12 | 194 | 9775 | 80.62 | 563 | 552 | 114.4 |
| B | 5 | 172 | 1690868 | 14928.98 | 588 | 571 | 113.2 |
| B | 15 | 222 | 63333 | 554.32 | 588 | 571 | 113.2 |
| B | 0 | 190 | 53311 | 465.81 | 588 | 571 | 113.2 |
| C | 0 | 10 | 393269 | 2818.97 | 602 | 606 | 139.3 |
| C | 3 | 233 | 354525 | 2540.82 | 602 | 606 | 139.3 |
| C | 15 | 214 | 216602 | 1550.66 | 602 | 606 | 139.3 |
| D | 8 | 195 | 562131 | 3785.04 | 600 | 584 | 148.4 |
| D | 1 | 52 | 270106 | 1816.68 | 600 | 584 | 148.4 |
| D | 13 | 249 | 188698 | 1267.96 | 600 | 584 | 148.4 |
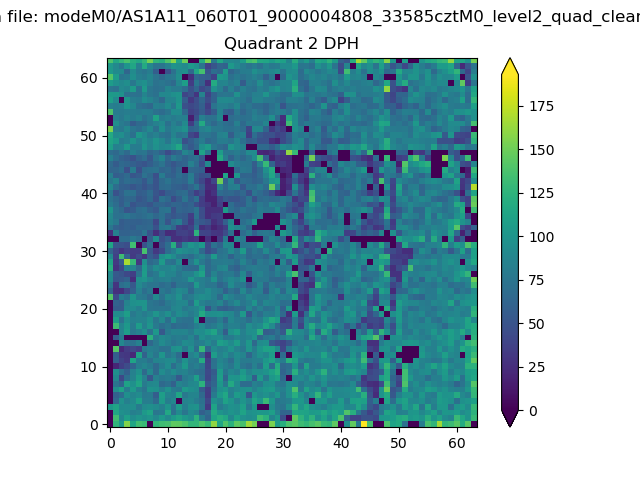
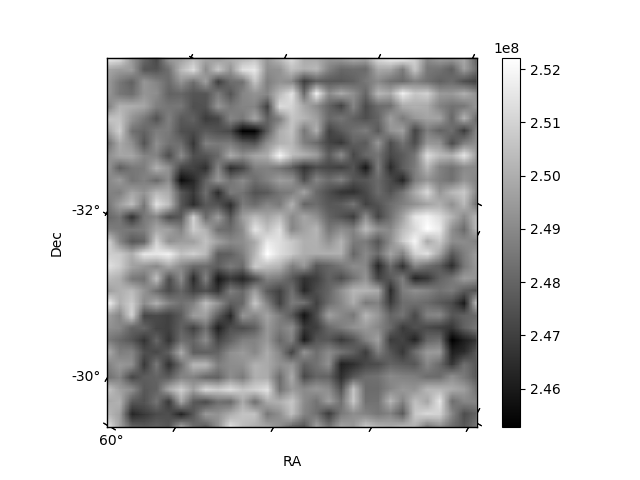
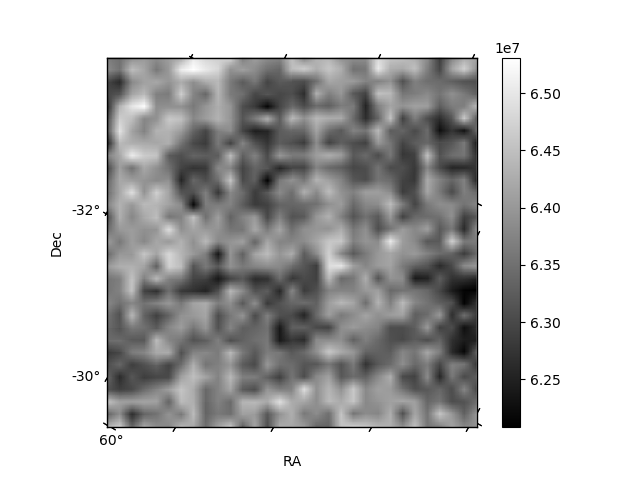
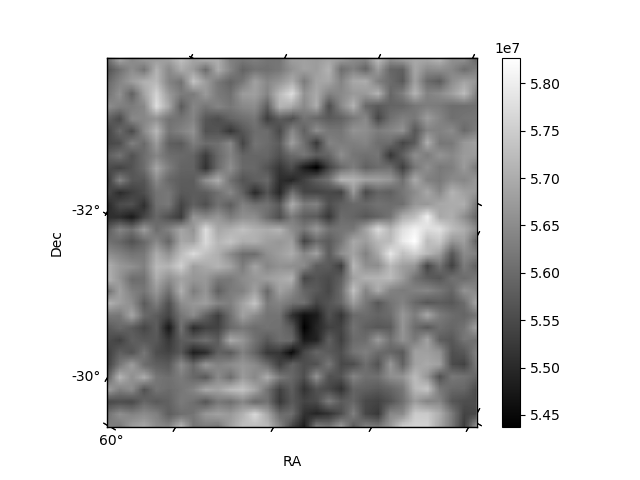
Histogram calculated using DETX and DETY for each event in the final _common_clean file
| Quadrant A | 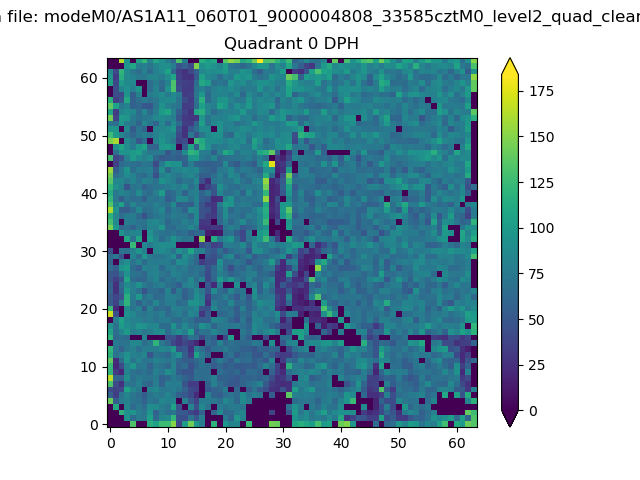 |
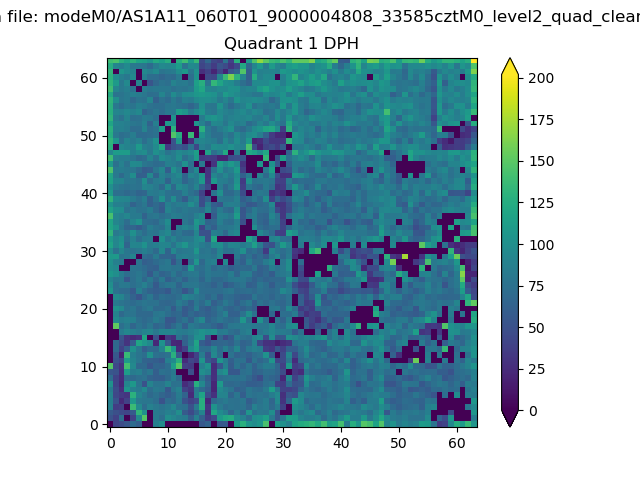 |
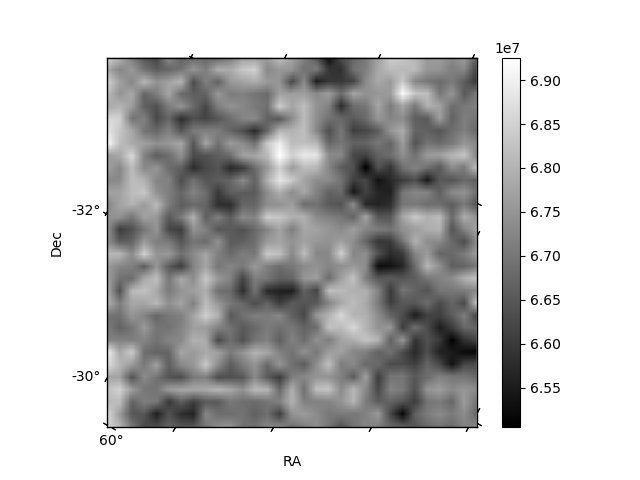
Quadrant B |
|---|---|---|---|
| Quadrant D | 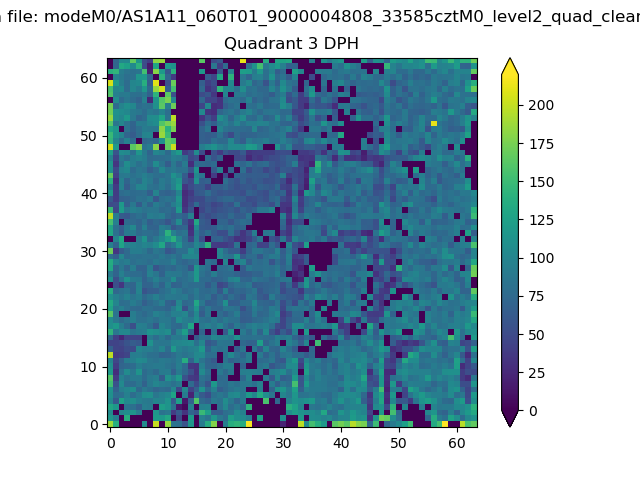 |
 |
Quadrant C |
| Plot type | Count rate plots | Images |
|---|---|---|
| Comparison with Poisson distribution Blue bars denote a histogram of data divided into 1 sec bins. Red curve is a Poisson curve with rate = median count rate of data. |
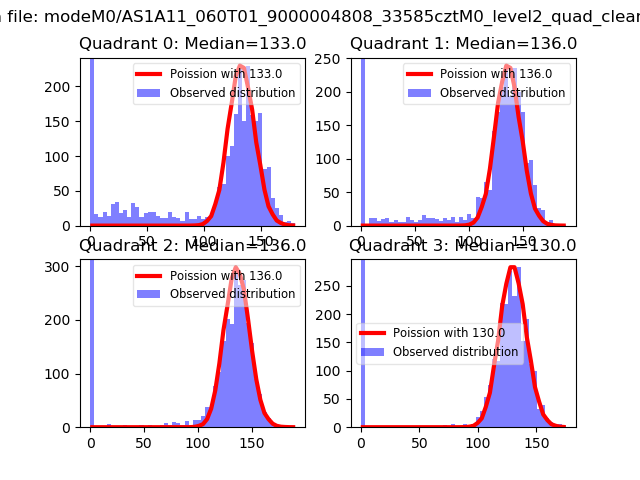 |
 |
| Quadrant-wise count rates Data is divided into 100 sec bins |
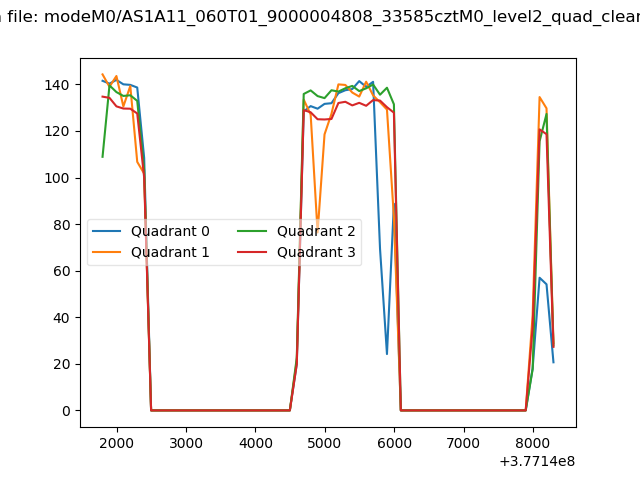 |
|
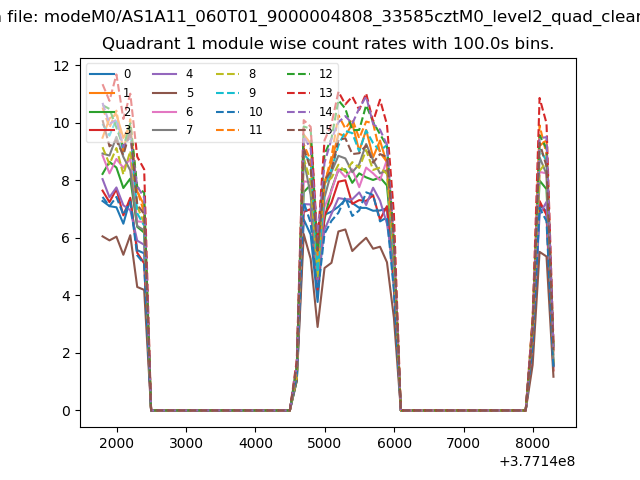
| Module-wise count rates for Quadrant A Data is divided into 100 sec bins |
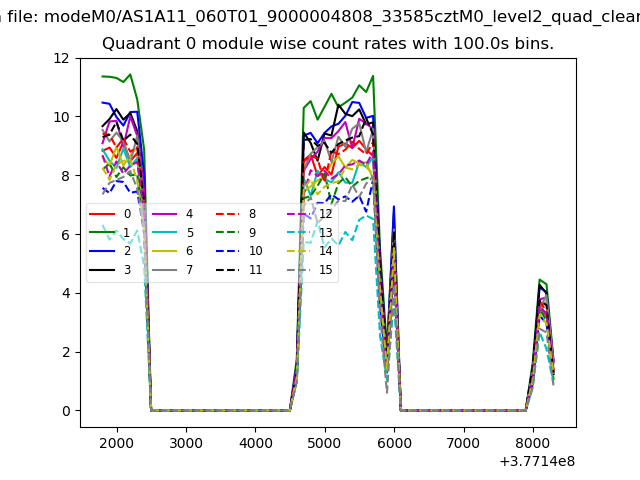 |
 |
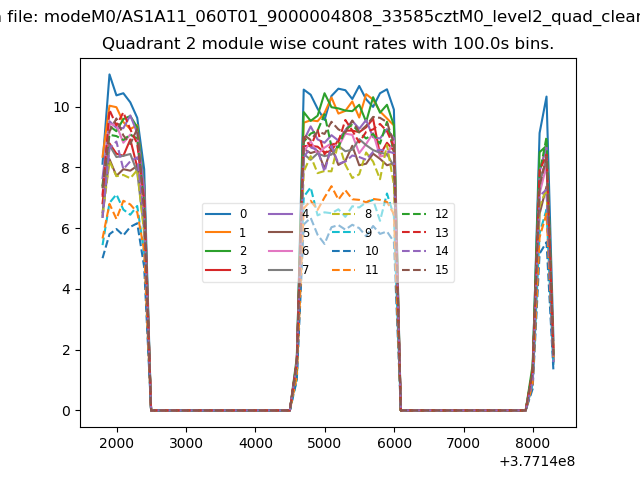
| Module-wise count rates for Quadrant B Data is divided into 100 sec bins |
 |
 |
| Module-wise count rates for Quadrant C Data is divided into 100 sec bins |
 |
 |
| Module-wise count rates for Quadrant D Data is divided into 100 sec bins |
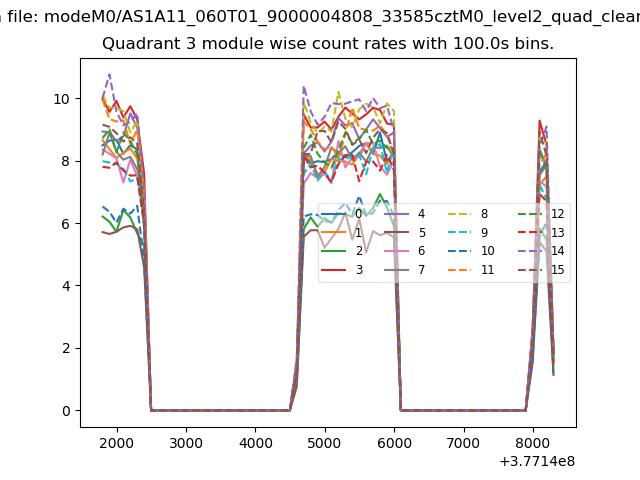 |
 |
| Parameter | Plot |
|---|---|
| CZT HV Monitor | 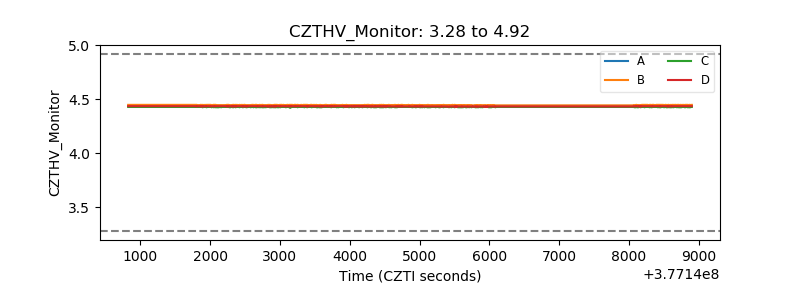 |
| D_VDD | 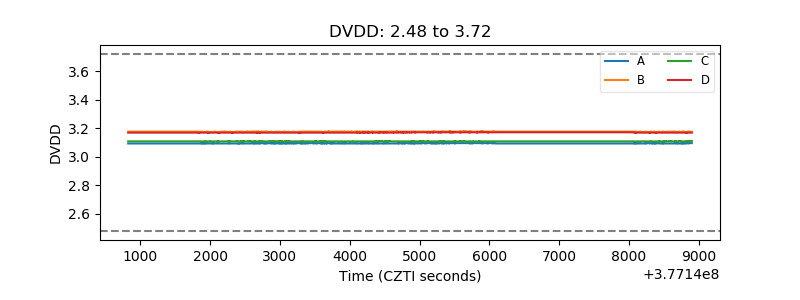 |
| Temperature 1 | 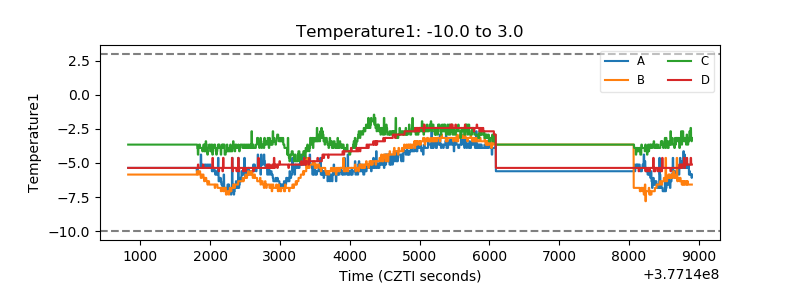 |
| Veto HV Monitor | 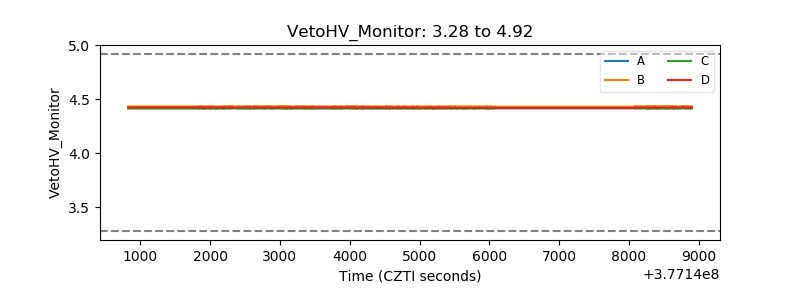 |
| Veto LLD | 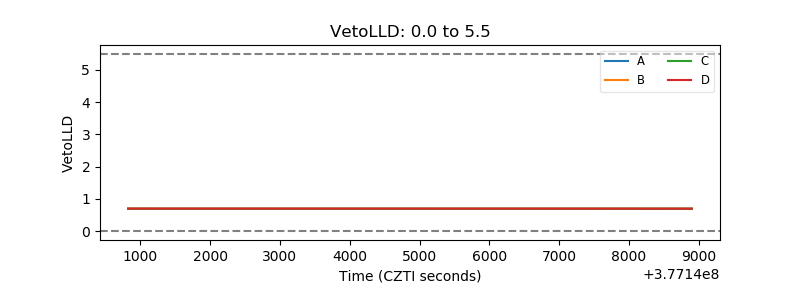 |
| Alpha Counter | 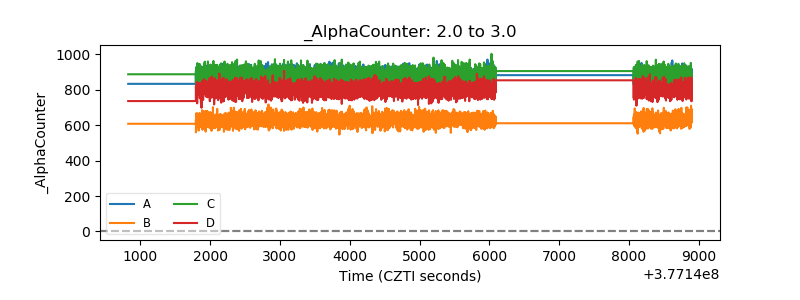 |
| _CPM_Rate | 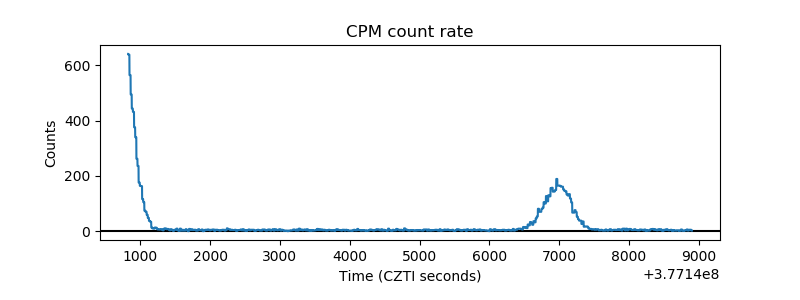 |
| CZT Counter | 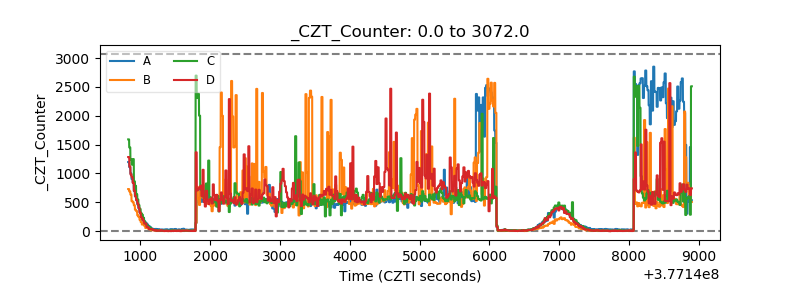 |
| +2.5 Volts monitor |  |
| +5 Volts monitor |  |
| _ROLL_ROT |  |
| _Roll_DEC |  |
| _Roll_RA | 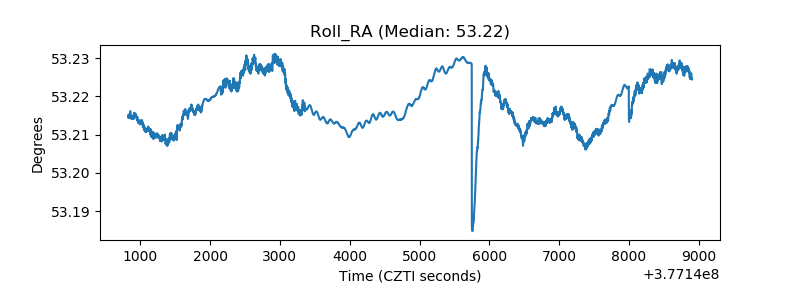 |
| Veto Counter |  |