| Param | Original file | Final file |
|---|---|---|
| Filename | modeM0/AS1A11_060T01_9000004808_33586cztM0_level2.evt | modeM0/AS1A11_060T01_9000004808_33586cztM0_level2_quad_clean.evt |
| Size (bytes) | 675,757,440 | 54,717,120 |
| Size | 644.5 MB | 52.2 MB |
| Events in quadrant A | 7,385,442 | 286,950 |
| Events in quadrant B | 4,702,732 | 310,404 |
| Events in quadrant C | 3,635,242 | 338,716 |
| Events in quadrant D | 4,361,304 | 325,392 |
| Mode M0 | |||
|---|---|---|---|
| Quadrant | BADHDUFLAG | Total packets | Discarded packets |
| A | 0 | 26021 | 3 |
| B | 0 | 17600 | 2 |
| C | 0 | 14192 | 2 |
| D | 0 | 16980 | 2 |
| Mode M9 | |||
|---|---|---|---|
| Quadrant | BADHDUFLAG | Total packets | Discarded packets |
| A | 0 | 37 | 0 |
| B | 0 | 37 | 0 |
| C | 0 | 37 | 0 |
| D | 0 | 37 | 0 |
| Mode SS | |||
|---|---|---|---|
| Quadrant | BADHDUFLAG | Total packets | Discarded packets |
| A | 0 | 116 | 0 |
| B | 0 | 116 | 0 |
| C | 0 | 116 | 0 |
| D | 0 | 116 | 0 |
| Quadrant | Total seconds | Saturated seconds | Saturation percentage |
|---|---|---|---|
| A | 5641 | 1518 | 26.910122% |
| B | 5641 | 686 | 12.160964% |
| C | 5641 | 102 | 1.808190% |
| D | 5641 | 128 | 2.269101% |
Noise dominated data is calculated using 1-second bins in cleaned event files. If a bin has >2000 counts, and if more than 50% of those come from <1% of pixels, then it is considered to be noise-dominated and hence unusable.
| Quadrant | # 1 sec bins | Bins with >0 counts | Bins with >2000 counts | High rate bins dominated by noise | Noise dominated (total time) | Noise dominated (detector-on time) | Marked lightcurve |
|---|---|---|---|---|---|---|---|
| A | 9257 | 5643 | 1282 | 1282 | 13.85% | 22.72% | 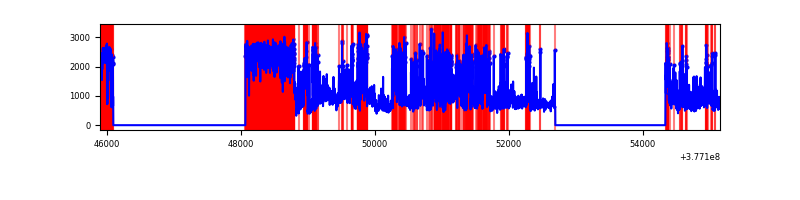 |
| B | 9257 | 5642 | 559 | 559 | 6.04% | 9.91% | 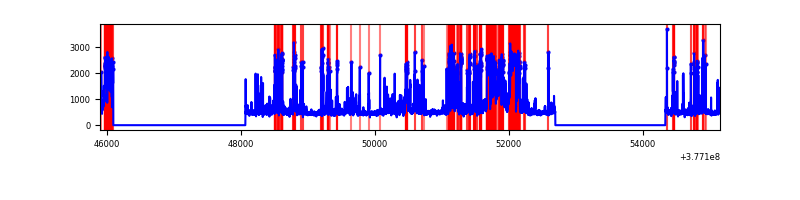 |
| C | 9257 | 5643 | 93 | 93 | 1.00% | 1.65% | 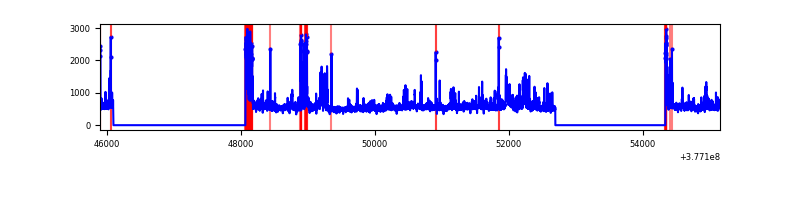 |
| D | 9257 | 5643 | 128 | 128 | 1.38% | 2.27% | 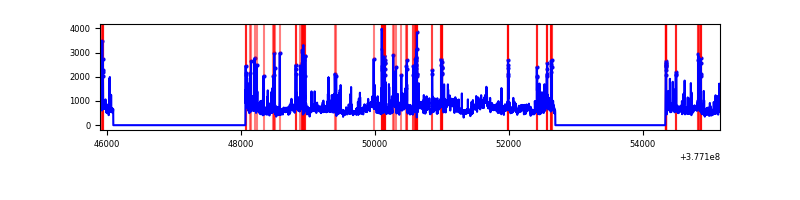 |
Top three noisy pixels from each quadrant. If the there are fewer than three noisy pixels in the level2.evt file, extra rows are filled as -1
| Pixel properties | Quadrant properties | ||||||
|---|---|---|---|---|---|---|---|
| Quadrant | DetID | PixID | Counts | Sigma | Mean | Median | Sigma |
| A | 15 | 169 | 4689552 | 39529.65 | 589 | 579 | 118.6 |
| A | 12 | 16 | 349077 | 2937.96 | 589 | 579 | 118.6 |
| A | 12 | 194 | 56425 | 470.8 | 589 | 579 | 118.6 |
| B | 5 | 172 | 2015874 | 16575.67 | 627 | 610 | 121.6 |
| B | 0 | 190 | 76764 | 626.37 | 627 | 610 | 121.6 |
| B | 4 | 251 | 67112 | 546.98 | 627 | 610 | 121.6 |
| C | 3 | 233 | 575780 | 3800.41 | 648 | 652 | 151.3 |
| C | 0 | 10 | 285414 | 1881.69 | 648 | 652 | 151.3 |
| C | 15 | 214 | 240220 | 1583.05 | 648 | 652 | 151.3 |
| D | 8 | 195 | 825742 | 5189.98 | 642 | 623 | 159.0 |
| D | 13 | 249 | 311273 | 1953.98 | 642 | 623 | 159.0 |
| D | 1 | 52 | 303975 | 1908.08 | 642 | 623 | 159.0 |
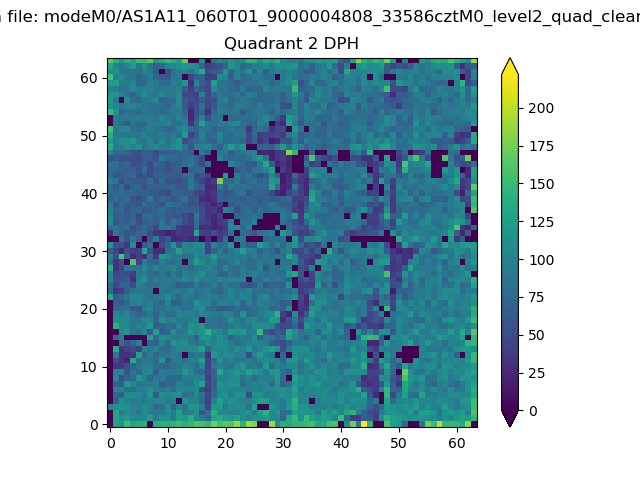
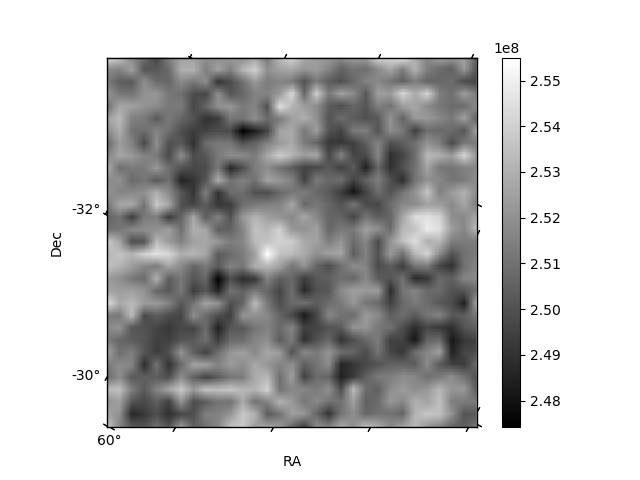
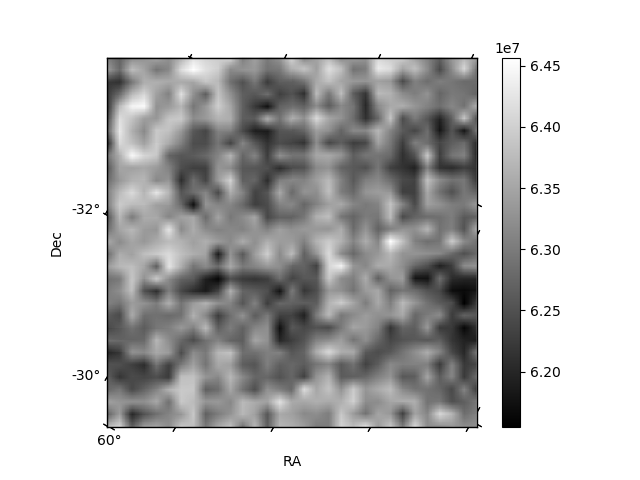
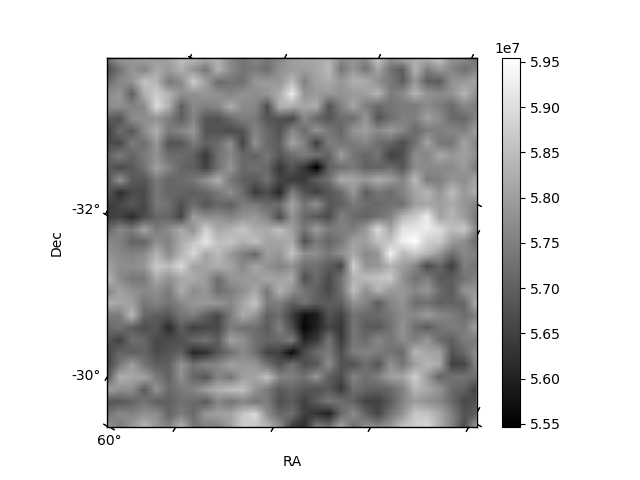
Histogram calculated using DETX and DETY for each event in the final _common_clean file
| Quadrant A | 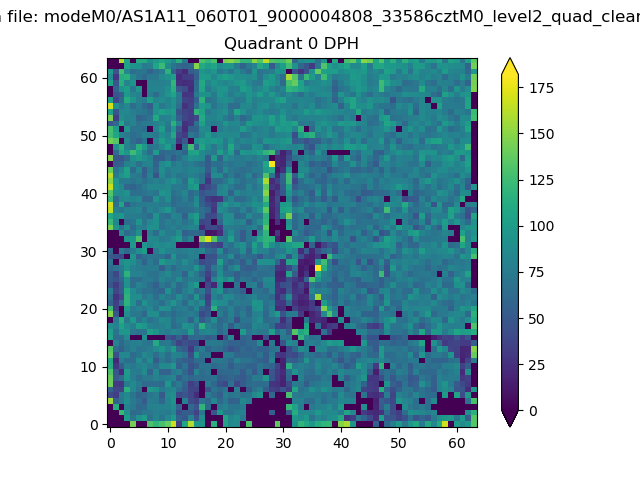 |
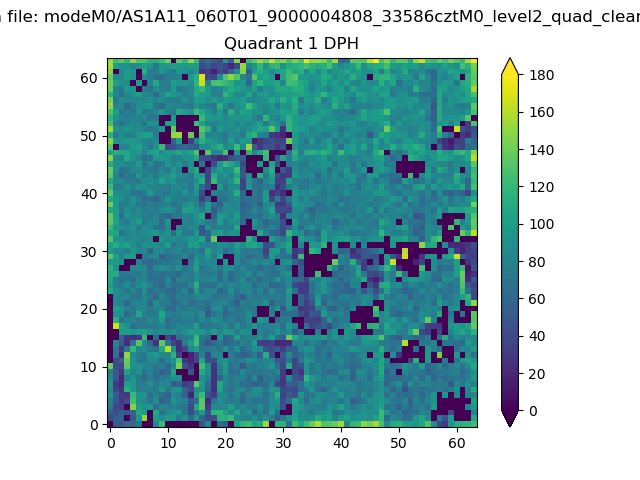 |
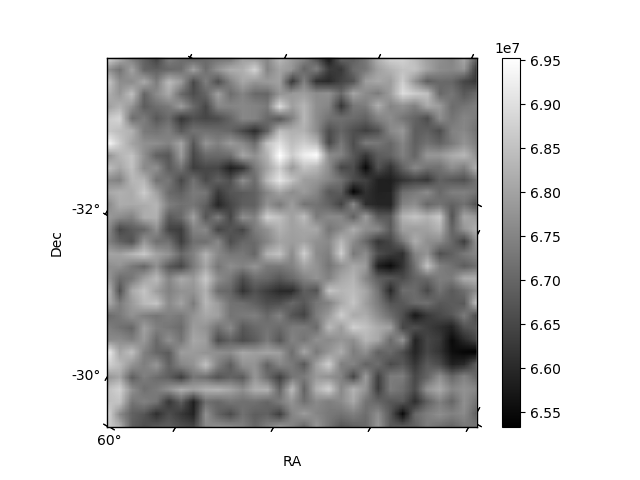
Quadrant B |
|---|---|---|---|
| Quadrant D | 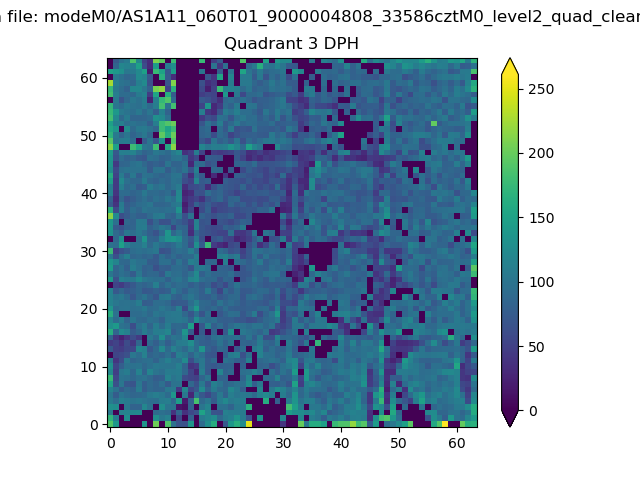 |
 |
Quadrant C |
| Plot type | Count rate plots | Images |
|---|---|---|
| Comparison with Poisson distribution Blue bars denote a histogram of data divided into 1 sec bins. Red curve is a Poisson curve with rate = median count rate of data. |
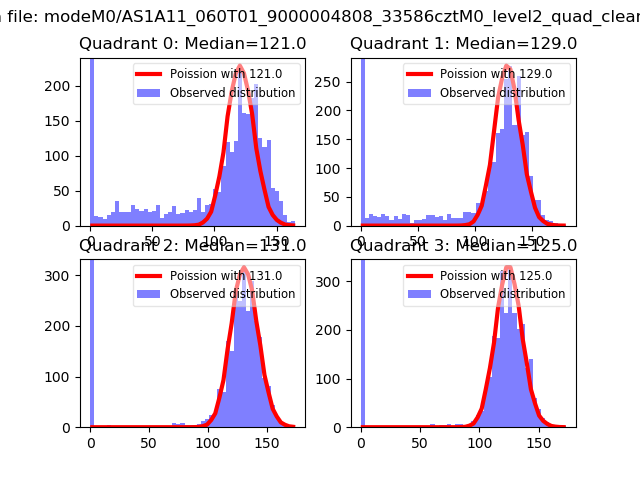 |
 |
| Quadrant-wise count rates Data is divided into 100 sec bins |
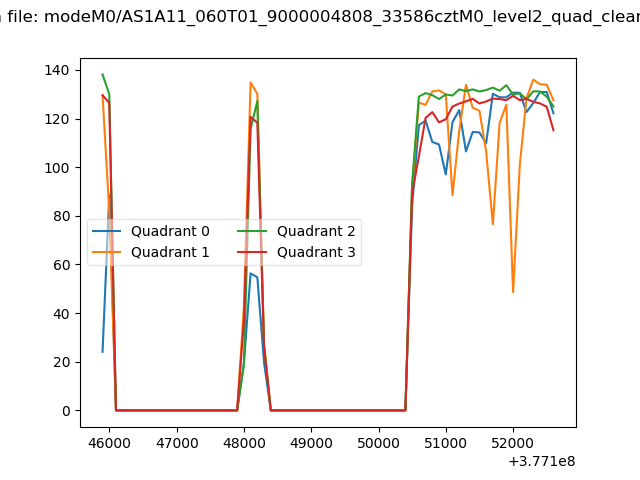 |
|
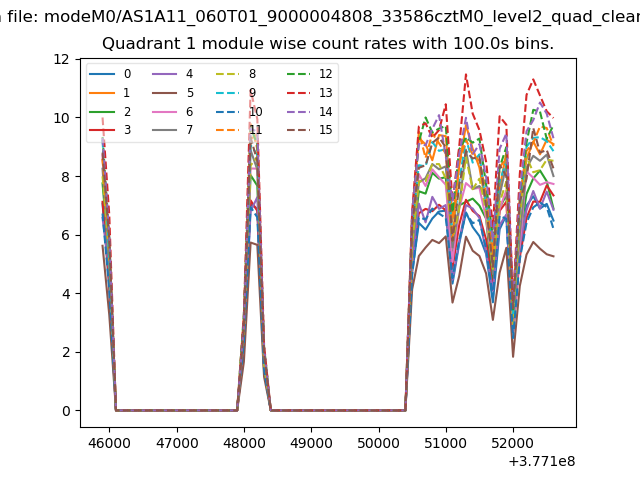
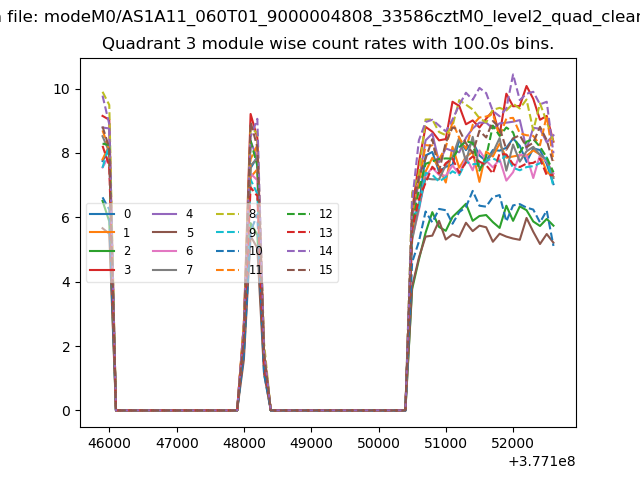
| Module-wise count rates for Quadrant A Data is divided into 100 sec bins |
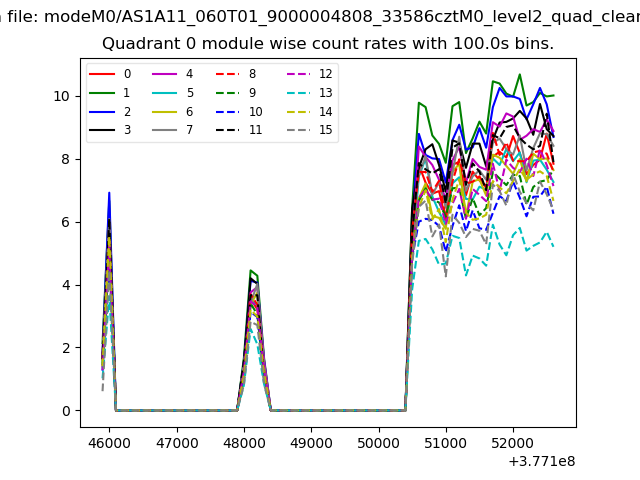 |
 |
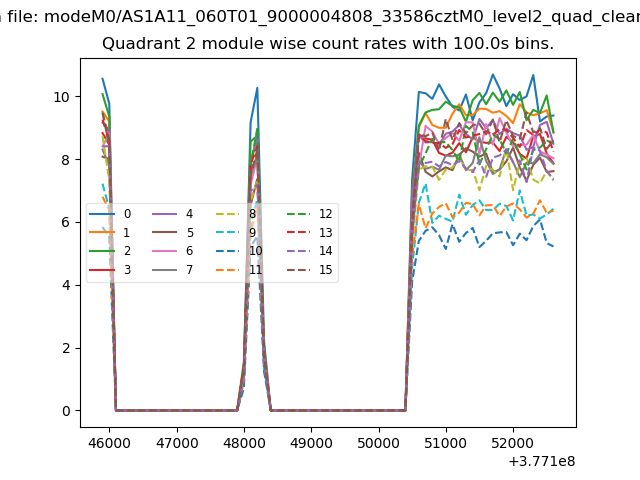
| Module-wise count rates for Quadrant B Data is divided into 100 sec bins |
 |
 |
| Module-wise count rates for Quadrant C Data is divided into 100 sec bins |
 |
 |
| Module-wise count rates for Quadrant D Data is divided into 100 sec bins |
 |
 |
| Parameter | Plot |
|---|---|
| CZT HV Monitor | 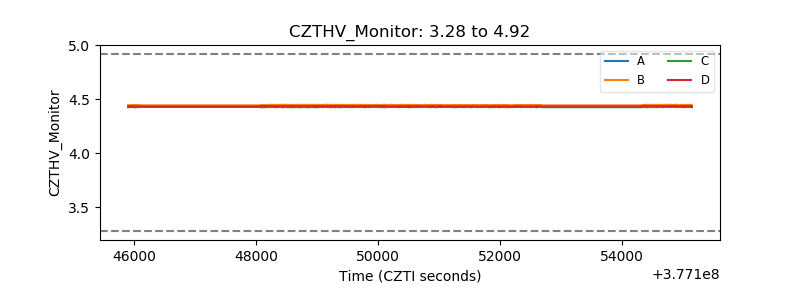 |
| D_VDD | 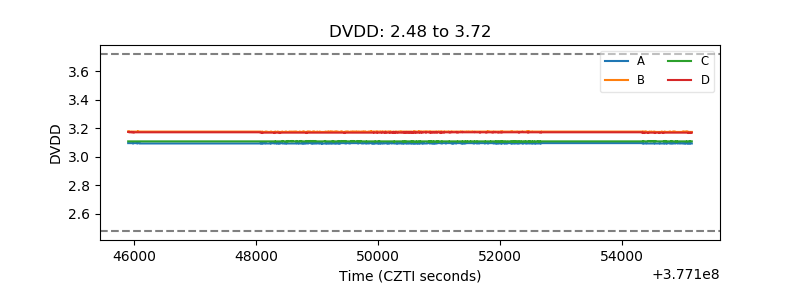 |
| Temperature 1 | 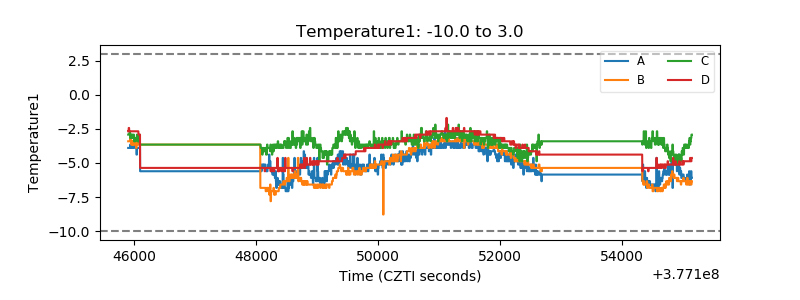 |
| Veto HV Monitor | 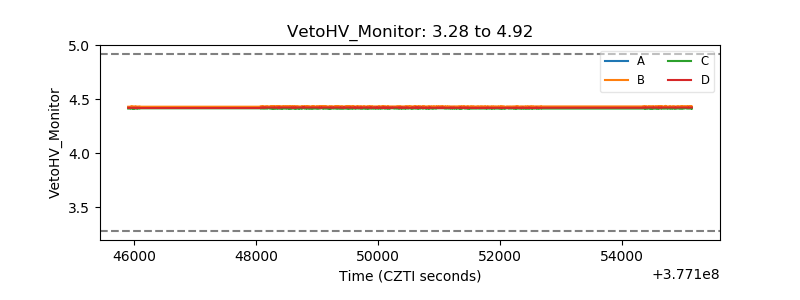 |
| Veto LLD | 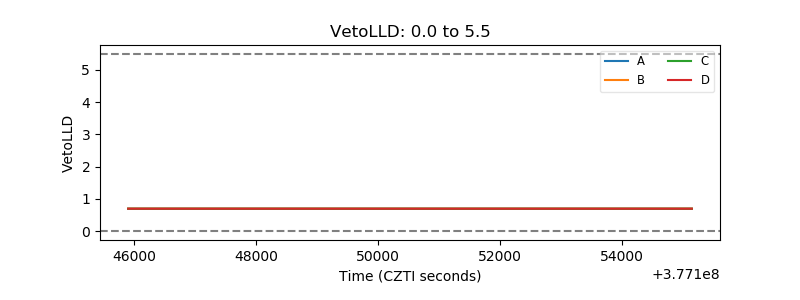 |
| Alpha Counter | 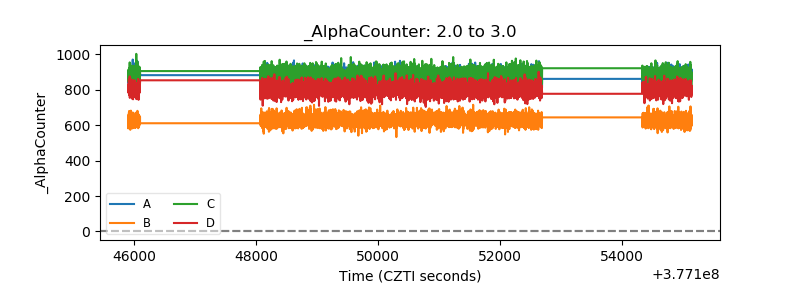 |
| _CPM_Rate | 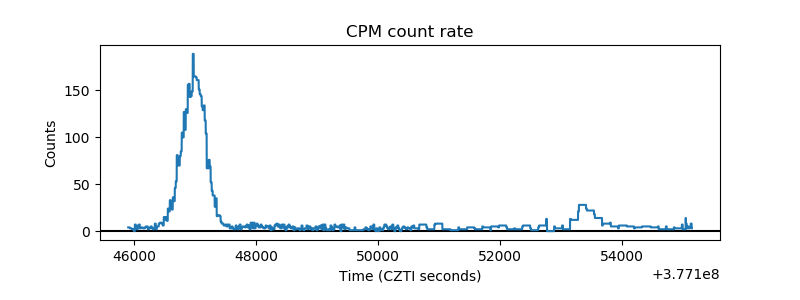 |
| CZT Counter | 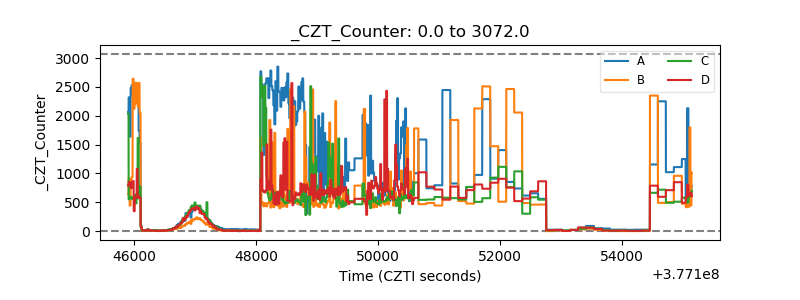 |
| +2.5 Volts monitor | 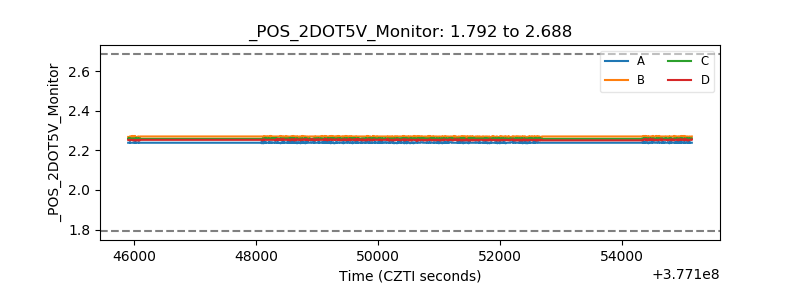 |
| +5 Volts monitor |  |
| _ROLL_ROT | 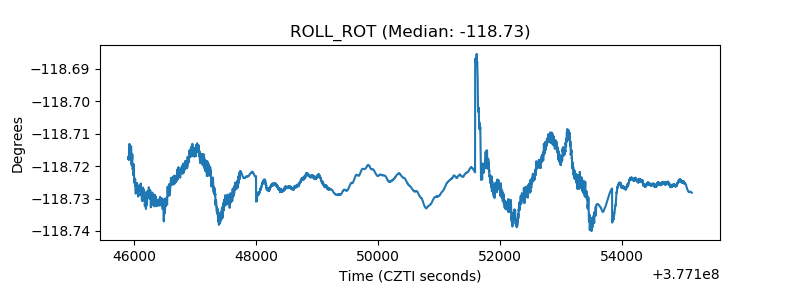 |
| _Roll_DEC | 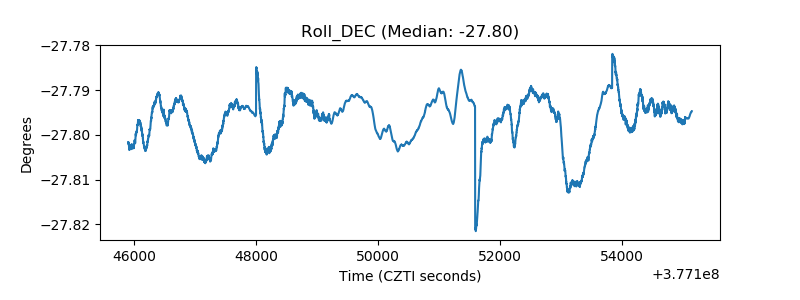 |
| _Roll_RA | 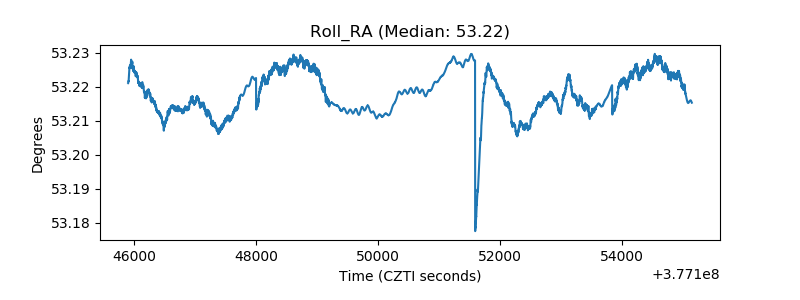 |
| Veto Counter | 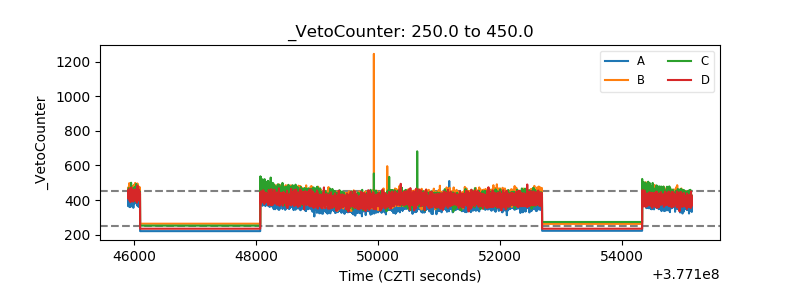 |